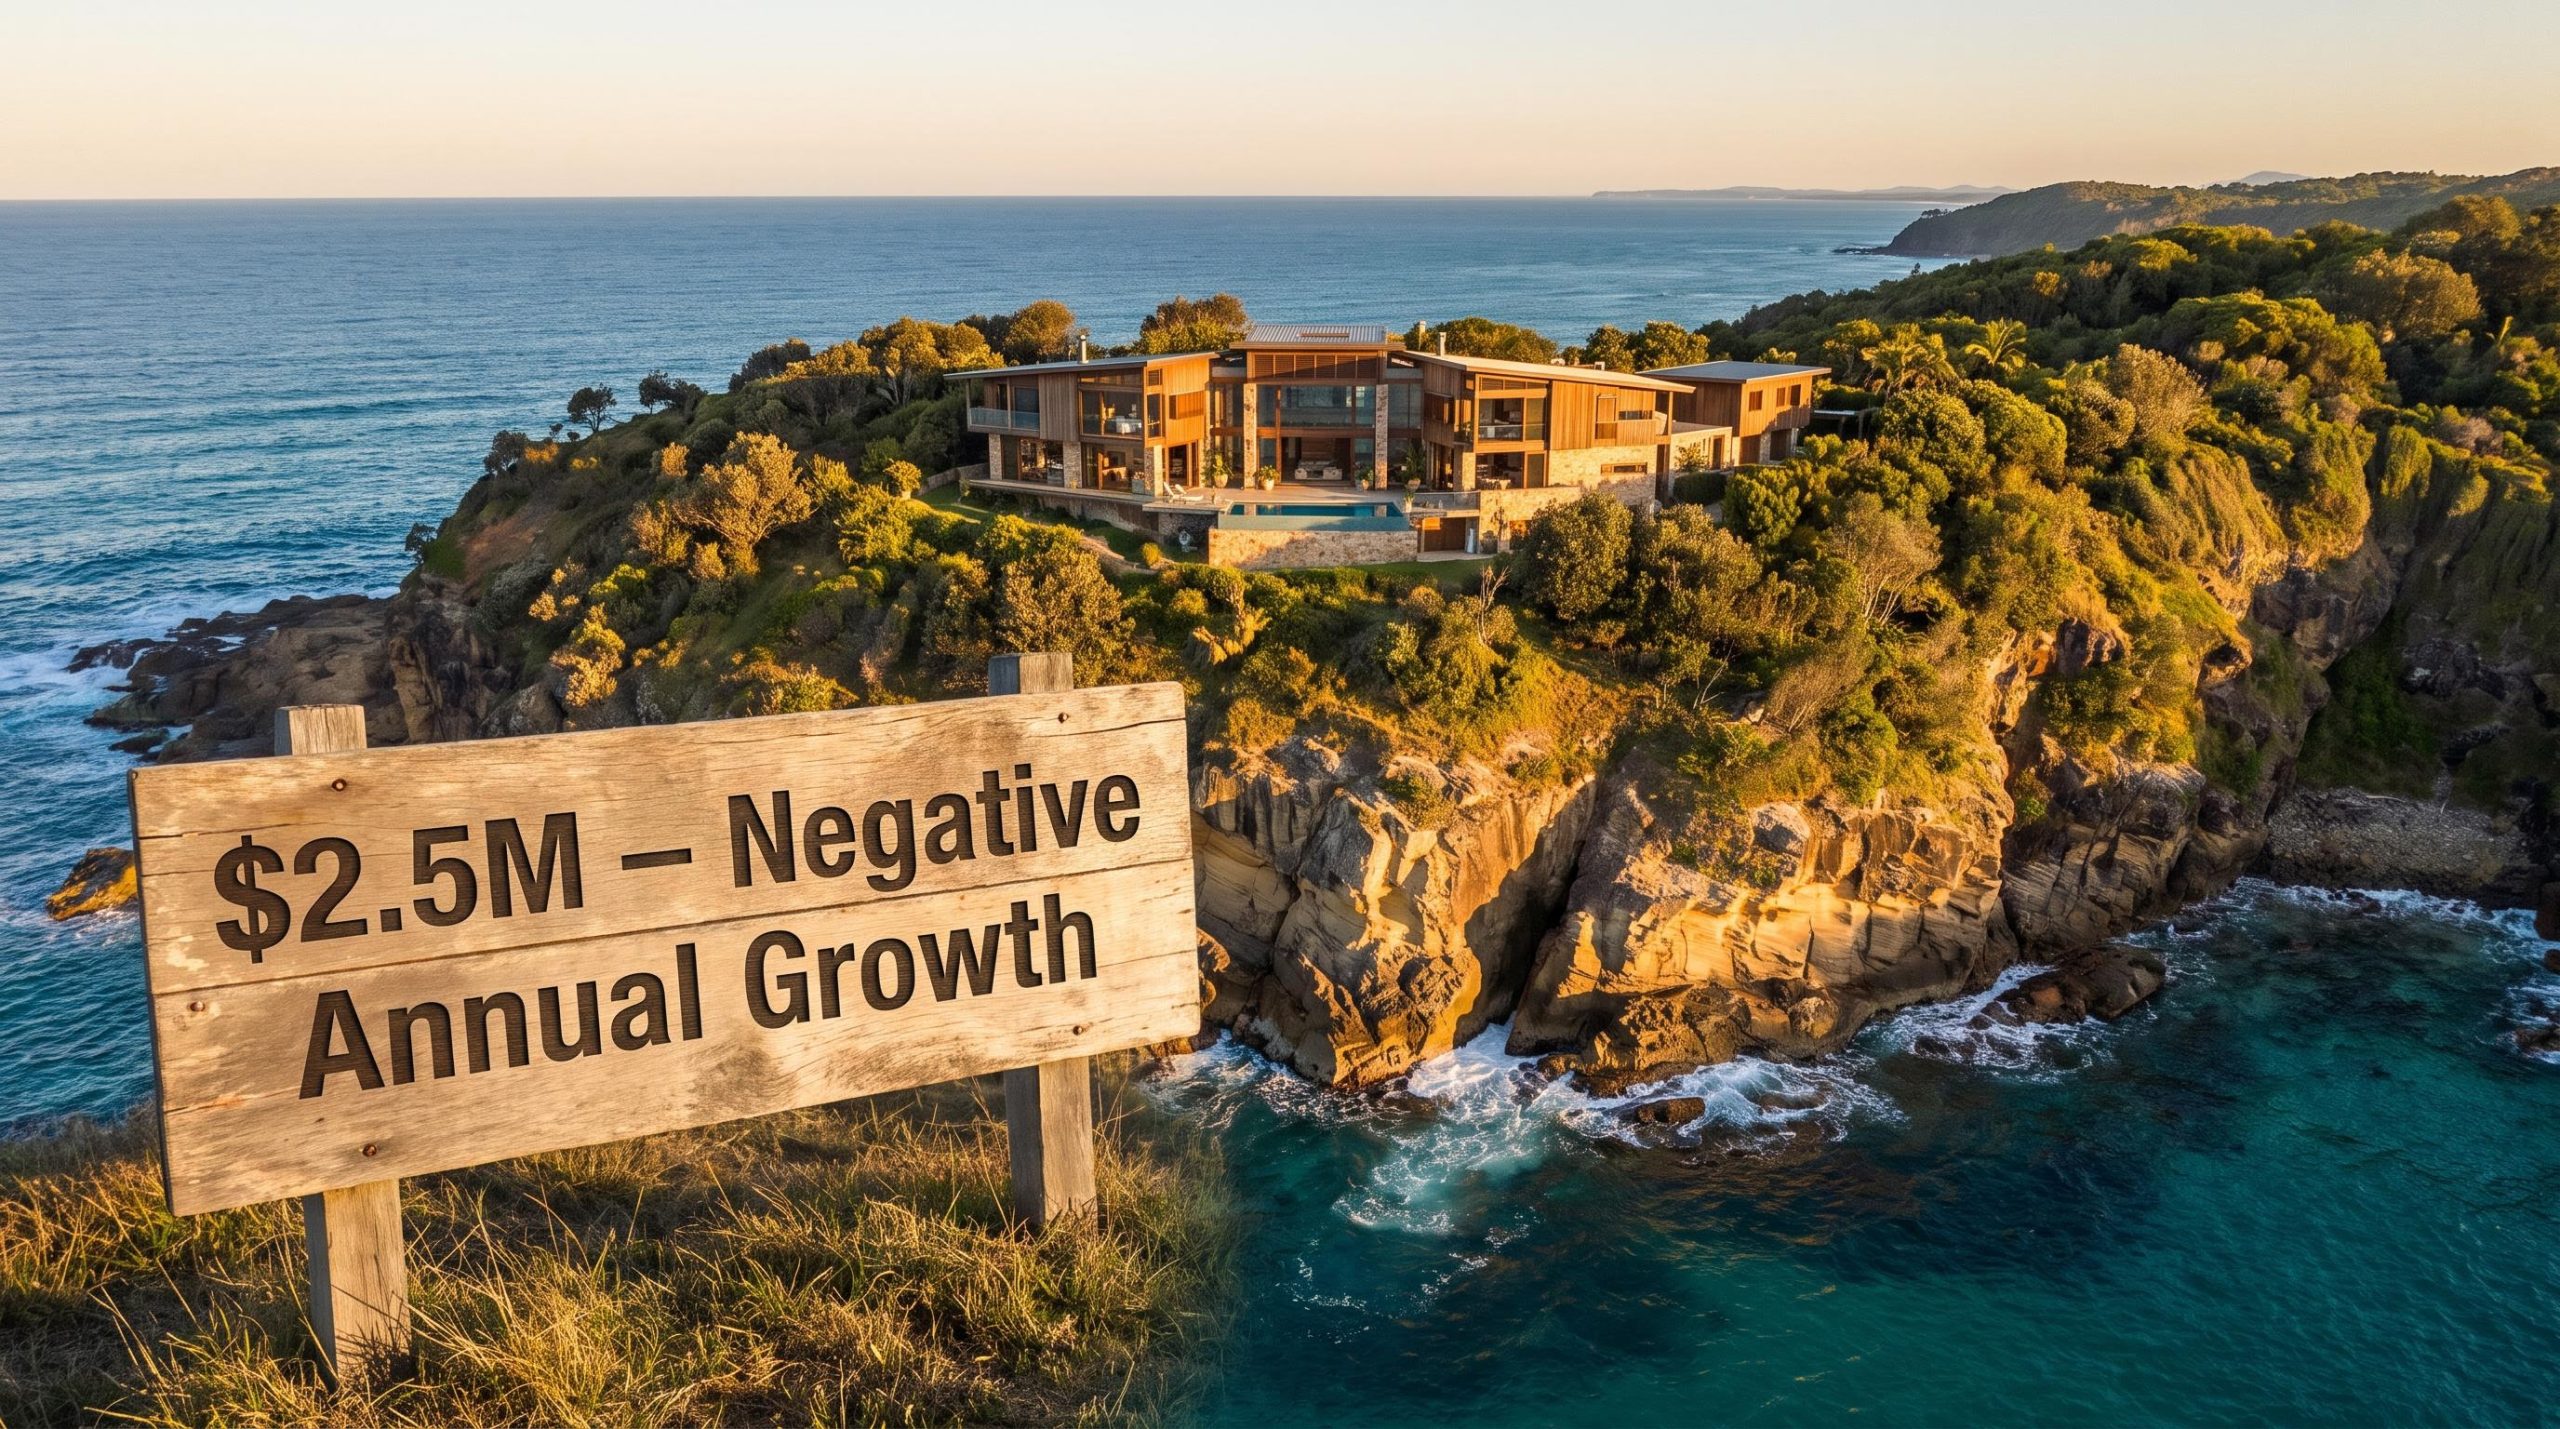
Byron Bay carries a median house price of roughly $2.5 million, and yet its annual growth is running in negative territory. That combination should stop you.
A price tag that size normally signals a market with momentum behind it, buyers competing, values climbing. Byron Bay is doing the opposite, and it is not alone. Premium coastal markets across Australia are posting the kind of price levels that imply strength while their direction of travel points firmly down.
The backdrop is a national correction that has now run for five straight months. National dwelling values are 3.6% below their March 2026 peak, and during winter 93% of capital city suburbs recorded falling values. These forces are landing on premium coastal destinations with unusual severity, because those markets lean so heavily on discretionary and investor buyers.
What follows here maps the specific mechanisms driving that coastal underperformance, from serviceability maths to the investor retreat, and sets out what each one means if you are weighing a purchase in these markets at today’s prices. The short version: the price is not the whole story, and the direction is the part that should shape your decision.
Five consecutive months of falls and where coastal markets sit in the data
The national picture is not a soft patch. According to CoreLogic’s Home Value Index released on 1 September 2026, national dwelling values fell 0.9% in August, the fifth consecutive monthly decline. That left values 3.1% lower over three months and 3.6% below the March 2026 peak, with the national median dwelling value sitting at $912,885.
The breadth of the decline is what gives it weight.
During the winter of 2026, 93% of capital city suburbs recorded falling values, according to CoreLogic.
The steepest corrections are concentrated at the top of the market. CoreLogic data from early September showed Sydney’s top-quartile house values sitting 10.7% below peak, with Melbourne’s equivalent segment down 10.5%. That upper tier is the lens through which to read coastal performance, because premium coastal destinations occupy this segment by price.
Coastal prices are still high, but the direction has changed
Price level and price direction are two different variables, and coastal markets show the gap clearly. Entry prices remain extreme; momentum has turned negative.
The Sunshine Coast median dwelling value stood at $1.265 million in early September, with standalone houses averaging $1.35 million, per CoreLogic. Byron Bay’s median house price was around $2.5 million with negative annual growth. Neither is a distressed market by price. Both are underperforming by momentum, and CoreLogic anticipated further declines in key coastal regions beyond the August reporting period.
| Market | Median Value | Recent Change | Context |
|---|---|---|---|
| National (all dwellings) | $912,885 | -0.9% (Aug 2026) | Fifth straight monthly fall |
| Sydney top quartile | Premium tier | -10.7% from peak | Steepest metro correction |
| Melbourne top quartile | Premium tier | -10.5% from peak | Upper-tier led decline |
| Sunshine Coast | $1.265M ($1.35M houses) | Further falls expected | High price, negative momentum |
| Byron Bay | ~$2.5M | Negative annual growth | Premium tier, direction turned |
The premium coastal data does not describe cheap assets falling. It shows you that the segment where prices are highest and buyers most discretionary is also the segment where momentum has turned most decisively. If you are treating current coastal pricing as a floor, that distribution is a warning, not a reassurance.
The price-to-income deterioration underpinning the coastal correction is part of a longer arc: the structural tailwinds in Australian property, most critically the multi-decade fall in real interest rates, have now reversed, and KPMG analysis confirms that the capital gain outcomes available to buyers entering today differ fundamentally from those generated by the 1990s and 2000s entry cohorts.
When big ASX news breaks, our subscribers know first
Why coastal markets carry structural exposure the national data does not show
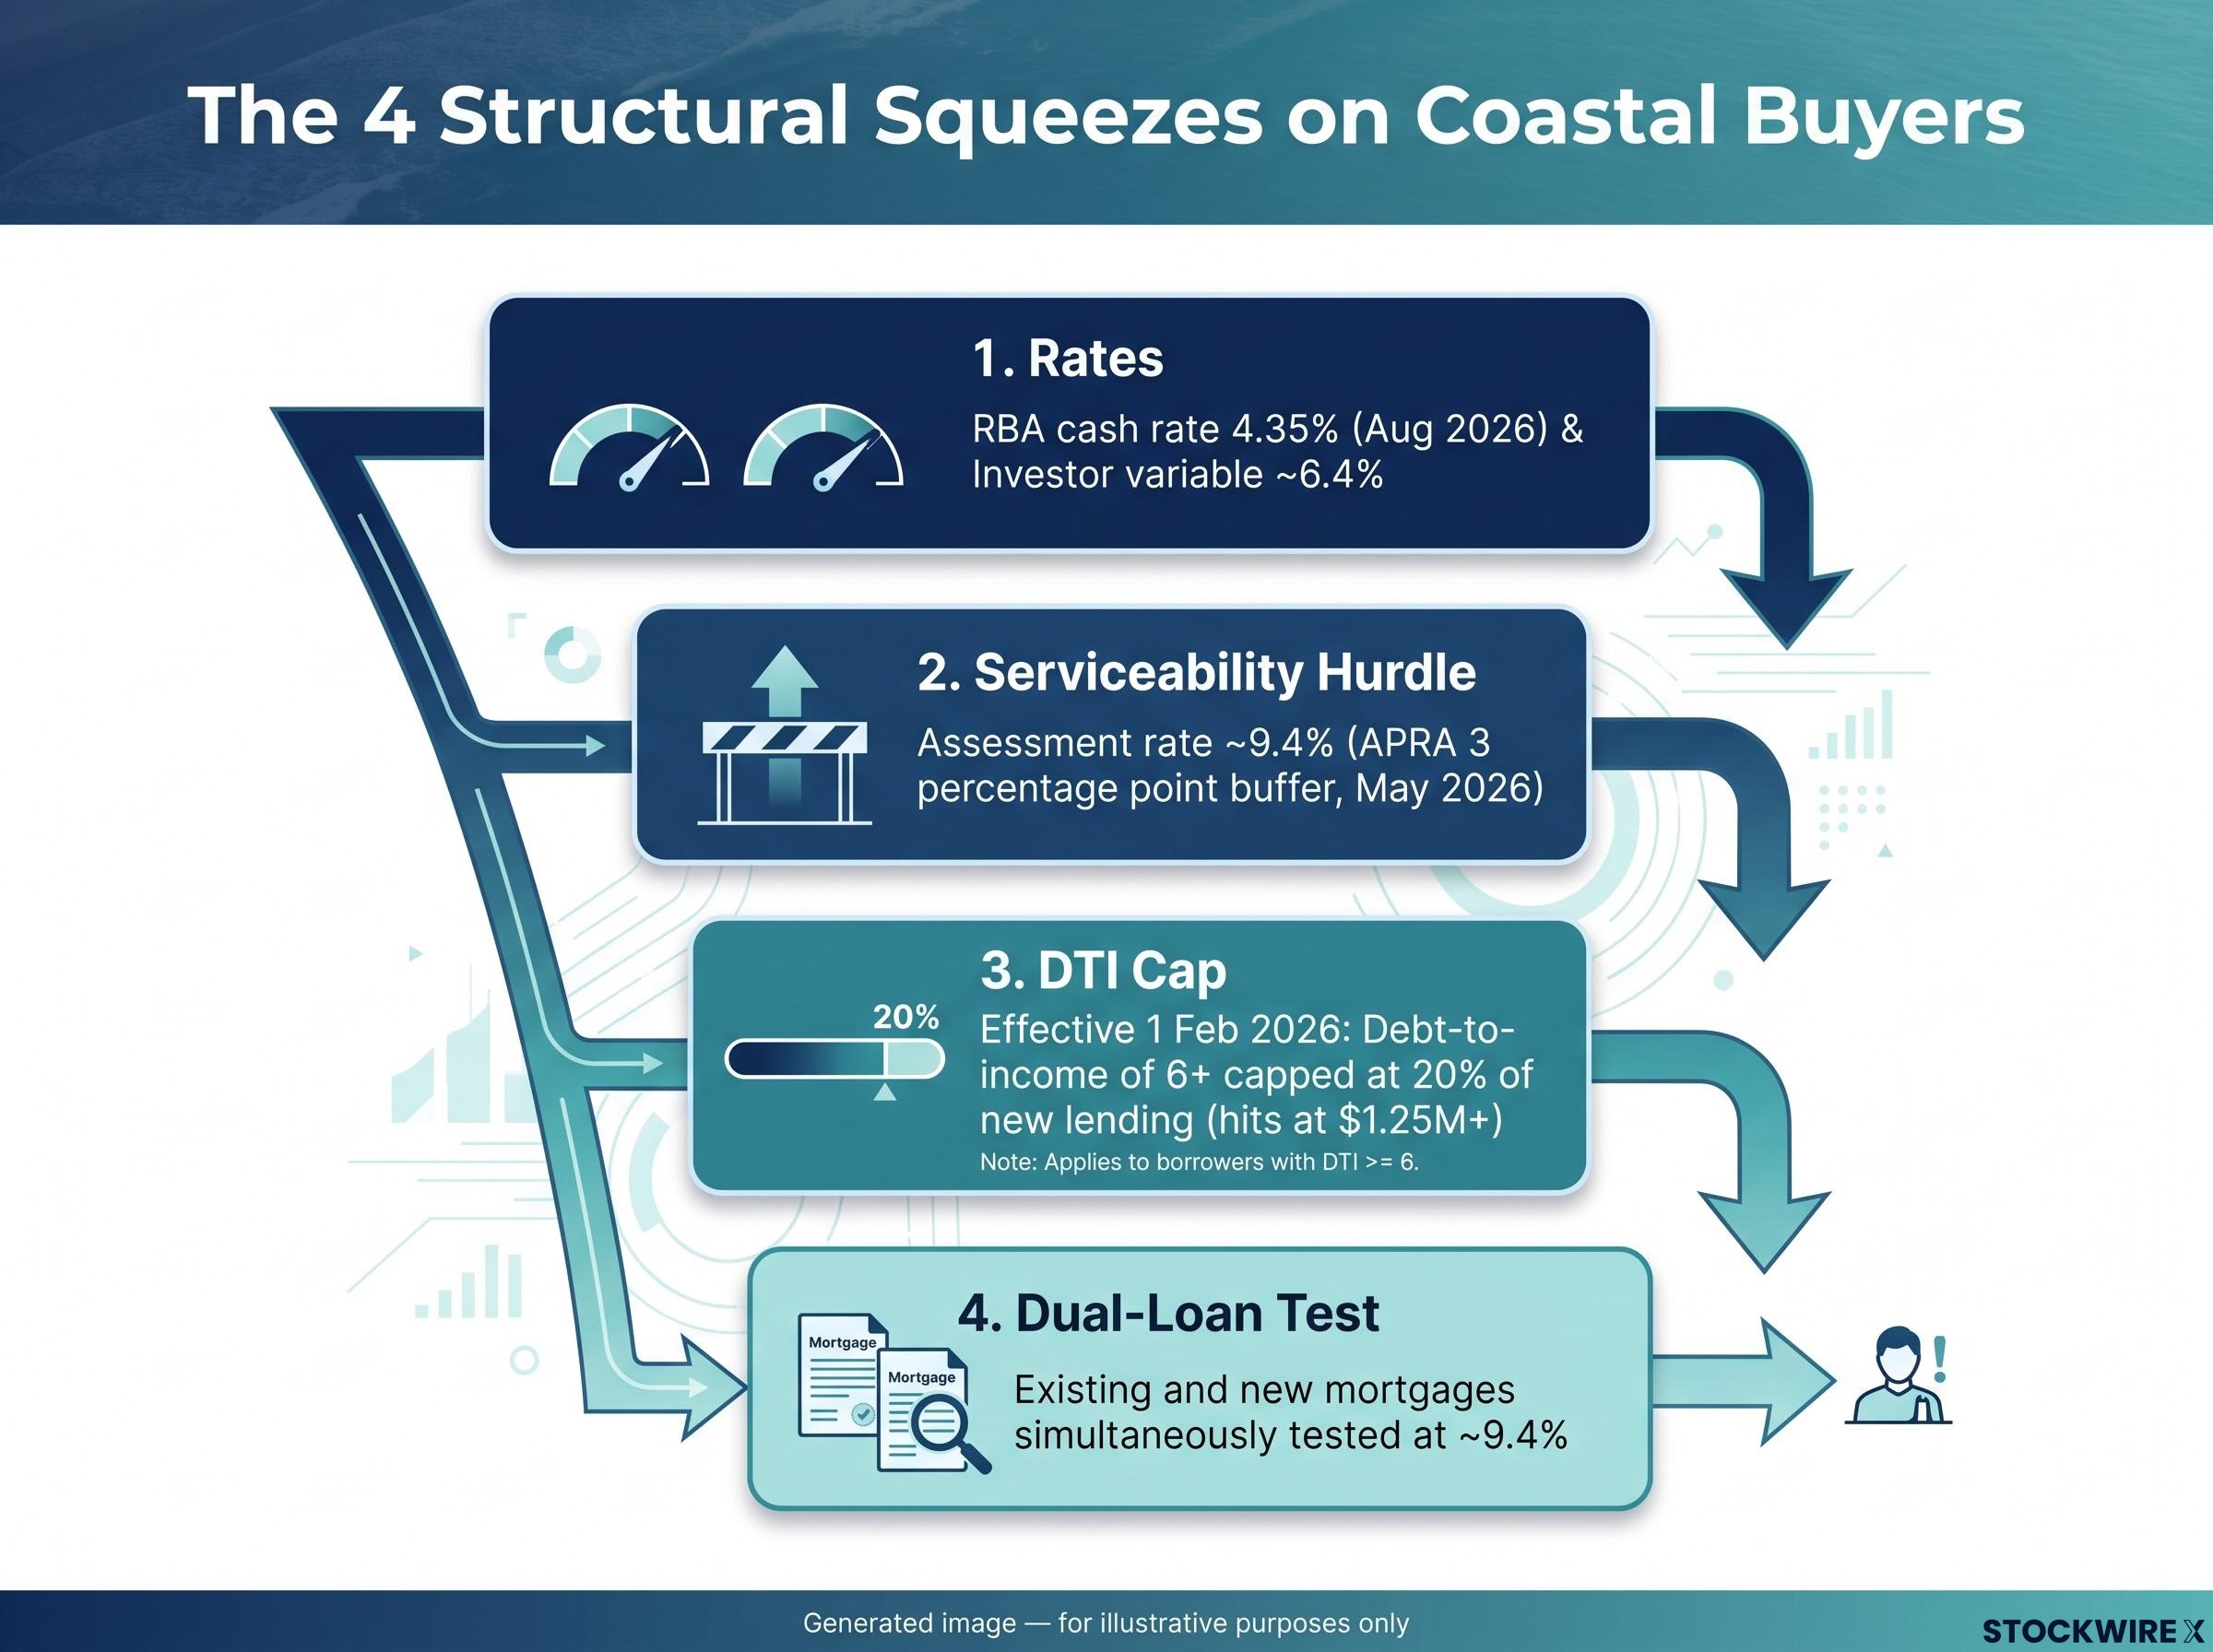
Premium coastal and holiday-home markets depend disproportionately on two buyer types: discretionary second-home buyers and investors. The current environment is hitting both at once, and the constraints compound. Four mechanisms tighten in sequence.
- Higher rates and the serviceability hurdle. The RBA held the cash rate at 4.35% at its August 2026 Board meeting. Investor variable rates sit near 6.4%, but lenders must assess borrowers at roughly 9.4%, per PIPA analysis from August 2026.
- The DTI cap on high-price lending. APRA’s debt-to-income limit, effective 1 February 2026, restricts high-DTI loans (a debt-to-income ratio of six or more, meaning total borrowings of six times gross income) to 20% of new lending, per the RBA’s Financial Stability Review.
- Holiday home classification. Most lenders treat holiday homes as investment products, not owner-occupier loans, which attracts the higher rate and stricter servicing test automatically.
- The dual-loan test. A buyer already holding a primary mortgage must prove they can service both loans simultaneously at the stress-test rate.
Each link tightens the one after it. The serviceability buffer, confirmed by APRA in May 2026 at three percentage points above the loan rate, sets the assessment level. That level then interacts with the DTI cap, because properties priced at $1.25 million and above routinely push DTI ratios to six or beyond, which is exactly where the 20% cap bites.
The operative stress-test rate is approximately 9.4%. For most buyers in this segment, that number, not the advertised rate, determines whether a purchase is possible.
Here is what that means in practice. If you are eyeing a $1.5 million coastal property while still carrying a Sydney mortgage, the 9.4% figure is not a technicality. It is the number the lender applies to both loans at once, and it is frequently the difference between the transaction being possible and being declined. That is why coastal markets cannot be read as premium metropolitan property with better scenery. The structural exposure is different in kind, not just degree.
The investor retreat and what it means for market liquidity
Investor participation in Australian housing ran hot into early 2026. Investor share of total housing lending reached a record 41% by volume in the March quarter, per Australian Property Update, and investor balances climbed from $752.1 billion in June 2025 to $800.5 billion by March 2026, a $48.4 billion rise over nine months, per BrokerNews.
Then the direction reversed, and it did so with increasing speed.
- March quarter 2026: Investor loan commitments fell 5.3% by number to 57,342, and 3.0% by value to roughly $41.5 billion.
- June quarter 2026: Investor loans led the retreat, falling a further 8.6% after a 4.7% drop the prior quarter, per The Guardian citing ABS data.
- July 2026: Monthly investor balance growth slowed to just 0.1%, around $1.1 billion, the weakest monthly increase since February 2024, according to Canstar.
| Period | Loan Commitments Change | Balance Growth | Note |
|---|---|---|---|
| March quarter 2026 | -5.3% by number | Rising, +9% YoY | Record 41% share by volume |
| June quarter 2026 | -8.6% (after -4.7%) | Slowing | Investors led the decline |
| July 2026 | Continued softening | +0.1% monthly | Weakest since Feb 2024 |
The composition of investor debt sharpens the risk.
Around 40% of new investor lending since 2018 has been interest-only, compared with 8-12% for owner-occupiers, according to RBA research. Interest-only means the borrower repays only the interest for a set period, not the principal, which leaves the debt fully intact when that period ends.
This matters more for coastal markets than for diversified metropolitan suburbs. Lifestyle and holiday-home destinations are structurally dependent on investor and discretionary demand. When a suburb has a deep owner-occupier base, a cooling investor cohort barely dents liquidity. When a market leans on investors as the price-setting marginal buyer, their withdrawal thins the pool quickly.
The shift from 9% year-on-year balance growth to a 0.1% monthly increment in the space of months is not a gentle cooling. It signals that the buyers most willing to pay premium prices for coastal assets are stepping back at the same moment those assets are repricing down. For you, that means longer time-on-market and narrower exit options if you need to sell. The RBA’s Financial Stability Review noted early evidence of riskier lending ticking up alongside investor credit growth, which is part of why regulators are watching this cohort closely.
The investor retreat documented in the lending data is running alongside a separate structural headwind: negative gearing reform that removes the concession on established residential properties purchased after 12 May 2026, a change that alters the after-tax return calculus for the same discretionary buyer cohort most active in coastal markets.
Structural repricing or cyclical correction, and why the distinction matters for coastal buyers
Two frameworks explain the downturn, and they point to opposite conclusions about whether today’s coastal prices are an opportunity or a warning.
The structural view holds that this is a lasting repricing. The RBA’s sustained hold at 4.35% freezes borrowing capacity at a reduced level while prices adjust downward. APRA’s macroprudential architecture, the serviceability buffer plus DTI caps, functions as intentional and durable guardrails rather than temporary settings. Property Investment Professionals of Australia argued the August hold entrenches rather than arrests the downturn. Under this reading, the premium coastal segments most inflated by cheap credit face the deepest and most persistent corrections.
The cyclical view reads the same data as policy-induced cooling. Housing credit is still growing at roughly 5.2% annualised, with investor credit at approximately 6.8%, per the August 2026 RBA Chart Pack, a balanced pace rather than a collapse. Investor balances remain elevated at around $821.4 billion, and the record 41% investor share in the March quarter shows participation is still substantial even as growth moderates.
| Structural Repricing View | Cyclical Correction View |
|---|---|
| Cash rate held at 4.35% freezes borrowing capacity at a lower level | Credit still growing ~5.2% annualised, a non-speculative pace |
| APRA DTI caps and buffer are permanent guardrails | Investor balances remain elevated above $821 billion |
| Premium coastal markets face deeper, lasting corrections | Record 41% investor share shows participation intact |
| PIPA: August hold entrenches the downturn | Cooling could stabilise once monetary policy normalises |
What the weight of evidence suggests for mid-2026
Several signals lean structural. APRA’s macroprudential settings show no sign of loosening. Investor lending has decelerated across three consecutive measurement points, from the March quarter fall to the June quarter’s 8.6% drop to July’s near-flat balance growth. The RBA has signalled its intention to hold at 4.35% for an extended period.
The countervailing signals are real and should not be dismissed. Balances remain high, and credit growth of 5-6% annualised is not the profile of a market in freefall.
Morgan Stanley’s housing correction forecasts, projecting a fall of up to 10% by end-2027, were built on the same three variables this article tracks: the sustained cash rate hold, compressed borrower capacity, and the structural policy headwind from negative gearing reform layered on top of the cyclical pressure.
On balance, as at mid-September 2026, the evidence leans structural. But the pathway back to rate normalisation is the one variable the data cannot resolve. That matters directly for you: if the structural view holds, Byron Bay and Sunshine Coast prices are a repricing still in motion, not a discounted entry point. If the cyclical view holds, stabilisation becomes possible once policy eases.
What the current environment means for buyers weighing coastal property now
If you are considering a coastal purchase, the analysis above translates into five specific risks, ordered by immediacy.
- Serviceability stress. You must be assessed at roughly 9.4%, well above the advertised rate near 6.4%.
- DTI constraint. APRA’s cap limits high-DTI loans to 20% of new lending, and coastal price points routinely push borrowers past the DTI-of-six threshold.
- Interest-only structure risk. With interest-only representing around 40% of new investor lending, refinancing and cash-flow exposure is elevated in a sustained high-rate environment.
- Liquidity exposure. Investor commitments fell 8.6% in the June quarter, thinning the buyer pool that sets coastal prices.
- Regulatory tightening risk. The RBA flagged riskier lending ticking up, and further APRA constraints remain possible.
The dual-loan test deserves particular attention.
Approximately 9.4% is the single number that determines whether entry is structurally possible for most buyers in this segment. If you hold an existing mortgage, both loans must clear that rate simultaneously.
Interest-only structures amplify the risk in low-yield holiday rental markets, where income is often seasonal and may not cover higher interest costs. Three principles follow:
CGT changes for property investors add a further layer of complexity to exit decisions in coastal markets, because the reform’s impact on after-tax proceeds varies significantly by city and holding period, meaning a Byron Bay seller and a Sunshine Coast seller face materially different tax outcomes from the same nominal price correction.
- Borrow conservatively relative to income, and stress-test your cash flow at the 9.4% assessment rate before treating any price correction as a discount.
- Avoid heavy reliance on interest-only structures in low-yield coastal segments.
- Treat thinning investor demand and longer time-on-market as a feature of this environment, not a temporary anomaly.
For a buyer at the $1.25 million to $2.5 million coastal price range, these are not frictions to wait out. They are the operating environment for the foreseeable future.
This article is for informational purposes only and should not be considered financial advice. Investors should conduct their own research and consult with financial professionals before making investment decisions. Past performance does not guarantee future results, and property projections are subject to market conditions and various risk factors.
Where the correction leaves coastal buyers by mid-September 2026
Pull the threads together and a coherent picture emerges. National values sit 3.6% below their March peak, with falls across 93% of capital city suburbs during winter. Premium coastal markets like Byron Bay and the Sunshine Coast carry structural exposures the national numbers alone do not reveal, and the investor cohort that sets their prices is retreating in real time. The weight of evidence, as at mid-September 2026, leans structural rather than cyclical.
For the coastal correction to stabilise or reverse, at least one of three things would need to shift: a meaningful cut to the cash rate restoring borrowing capacity, a loosening of APRA’s DTI limits, or a return of investor lending to its early-2026 pace. The RBA’s stated intention to hold at 4.35% for an extended period is the binding constraint on all three.
Your decision sits between what is reasonably known and what remains variable. Watch these signals for signs of stabilisation:
- Cash rate movements at future RBA Board meetings
- APRA policy updates on DTI limits or the serviceability buffer
- Monthly investor lending data for a genuine turn
- Coastal auction clearance rates as a liquidity gauge
The coastal correction is not an accident of sentiment. It is the product of specific, quantifiable credit and regulatory conditions, and those same conditions give you a clear set of indicators to track as new data arrives.