When you check the VIX, you probably look at one number: the headline spot price flashing on your screen. Right now that number is around 17, which sounds calm enough.
But that single figure hides almost everything worth knowing.
Professional traders barely glance at the spot VIX in isolation. They study the shape of the volatility futures curve, the prices of contracts expiring one month, two months, and three months out, because the relationship between those prices tells you something the spot number cannot: whether the market expects fear to fade in days or to grind on for months.
That distinction matters more than usual right now. A Federal Reserve decision lands on 17-18 September 2026, crude oil is sitting in the low-$100s, and both could reshape how volatility markets behave within the week.
Here is the framework professional desks use to read that curve, so you can tell the difference between a passing scare and a genuine regime change. By the time you finish, you will know exactly which structural shift on the curve signals that a correction is turning into something systemic.
What contango and backwardation actually tell you about fear
Start with the normal state of the world. Most of the time, the VIX futures curve slopes gently upward, a condition called contango. Contango means the nearer-dated contracts are priced below the later-dated ones.
That structure reflects a simple market belief: whatever anxiety exists today is expected to settle down over time. Longer-dated contracts trade higher because they carry a structural risk premium for the unknown, while the near-term contract stays lower because traders do not see immediate danger.
As of mid-September 2026, the curve is firmly in contango. The spread between the September and October VIX futures showed nearly two points of contango, and the gap between October and November sat at roughly 70 cents. In plain terms, the market is pricing near-term calm.
Now flip it. Backwardation is when that curve inverts, and the front-month contract trades above the deferred months.
This happens when real fear arrives. Investors rush to buy short-term protection against a falling S&P 500, which drives up front-month implied volatility faster than anything further out on the curve. The market is effectively saying the danger is now, not later.
That inversion is the signal that separates ordinary turbulence from a regime shift. Backwardation tells you institutional dealers expect elevated volatility to persist, rather than mean-revert within a few sessions.
The mechanics underneath reinforce this. Dealers are typically short volatility and long gamma, meaning they must hedge dynamically as prices move, and when tail risk spikes their risk budgets tighten fast. Higher funding costs also reduce their appetite to sell longer-dated volatility, which keeps the back end of the curve anchored while the front end spikes.
The curve is most powerful when you read it as a reflection of how macro policy, cost pressures, and positioning dynamics interact to shape expectations about the duration and intensity of future volatility, not just its level today.
Here is why this matters for your portfolio defence. When the spot VIX jumps but the curve stays in steep contango, you are looking at a short, violent scare the market expects to pass, so overreacting can cost you. When the curve actually inverts, that is your cue to move to high alert, because dealers are pricing genuine, lasting stress in real time.
When big ASX news breaks, our subscribers know first
What real market crashes looked like on the curve
Theory is one thing. The historical record is where the framework earns its keep, because the magnitude of the inversion has consistently tracked the severity of the crash.
The COVID crash of early 2020 remains the extreme benchmark. VIX futures entered backwardation of roughly 15 points, meaning the front-month contract traded that much higher than the next one out. That is the most severe modern inversion on record, and it accompanied one of the fastest equity collapses in market history.
Contrast that with the tariff-related market fears, a more moderate episode. Backwardation there reached only about four to five points, and it corresponded with an equity decline in the region of 20-30%. Meaningful, but nowhere near the systemic break of COVID.
The 2008 Global Financial Crisis showed what sustained inversion looks like. As Lehman Brothers collapsed and credit markets froze, the entire curve inverted, with the front-month VIX frequently pushing above 60-70 while longer-dated contracts, though elevated, sat lower. That inversion held for an extended stretch, coinciding with some of the largest weekly S&P 500 drops of the modern era.
This gives you a visual measuring stick. A 15-point inversion is a full systemic event; a four-point inversion is a serious but survivable correction. Knowing the difference lets you size your defensive trades to the actual scale of the threat.
| Historical event | Spot VIX peak | Backwardation magnitude | Market impact |
|---|---|---|---|
| 2008 Global Financial Crisis | Frequently above 60-70 | Sustained full-curve inversion | Among the largest weekly S&P 500 declines on record |
| COVID crash (2020) | Extreme, crisis-level | Approximately 15 points | Fastest modern equity collapse |
| Tariff-related fears | Elevated | Approximately 4-5 points | Roughly 20-30% equity decline |
| Volmageddon (Feb 2018) | Above 40 | Front-end inversion vs 3-month | Around 10% S&P 500 drawdown; XIV terminated |
When the inversion is structural rather than systemic
Not every inversion is a full-scale crash. February 2018, nicknamed Volmageddon, is the example to keep in mind.
When inverse-volatility exchange-traded products imploded, spot VIX surged above 40 and the front of the curve inverted against three-month maturities. Yet the S&P 500 drawdown was only around 10%. The XIV inverse-volatility product was terminated in February 2018 as short-volatility bets unwound violently.
The lesson for you is that a sharp inversion driven by forced position unwinds can look alarming without signalling economic collapse. The curve was screaming, but the underlying damage stayed contained. Reading the cause of the inversion matters as much as reading its size.
Reading the current curve against this week’s catalysts
So where does that leave you today? The current setup is a study in disconnect, and that disconnect is exactly what you should be watching.
On 14 September 2026, spot VIX closed at 17.10, up from a prior close of 15.84, with intraday quotes clustering between 16.7 and 16.8. That is elevated for a quiet market but nowhere near crisis territory. Paired with the steep contango on the futures curve, the volatility market is plainly not pricing an imminent collapse.
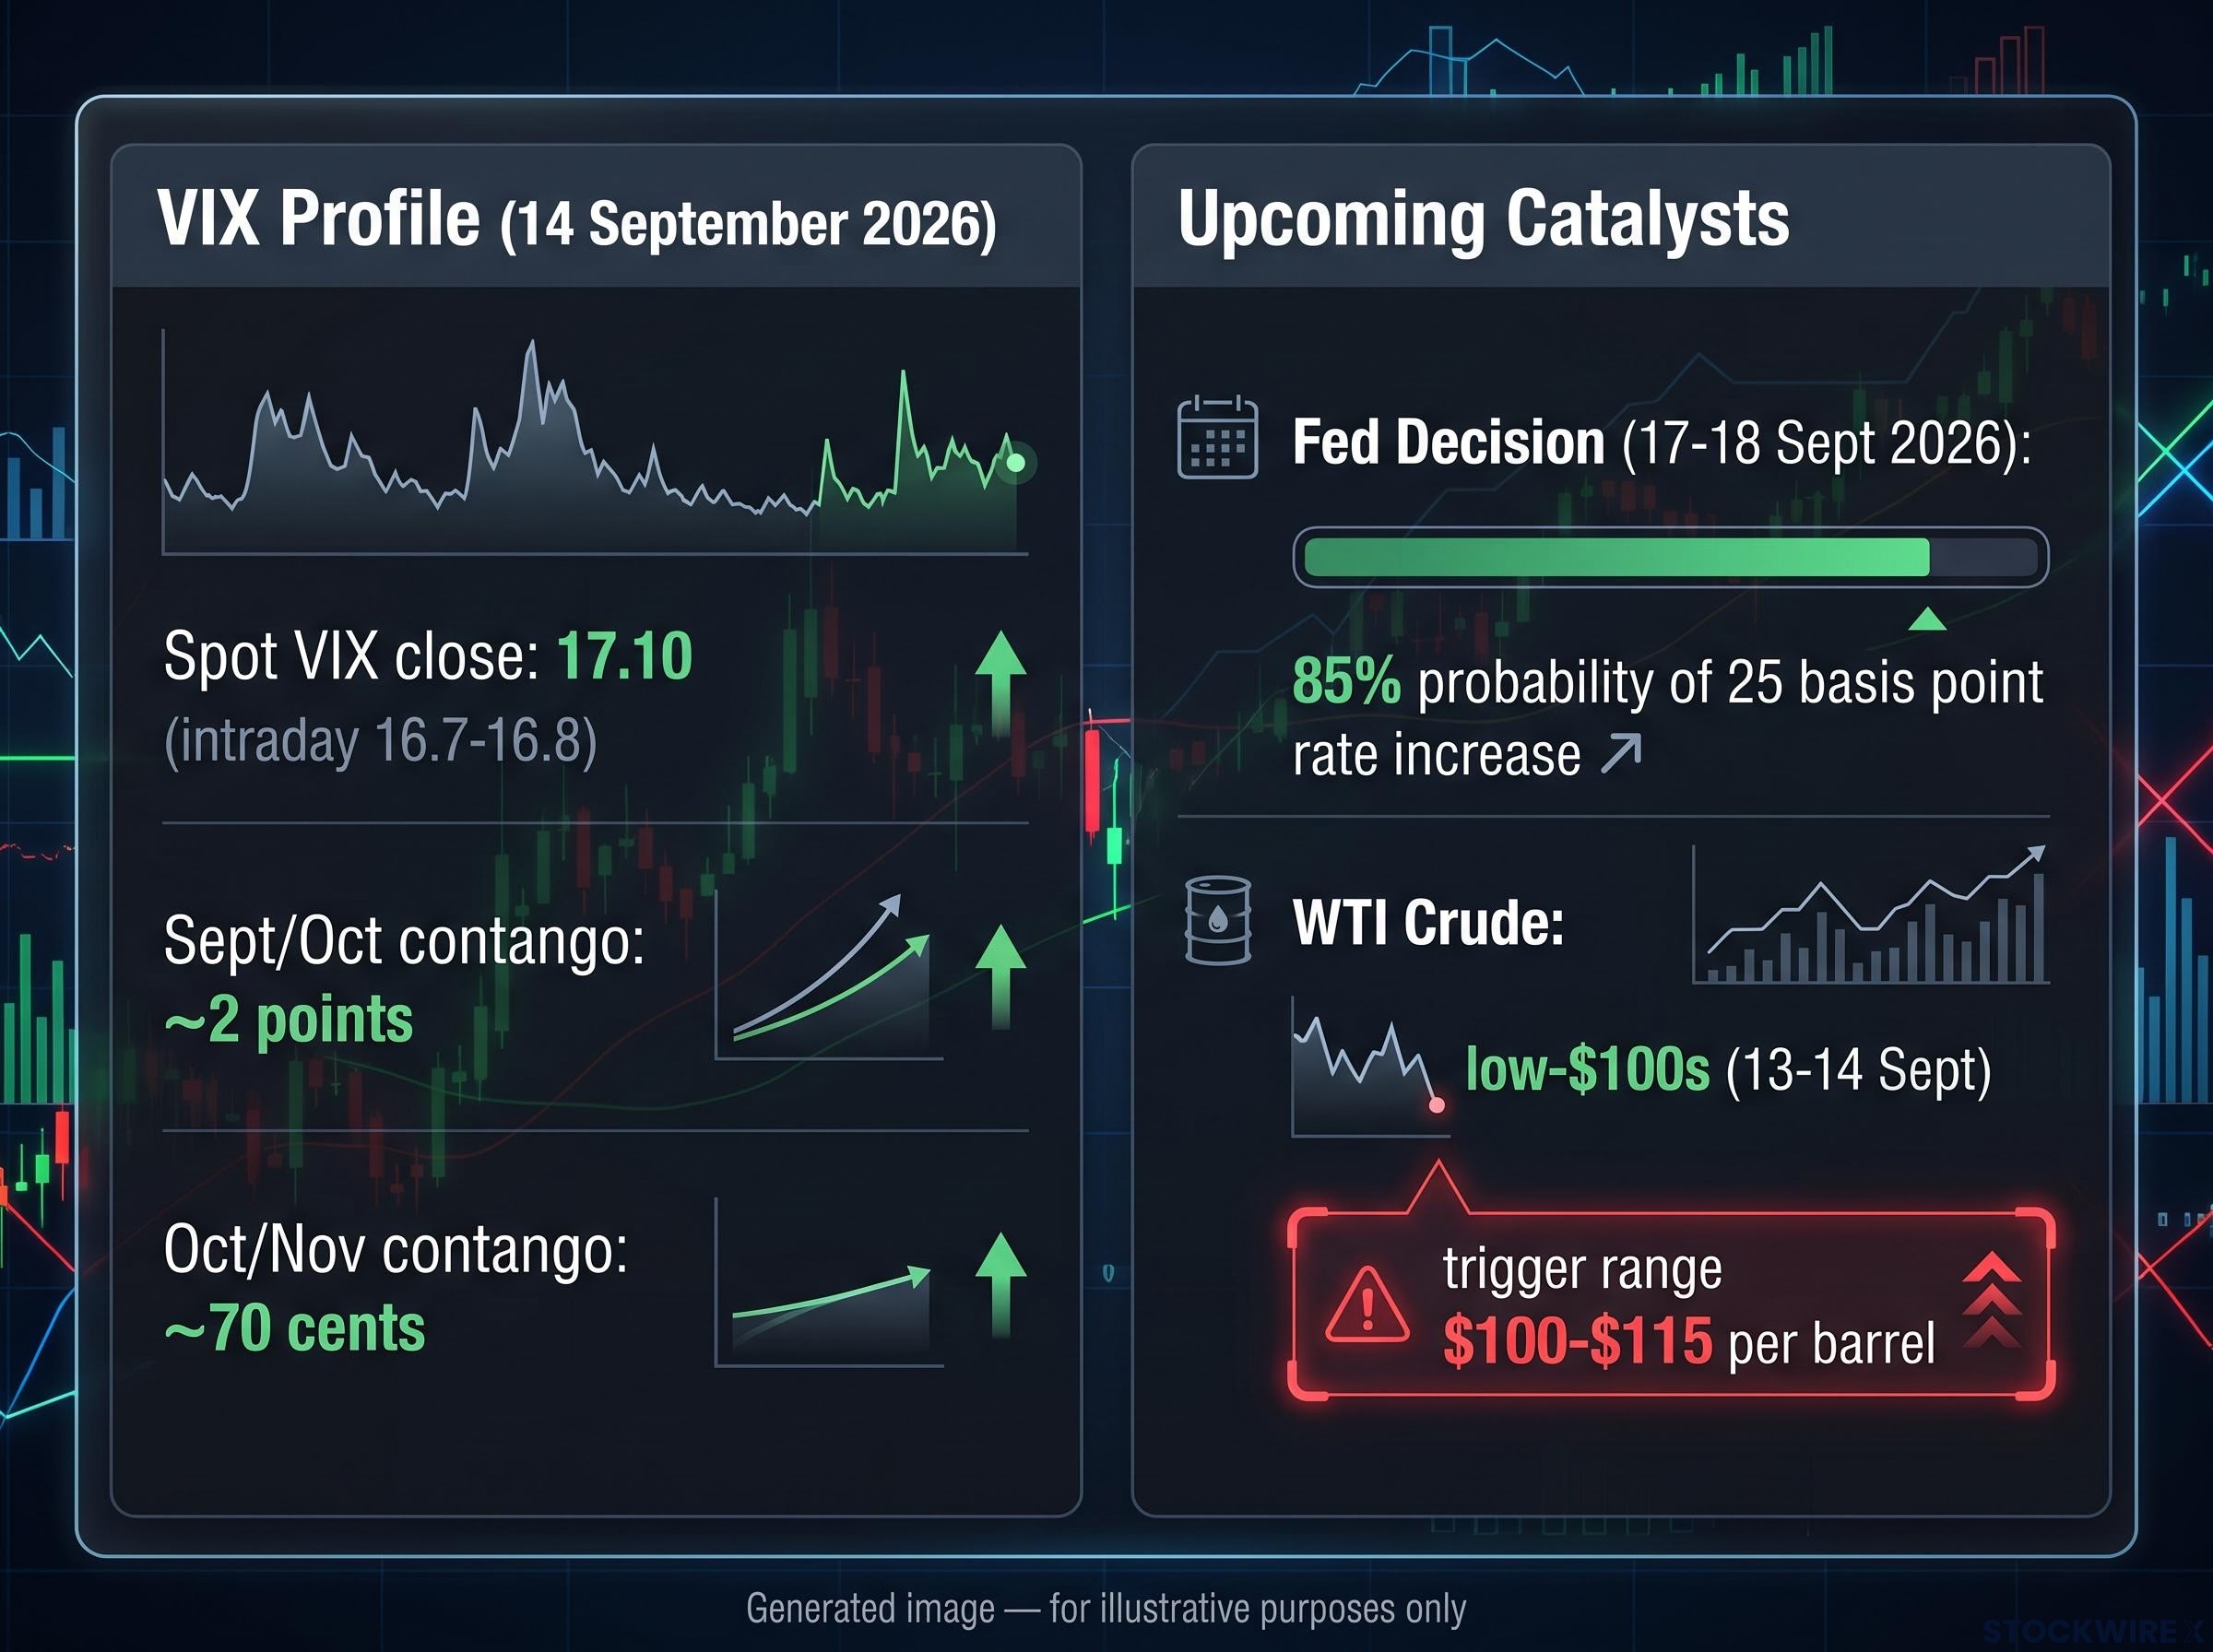
The first catalyst that could change that is the Federal Reserve. The policy decision on 17-18 September 2026 carries roughly an 85% probability of a 25 basis point rate increase, according to market pricing.
The rate move itself is largely expected. The risk sits in the language. If the Fed signals a higher-for-longer stance while markets are positioned for earlier easing, that policy-error gap can flatten the curve fast, spiking front-month futures toward backwardation around the meeting date. Consecutive down sessions in E-Mini S&P 500 futures after the decision would accelerate that flattening.
Where crude oil enters the picture
The second catalyst is energy, and it operates on a different channel. Front-month WTI crude futures were clustered in the low-$100s on 13-14 September 2026, and the original analysis flags the $100-$115 per barrel range as a potential trigger for broader market stress.
Crude is currently in backwardation itself, where near-term contracts price well above deferred ones, signalling genuine supply-tightness concern. That is the disconnect worth noting: energy markets are already pricing stress while the VIX curve is not.
Here is what that means for you. If high oil prices are seen as persistent while the Fed stays tight, markets start pricing stagflation risk, slowing growth alongside sticky inflation, and that is precisely the scenario that sends investors scrambling for short-term equity protection. The next sudden repricing could easily originate in energy before it ever shows up in the volatility curve, so watching crude gives you an early read the VIX alone will not.
Building your early warning system and filtering the noise
A signal is only useful if it is reliable, and the VIX curve is a valuable but noisy indicator. The goal is a disciplined framework, not a reflexive trigger finger.
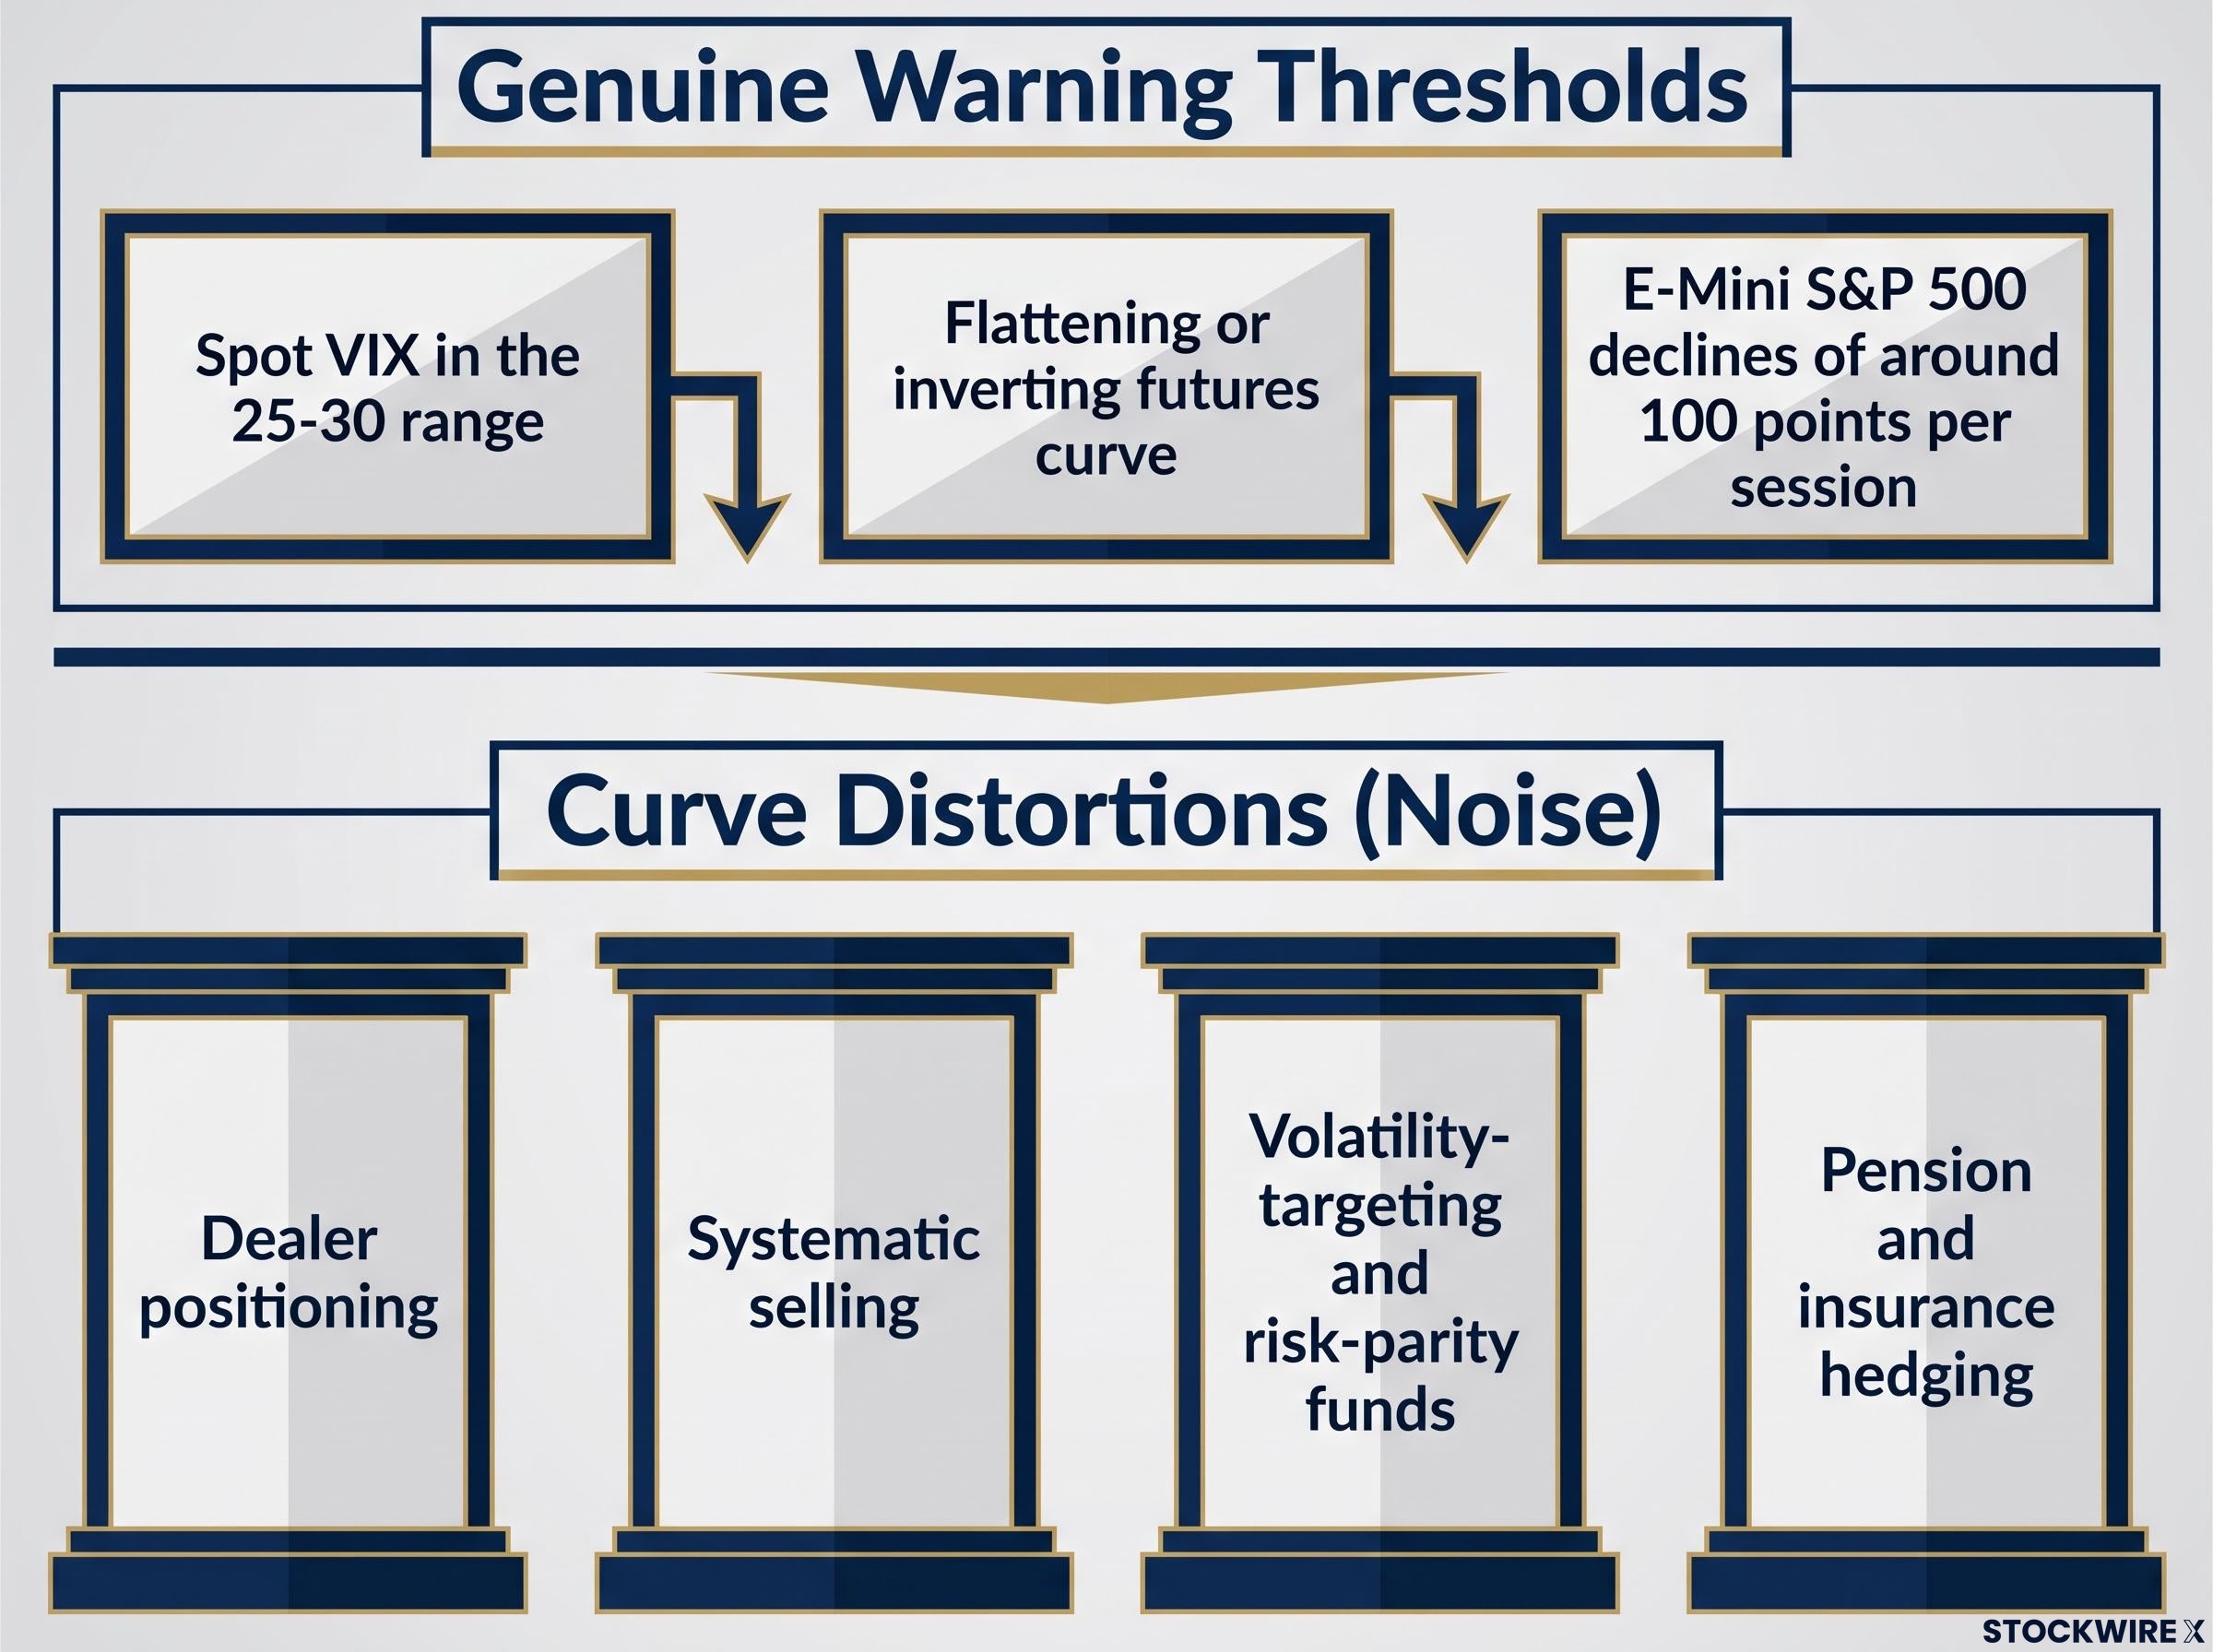
Start with a concrete threshold. A genuine warning combines a spot VIX in the 25-30 range with a flattening or inverting futures curve. On their own, neither qualifies. Together, and confirmed by sustained daily E-Mini S&P 500 declines of around 100 points per session following a Fed decision, they carry real weight.
Then guard against false positives. Around discrete political or policy dates, elections, fiscal negotiations, near-term volatility can briefly rise above longer-dated volatility as traders hedge a specific event, then normalise within days without any broader crisis. A single session of inversion is noise. Magnitude and persistence, an inversion lasting days or weeks, are what separate signal from static.
Guard equally against false negatives. Some shocks arrive too fast for the curve to warn you, such as the 2010 flash crash, where spot VIX spiked while longer-dated futures barely moved and the curve stayed in contango even as prices fell. The curve is an early-warning tool, not a guarantee.
Finally, remember the curve is distorted by flows that have nothing to do with macro fear:
- Dealer positioning, where hedging demand can push the front end up independently of fundamentals
- Systematic selling of longer-dated volatility for yield, which depresses the back end and exaggerates apparent backwardation
- Volatility-targeting and risk-parity funds that cut exposure as realised volatility rises, reinforcing front-month spikes
- Pension and insurance hedging demand for long-dated protection, which can flatten the curve without any imminent threat
Combining curve shape, magnitude, and persistence with hard price-action thresholds is what protects you from expensive whipsaws. Mastering the gap between a brief event spike and sustained backwardation is what stops you liquidating a healthy portfolio during ordinary turbulence.
Pulling the volatility framework together for the rest of 2026
The single lesson to carry forward is this: the VIX curve reflects expectations about the duration of market stress, not just the daily price of fear. Backwardation matters because it signals the market believes stress will last long enough to force changes in positioning, margins, and liquidity.
That is why the spot number alone will never give you the full picture. You have to read it alongside the contango or backwardation spread to gauge where institutional risk appetite actually sits.
For the rest of 2026, the setup to monitor is the intersection of Fed policy and energy prices. A stable Fed path with easing crude keeps the curve in contango and the early-warning value low. A persistent gap between Fed guidance and market pricing, combined with sustained high oil, is the environment where the curve becomes your most informative signal. Watch that intersection dynamically as conditions shift.
This article is for informational purposes only and should not be considered financial advice. Investors should conduct their own research and consult with financial professionals before making investment decisions. Past performance does not guarantee future results, and these observations are subject to change based on market developments.