Both indicators promise the same thing: a clean signal telling you when a trend is starting. In practice, they let you down in opposite ways. The moving average crossover waits so long to confirm a move that you arrive after most of the gain is gone. The Parabolic SAR flips you in and out so fast during choppy stretches that the trades cancel each other out and you are left worse off than if you had done nothing.
The comparison of Parabolic SAR vs MA crossover is usually framed as a preference, one indicator against the other. That framing is wrong. Each tool is built on a completely different mechanical logic: one is a smoothed average of old prices, the other is a dynamic trailing stop that accelerates as a trend matures. That difference in construction is exactly why they break down in different market conditions. Choosing between them without understanding the mechanics is like grabbing a tool without knowing what job it was designed for.
Trend confirmation frameworks predate the SAR and the EMA crossover by decades: Dow Theory’s dual-index confirmation requirement and three-phase trend cycle solve the same regime-identification problem the ADX filter addresses, and comparing how each approach defines a valid trend exposes the shared structural logic underneath tools built a century apart.
After this, you will know how each indicator actually calculates its signal, where each one consistently breaks down with real price examples, and what the backtesting research says about combining them rather than picking a side.
The mechanical difference that determines everything
To understand why these two indicators behave so differently, start with how each one is built. The lag in a moving average is not a flaw someone forgot to fix. It is the direct mathematical result of averaging data that has already happened. The Parabolic SAR’s acceleration factor exists specifically to attack that problem from a different angle.
Here is the core contrast:
- Moving averages (SMA and EMA): measure the average price over a set number of past periods, lag price by design, and produce a signal when two average lines cross each other.
- Parabolic SAR: measures where a trailing stop should sit based on trend direction and duration, accelerates its pursuit of price as the trend extends, and produces a signal as a single dot that flips from one side of price to the other.
How moving averages calculate lag
A Simple Moving Average (SMA) is the arithmetic mean of an asset’s closing prices over a chosen number of periods. Average the last 20 daily closes and you get a 20-period SMA.
The consequence is baked into the arithmetic. An N-period SMA lags price by roughly N/2 periods, so a 200-period SMA sits about 100 bars behind the current turning point. That is not a settings problem you can dial out.
An Exponential Moving Average (EMA) assigns more weight to recent prices, which makes it react faster than the SMA. It reduces the lag but never removes it, because it is still built entirely from prices that have already printed.
How the SAR builds acceleration into the signal
The Parabolic SAR, developed by J. Welles Wilder (who also created the ADX indicator, a detail that matters later), works from three parts: the SAR value itself, the extreme point (the highest high in an uptrend or lowest low in a downtrend), and the acceleration factor (AF). Across TradingView, MetaTrader 5, and TradeStation, the defaults are a starting AF of 0.02, a step of 0.02, and a maximum cap of 0.20.
TradingView’s Parabolic SAR documentation confirms the platform’s default settings of a 0.02 starting acceleration factor, a 0.02 step increment, and a 0.20 maximum cap, the same values that form the baseline for the parameter comparisons and regime-specific adjustments covered here.
Walk through the arithmetic in two steps:
- In an uptrend with a SAR of 100, an extreme point of 120, and an AF of 0.02, the updated SAR works out to roughly 100.40.
- If price sets a new high and the extreme point moves to 125, the AF doubles to 0.04, and the recalculated SAR jumps to about 101.38.
Each new high tightens the stop faster than the last. That dot flipping from below price to above it is not a passive observation of the trend. It is an explicit stop-and-reverse instruction, telling you to close and flip your position.
This tells you something practical: the SAR is not simply a faster moving average. It is a categorically different instrument that builds urgency into its signal as a trend matures, which is why it thrives in strong trends and self-destructs in ranges.
When big ASX news breaks, our subscribers know first
Where each indicator consistently fails, with real numbers
The weaknesses here are not theoretical. They show up as measurable missed price, and the gaps are wide enough to see with the naked eye.
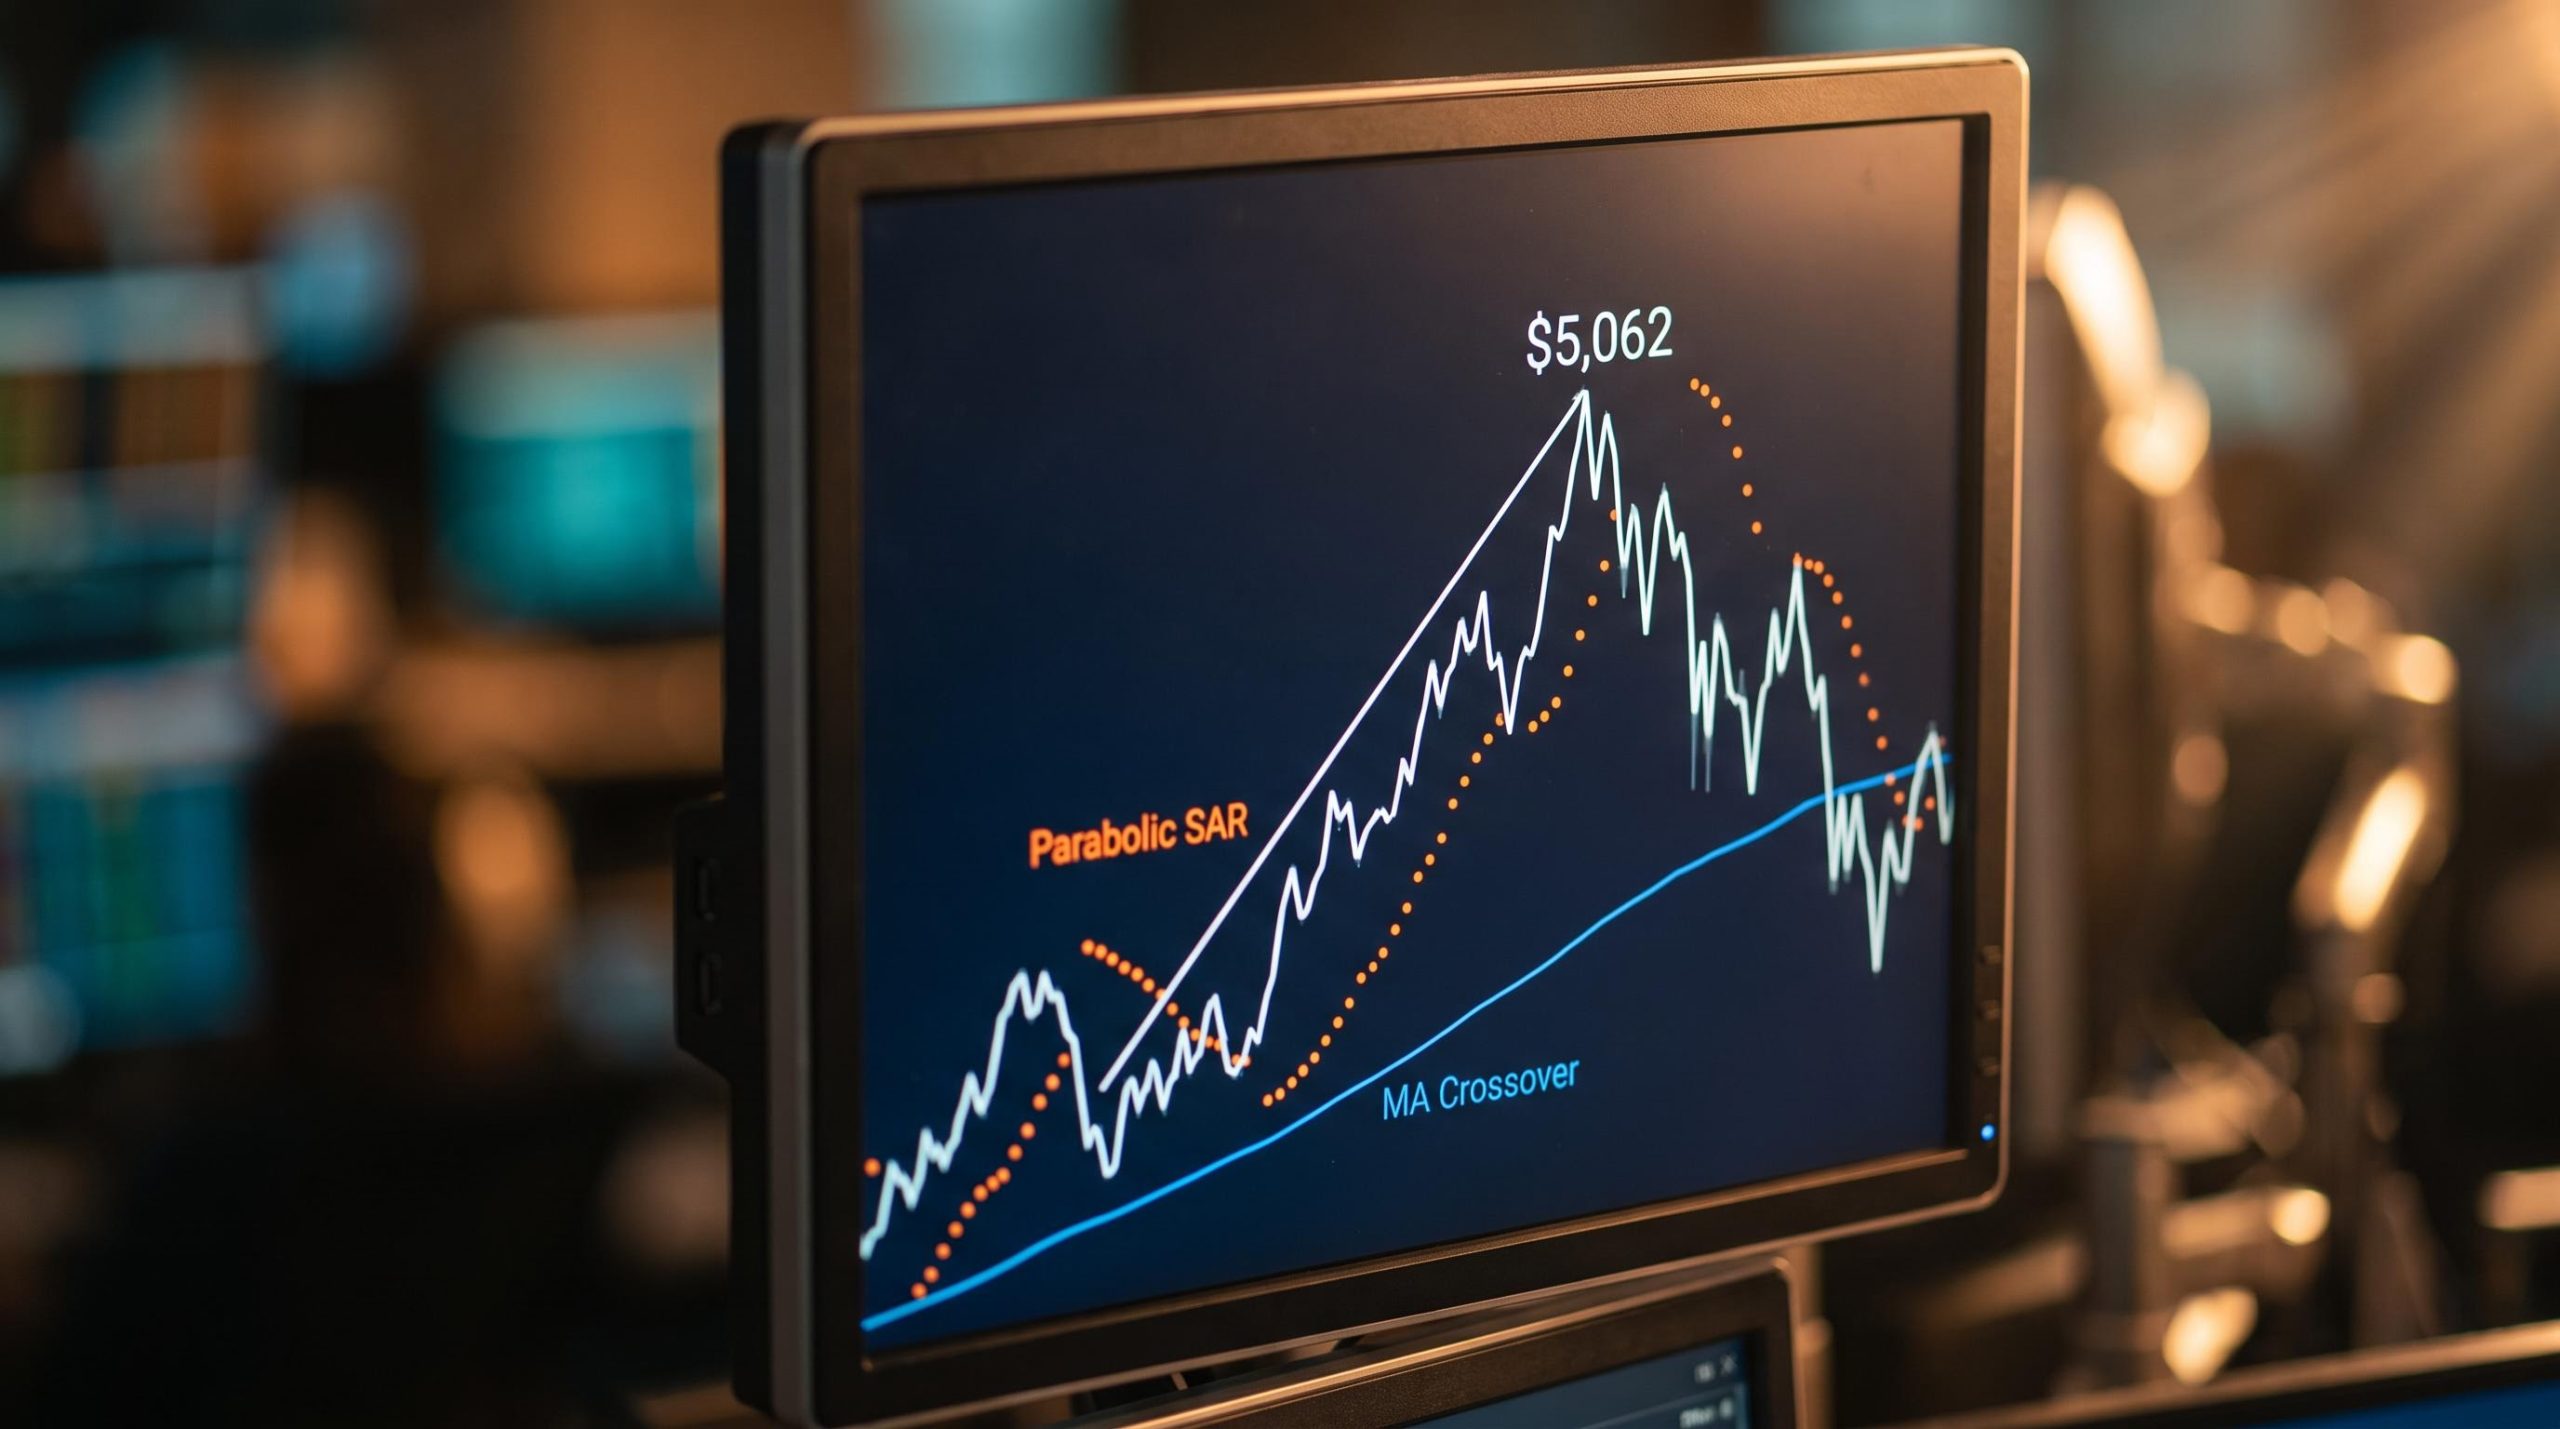
Start with the crossover’s lag. In spot gold, price peaked at $5,062, but the crossover sell signal did not appear until price had already fallen to $4,088. In EUR/USD, the pair bottomed at 1.0178, yet the golden cross buy signal held off until the rate had climbed to 1.1396. In both cases the signal confirmed the move only after the majority of it was over.
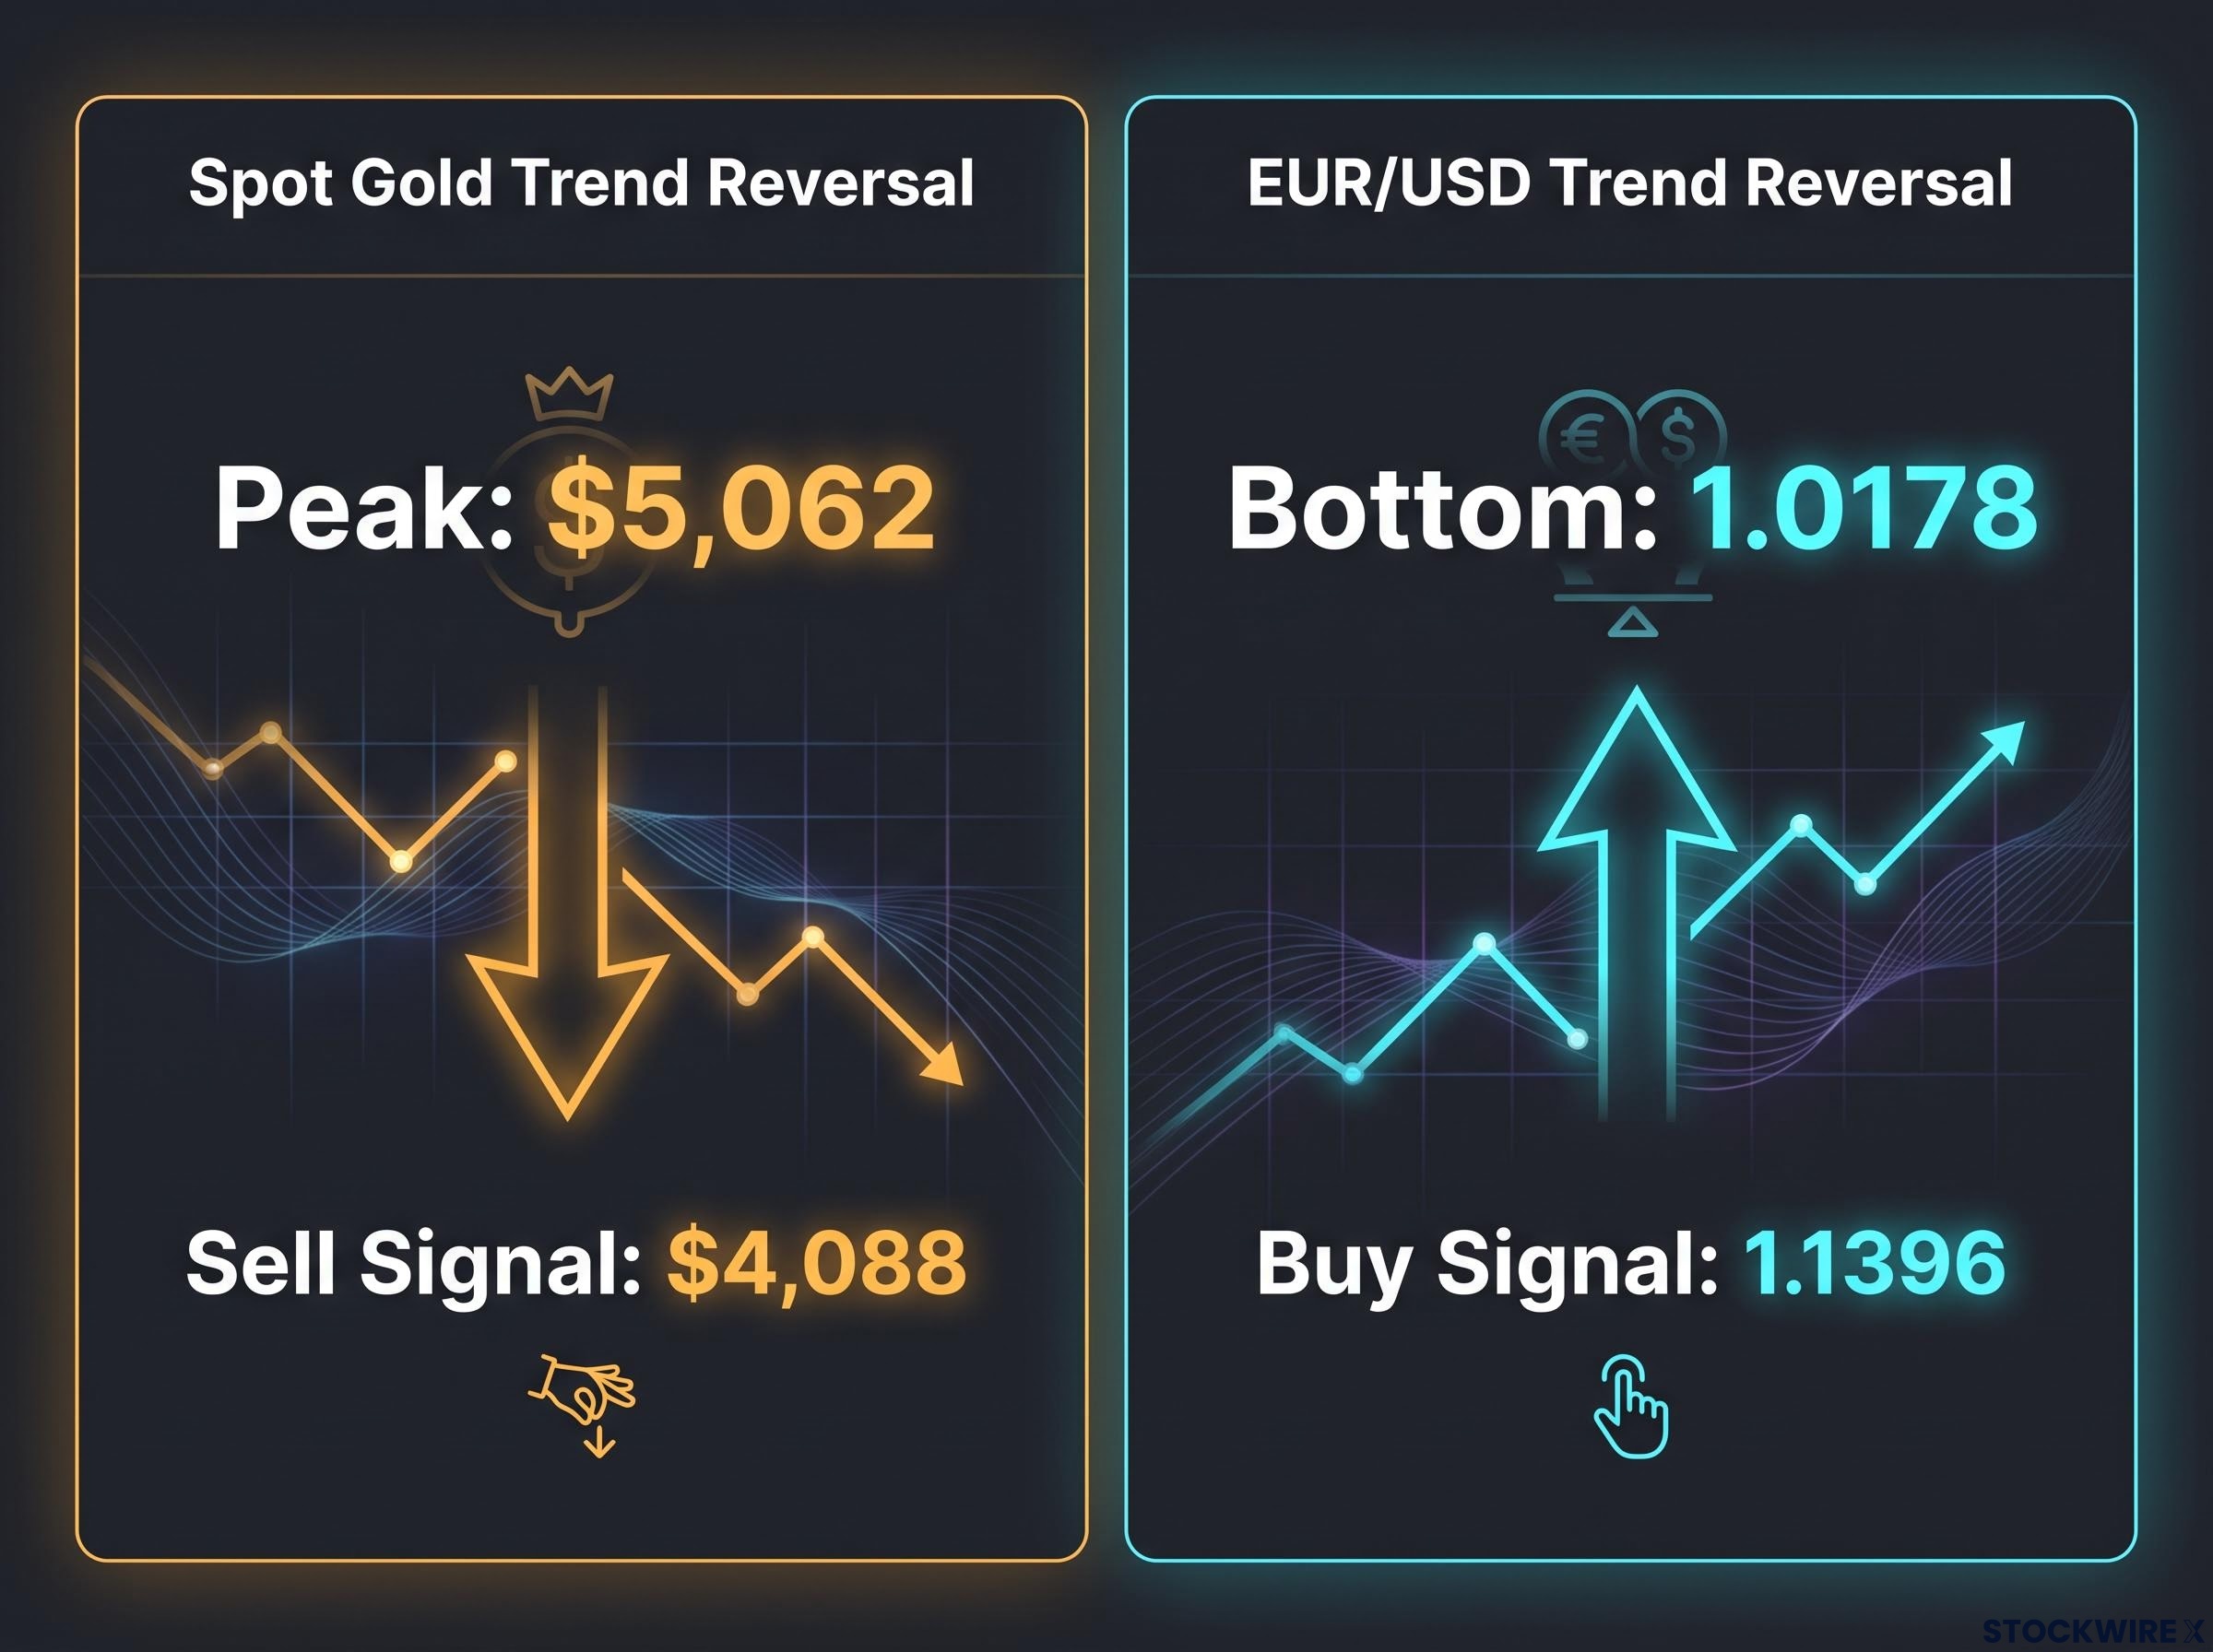
The lag cost, made visible Gold topped at $5,062. The crossover did not flash a sell until $4,088. That is nearly a thousand points of decline the signal simply did not see coming.
The SAR fails from the opposite direction. Its always-in-the-market design has no mechanism to detect a range, so in choppy conditions price repeatedly crosses the dots, each false flip resetting the acceleration factor and stacking up small losses. In a choppy WTI crude oil setup, the SAR trailing stop was clipped early at $88.54, capturing just $1.60, while the slower crossover stayed in the trade and captured $2.54. When the Nifty 50 consolidated in October 2024, a mechanical 9/21 EMA crossover triggered sequential whipsaw losses of -130, -100, and -140 index points on the 21st, 24th, and 28th.
| Indicator | Market | Condition | Cost |
|---|---|---|---|
| MA crossover | Spot gold | Trend reversal | Sell signal at $4,088 vs $5,062 peak |
| MA crossover | EUR/USD | Trend reversal | Buy signal at 1.1396 vs 1.0178 bottom |
| Parabolic SAR | WTI crude oil | Choppy | Captured $1.60 vs crossover’s $2.54 |
| MA crossover | SPY (2010-2025) | Full cycle | 184% return vs 382% buy-and-hold |
That last row is worth pausing on. A 50/200 SMA crossover on SPY from 2010 to 2025 returned 184% against buy-and-hold’s 382%, but it also cut the maximum drawdown to -19.8% versus -33.9%. The lag costs you upside; it buys you downside protection.
The crossover’s lag is not random, either. It is directional: the further a trend runs before the cross triggers, the wider the gap between your entry and your stop, which directly enlarges the risk you carry on the position. Either indicator used in the wrong market regime charges you a structural tax on every trade.
What the backtests actually show across market regimes
Read the research studies together and they look like conflicting jury verdicts. The resolution is not which indicator wins. It is that each was tested in a different market regime, and the regime, not the indicator, drove the result.
Take the SAR on its own. A 2025 Udayana University study found the SAR managed just 30.56% accuracy and a total loss under its tested ruleset. The INTECOM Journal, testing on different equities with a different ruleset, recorded a 76.84% win rate, a 6.08 profit/loss ratio, and a 7.46% CAGR. Same indicator, opposite conclusions.
The crossover splits the same way between index-level and single-stock results:
| Study | Indicator | Market | Key result |
|---|---|---|---|
| Udayana University (2025) | Parabolic SAR | Local equities | 30.56% accuracy, total loss |
| INTECOM Journal | Parabolic SAR | Local equities | 76.84% win rate, 6.08 P/L ratio |
| Global indices (2024) | Golden cross | 127 index events | 67.7% led to sustained upside |
| 66-year S&P 500 study | Golden cross | S&P 500 | 33 trades, 79% win rate, 15.8% avg gain |
| ICICIBANK backtest | Golden cross | Single equity | -2.2% return, 11.1% win rate |
The golden cross led to sustained upward movement in 67.7% of 127 global index events during 2024, and a separate 66-year S&P 500 study logged 33 trades at a 79% win rate with an average gain of 15.8%. Yet applied naively to the single NSE stock ICICIBANK, the same golden cross strategy produced a -2.2% total return and an 11.1% win rate. Index-level and single-stock results diverge sharply.
The SPY backtest data cited here sits within a broader pattern: golden cross signals across 127 global index events in 2024 led to sustained upward movement in 67.7% of cases, yet the same crossover applied naively to a single equity like ICICIBANK returned -2.2%, a divergence that traces directly back to regime mismatch rather than indicator failure.
Parameter selection matters just as much as the market. A USD/JPY 36-test matrix showed how far outcomes can swing on the SAR alone:
- Default 0.02/0.20 on four-hour bars earned +637.7 pips in 2025 but lost -108.2 pips in 2024.
- Adjusting to 0.03/0.10 on hourly bars turned both years positive.
Even the type of chart data changes the verdict. On the Dow 30, the SAR posted a 19% win rate on standard OHLC candles but 63% once the input was switched to Heikin-Ashi charts, which smooth the price data before the indicator ever runs.
The takeaway is actionable: there is no universally better indicator, and any course or article claiming one is almost certainly presenting a single regime as a general truth. Your job is to identify your own regime first, then pick the tool.
How each indicator was designed to be used
The constructive answer you came for is not to crown a winner. It is to assign each indicator the specific structural job it does best, and Wilder effectively drew the map for this when he built both the SAR and the ADX in the same body of work.
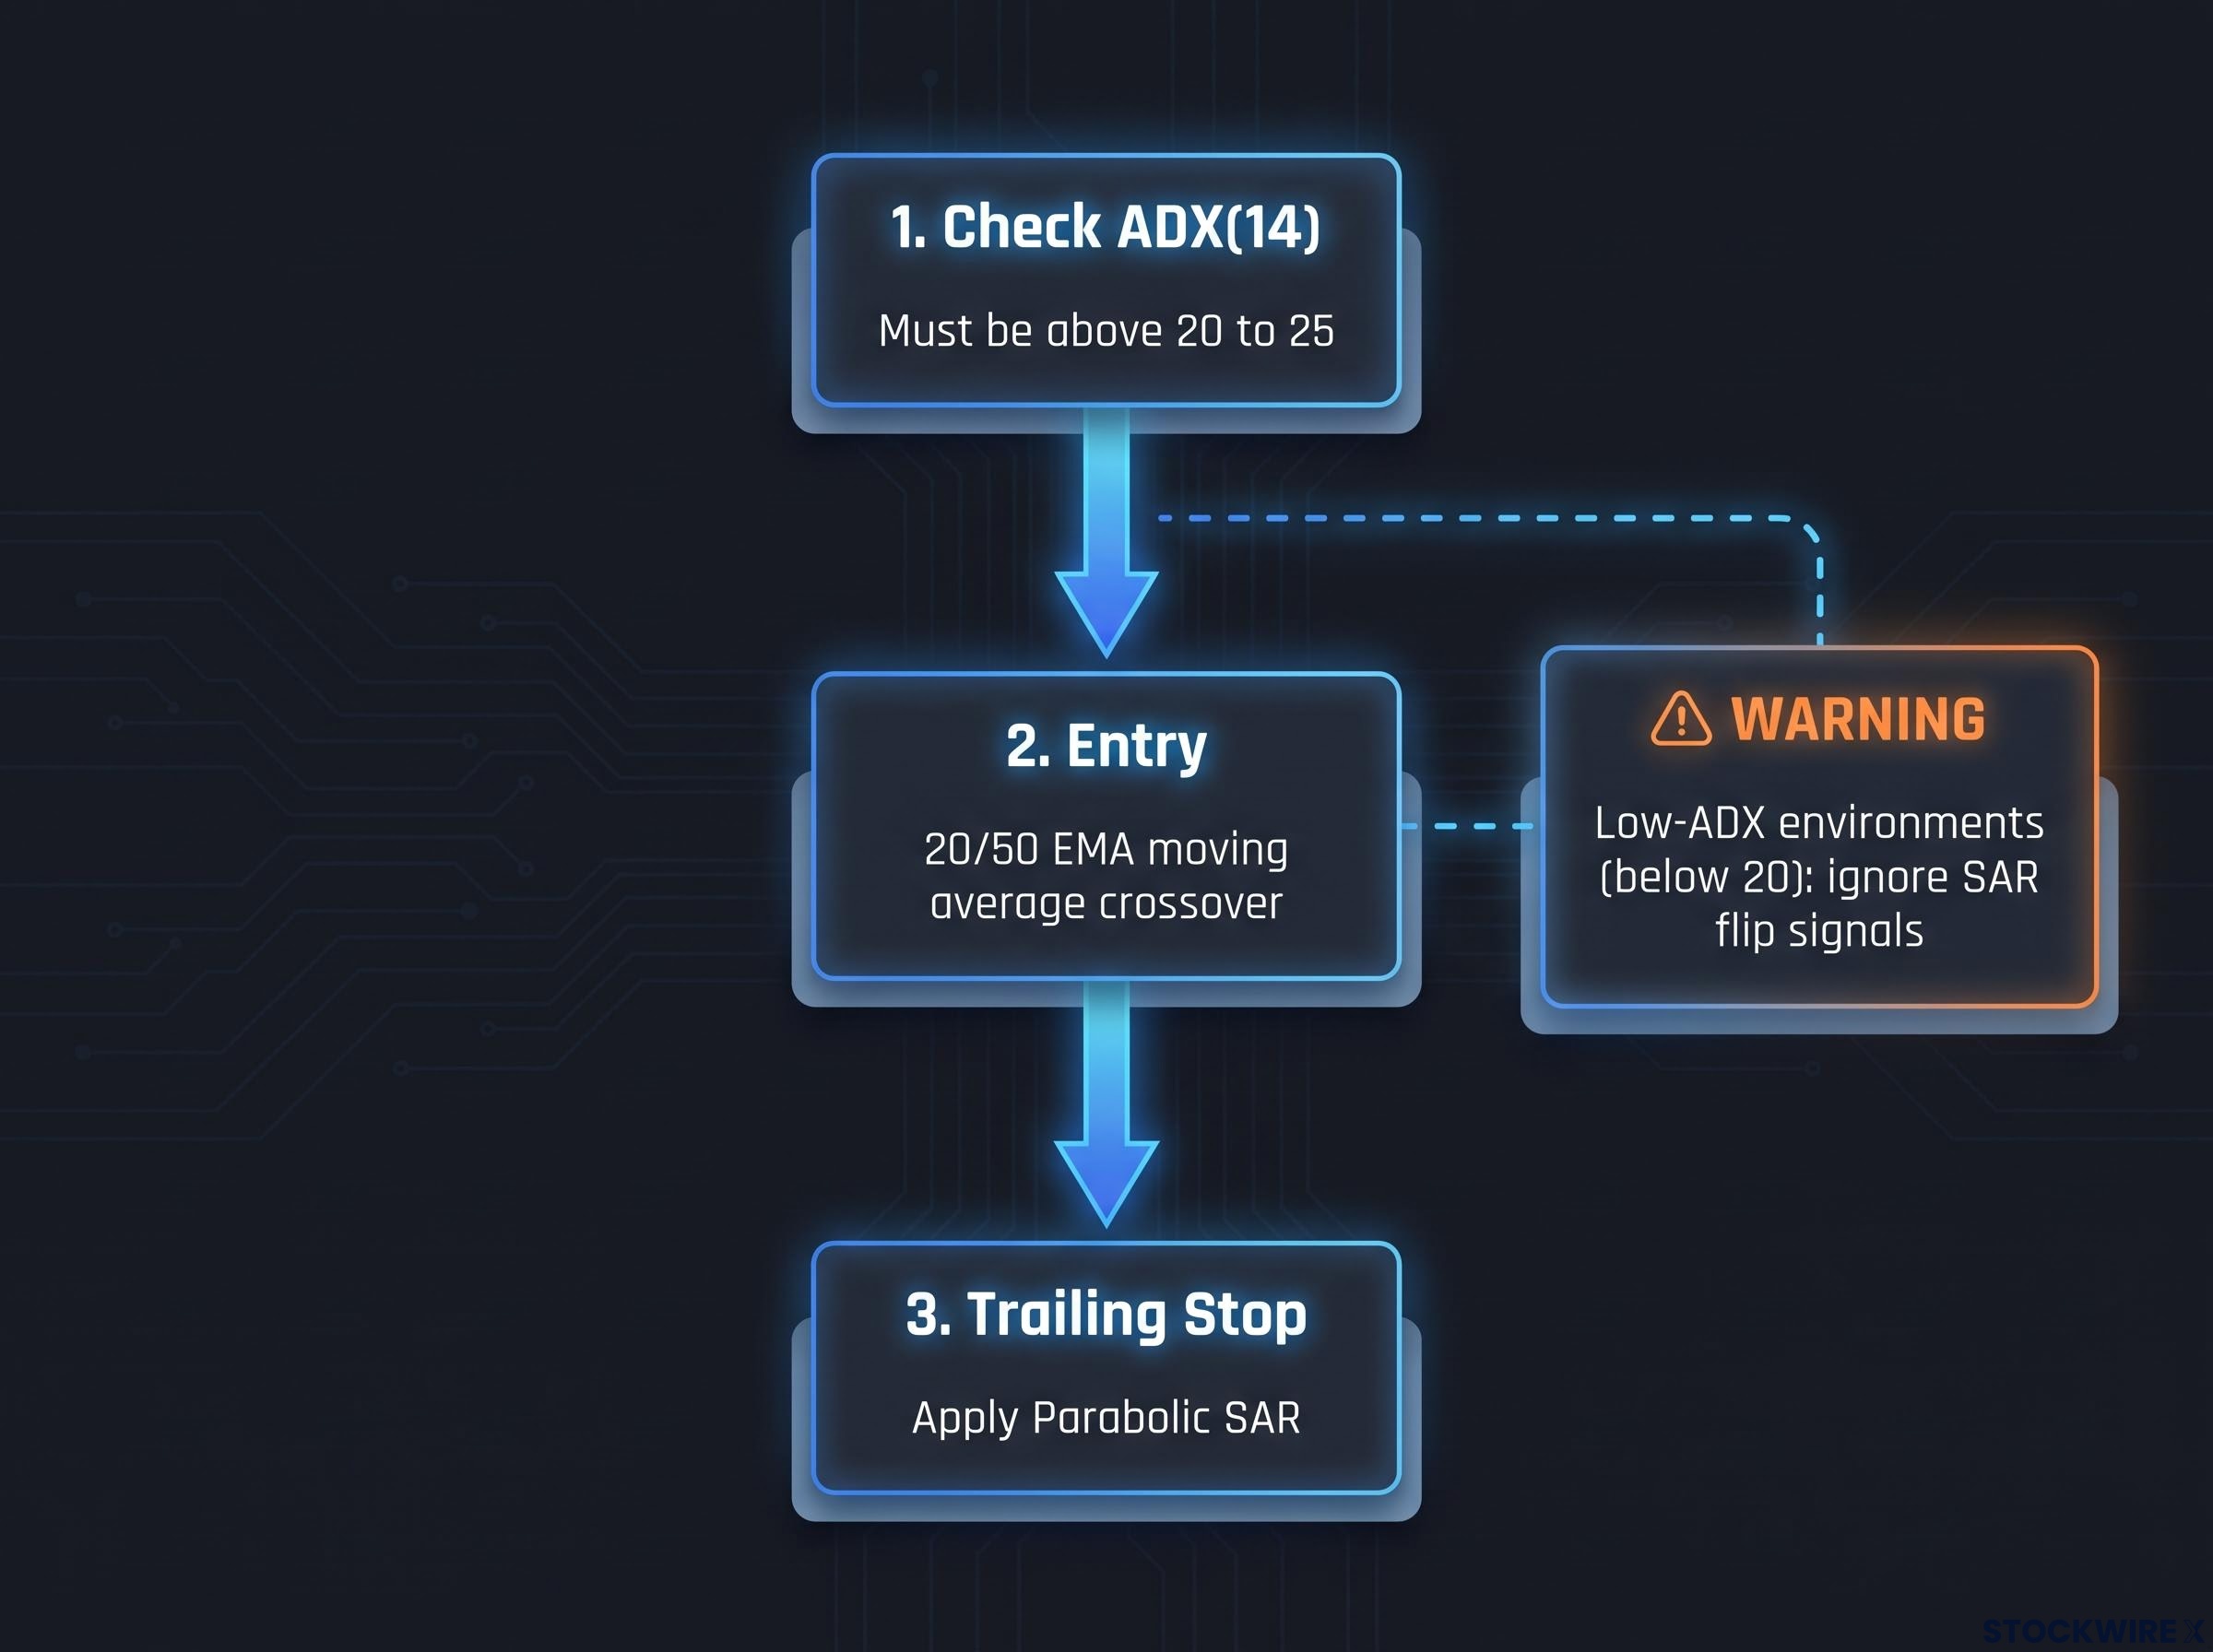
The Average Directional Index (ADX) measures how strong a trend is, regardless of direction, on a scale where higher readings mean stronger momentum. Wilder designed it to run alongside the SAR precisely because the SAR cannot see a range on its own. The standard modern rule requires ADX(14) above 20 to 25 before any SAR reversal counts as a valid signal. Below that threshold, every flip is treated as chop and ignored.
Here is the combined framework as an implementation sequence:
- Check the ADX reading to determine the market regime.
- Use a moving average crossover (such as a 20/50 EMA) to confirm trend direction and time the entry.
- Once in the trade, apply the Parabolic SAR strictly as a dynamic trailing stop.
- In low-ADX environments, ignore SAR flip signals for entry entirely.
| Indicator | Role in the system | When to ignore it |
|---|---|---|
| ADX(14) | Regime filter | Never; it gates everything |
| MA crossover | Entry and trend direction | When averages are flat and intertwined |
| Parabolic SAR | Dynamic trailing stop | For entry when ADX is below 20 |
For the crossover, apply a slope and separation filter: flat, tangled averages are an indecision zone where you act on nothing, and only a steep slope with visible space between the lines counts as a valid entry. When each tool plays its role in a genuine trend, the SAR’s early entry pays off.
Moving average slope filters, specifically requiring a steep angle and visible separation between the lines before acting on a crossover, directly address the flat-and-intertwined failure mode that costs traders the most in range-bound conditions, and pairing them with a tiered position sizing framework converts the entry signal into a structured risk management sequence.
When the SAR earns its keep In a USD/CAD trend, the SAR captured roughly 132 pips against the crossover’s 60. In a USD/CHF example, SAR shorted near 0.8149 versus the crossover’s 0.8128, taking about 62 pips against 49, a near 20% advantage.
There is a second-order cost worth naming. The SAR’s flip noise in choppy markets does not just lose small amounts of money; the string of tiny losses wears traders down until they abandon the system right before a real trend arrives. Some MetaTrader implementations counter this by requiring consecutive SAR dots on one side before confirming a reversal, a built-in noise filter.
Assigning each indicator its role before the next trade
So which one gets you in earlier? The honest answer depends on the regime. In strong, high-ADX trends, the Parabolic SAR consistently enters sooner and captures more of the move, as the USD/CHF and USD/CAD pip counts show. In choppy, low-ADX conditions, the crossover’s lag becomes an accidental virtue, keeping you out of the false reversals the SAR would have dragged you into.
Turn that into a two-question check before you place a trade:
- Is the ADX above 25 (trending) or below 20 (ranging)?
- Is the crossover pointing the same direction as the SAR dots?
Agreement between the two is the filter condition the research supports. Disagreement is your signal to wait.
Your SAR settings are not fixed either. Match them to the environment:
- Strong trends: run the default 0.02 start, 0.02 step, 0.20 maximum cap.
- Choppy conditions: reduce sensitivity to a 0.01 start, 0.01 step, and a 0.10 to 0.15 maximum cap to cut the flip noise.
Checking the regime first does more than protect your capital. It protects your decision-making from the exhaustion that whipsaw sequences create, the quiet cost that pushes traders to quit a sound system at exactly the wrong moment. Treat these two indicators as complementary instruments with separate jobs rather than rivals, and the comparison resolves itself every time you sit down to trade.
For traders who want to convert the two-question regime check into a pre-trade routine they will actually follow under pressure, our full explainer on professional trading playbooks covers the journaling structure, annotated screenshot archive, and process-grading system that daily journalers use to reach 38% profitability against 19% for those who skip the review step.
This article is for informational purposes only and should not be considered financial advice. Investors should conduct their own research and consult with financial professionals before making investment decisions. Past performance does not guarantee future results. Financial projections are subject to market conditions and various risk factors.