The New Zealand Dollar dropped roughly 1% against the US Dollar in the hours after the Reserve Bank of New Zealand’s September meeting, slipping to around US$0.5829 as traders digested a rate hike that came wrapped in unexpectedly cautious guidance.
That single move captured a broader collision playing out across two central banks. In Washington, markets are racing to price an aggressive Federal Reserve. In Wellington, the RBNZ delivered the hike but refused to endorse the steep path traders had bet on.
Risk sentiment sits at the top of the NZD/USD driver hierarchy and can override supportive RBNZ guidance or strong Chinese data simultaneously, which is why a technically oversold chart does not automatically translate into a durable recovery when capital is rotating toward safe-haven assets.
The result is a currency pair caught between hawkish momentum on one side and a deliberately shallow trajectory on the other.
This NZD/USD forecast breaks down how that macro divergence is operating in real time. You will see where institutional rate expectations actually sit, why the swap market matters more than the headline hike, what New Zealand’s own economy allows the RBNZ to do, and the specific chart levels framing this week’s trade around the Wednesday Fed decision.
Measuring the momentum gap between Washington and Wellington
The clearest way to understand the pressure on the Kiwi is to line up the two rate paths side by side. One is accelerating. The other is crawling.
Federal Reserve pricing has moved fast. According to the CME FedWatch tool, the probability of a 25-basis-point hike at the upcoming Wednesday meeting jumped to roughly 88%, up from around 59% just one week earlier. That is a violent repricing inside a single trading week, driven by firm US inflation data and hawkish commentary from Fed officials.
Wellington moved in the opposite spirit. The RBNZ raised its Official Cash Rate by 25 basis points to 2.75% on 2 September 2026, its second consecutive increase. The hike itself matched expectations. The forward guidance did not.
The Bank’s published cash rate track points to roughly 2.81% by December 2026 and a peak near 3.15% by the end of 2027. Markets had positioned for something considerably steeper, and that disappointment did the damage.
| Central bank signal | Metric | Reading |
|---|---|---|
| US Federal Reserve | September hike probability (one week prior) | ~59% |
| US Federal Reserve | September hike probability (current) | ~88% |
| RBNZ rate track | Projected OCR, December 2026 | ~2.81% |
| RBNZ rate track | Projected peak, end-2027 | ~3.15% |
The trap here was expectation, not direction. Both banks are tightening, but only one is tightening at the pace traders had priced.
The rapidly rising odds of a US hike tell you that Dollar strength right now looks structural rather than a passing spike. That heavy upside momentum is the weight you have to set against any long Kiwi position before Wednesday, because it sets the fundamental ceiling for the pair.
When big ASX news breaks, our subscribers know first
Educational section: how swap rate gaps dictate currency flows
At the surface, currency divergence is simple. Money flows toward higher yields. When one central bank offers rising returns and another lags, capital tends to rotate out of the lower-yielding currency and into the higher-yielding one, dragging the exchange rate with it.
That surface logic is why the OCR hike alone did not save the Kiwi. The deeper story sits in the swap market, and this is where the real signal lives.
An interest rate swap is a contract where two parties exchange interest payments, effectively letting traders lock in or bet on where official rates will sit in the future. The pricing embedded in these swaps reveals what the market genuinely expects a central bank to do, not what it says it will do.
RBNZ forward guidance has consistently mattered more to the pair than the headline rate decision itself: the September hike to 2.75% still produced a sell-off toward 0.585 because the committee signalled a likely October pause, confirming that traders price the tone, not the number.
Ahead of the September decision, New Zealand swap markets had implied a policy rate of roughly 4.25% over the next two years. That is far above the RBNZ’s own published peak of around 3.15% by end-2027.
The gap between those two numbers is the entire trade. When market swaps price one path and the central bank pencils in a much shallower one, something has to give. In this case, the market capitulated toward the Bank’s view.
“Not on a preset course” Governor Breman’s insistence that the RBNZ is “not on a preset course” was read by traders as a dovish signal relative to pre-meeting pricing, effectively refusing to validate the aggressive rate path swaps had built in.
That refusal collapsed the swap gap almost immediately. Two-year swap rates fell 5 basis points on the day of the decision, and the Kiwi slid roughly 1% alongside them.
Brown Brothers Harriman analysis frames the mismatch clearly, noting the RBNZ’s estimated neutral rate range of 2.3% to 4.1%. The swaps-implied 4.25% sat right at the top of that band, a level the Bank simply would not endorse given its read on the economy.
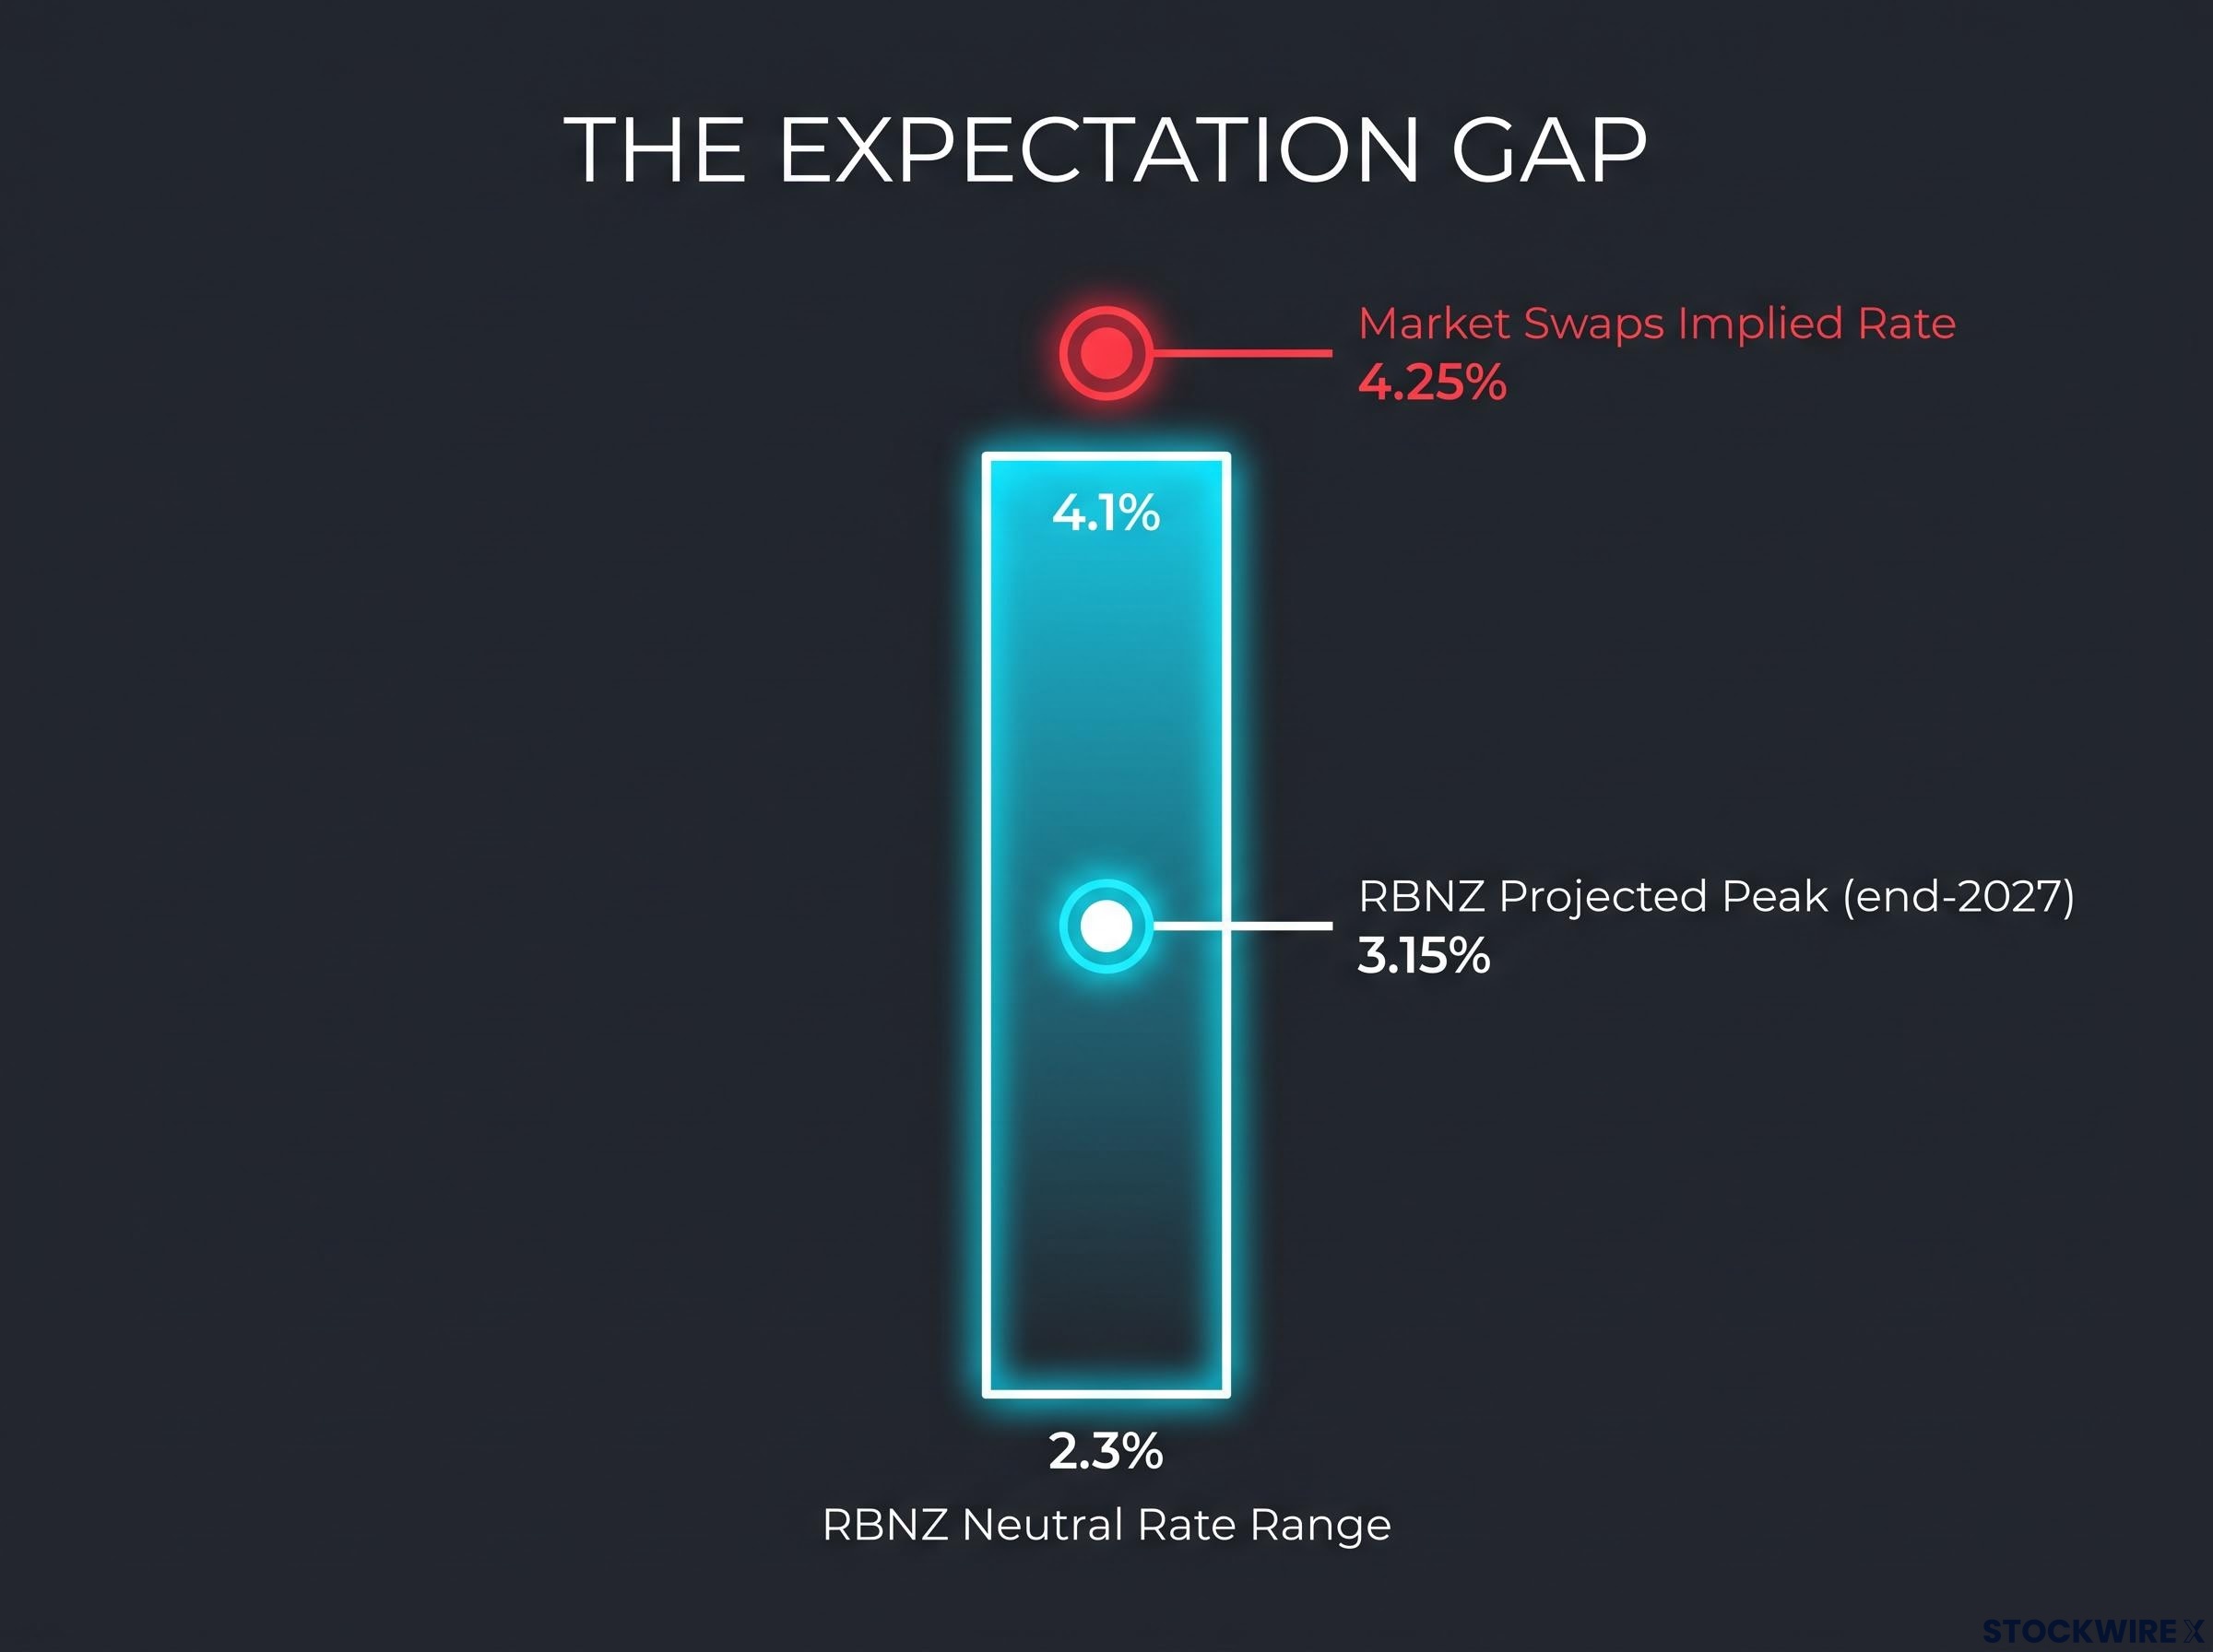
Here is what that mechanism means for you. When a central bank actively declines to validate the high rates the swap market has priced, it caps the upside for that country’s yields. That capped upside strips away the carry advantage that would normally attract capital, and it warns you the currency is vulnerable to rapid outflows. Spotting that swap gap before it closes is how you see the weakness before the broader retail crowd does.
Domestic constraints locking Wellington into a shallower path
The RBNZ is not being cautious for sport. Its shallow path is a direct reflection of an economy that cannot absorb aggressive tightening, and that fragility is the anchor holding the currency down.
Growth is stalling. Brown Brothers Harriman forecasts New Zealand’s Q2 production-based real GDP at just 0.1% quarter-on-quarter, a sharp deceleration from 0.8% in Q1 and barely above the RBNZ’s own 0.0% projection. The firm attributes the slowdown to weaker household purchasing power, squeezed by elevated fuel costs, uncertainty, and falling property values that curbed domestic spending.
Stats NZ GDP releases provide the official production-based quarterly growth figures that underpin the RBNZ’s own economic projections, and the Q2 2026 print due September 17 will either confirm or challenge the near-zero growth trajectory constraining Wellington’s tightening path.
The recovery that does exist is uneven. The BusinessNZ Performance of Services Index came in at 51.2 in August 2026, its highest reading since September 2023, yet three of its five sub-indices remain below the expansion threshold. Growth is happening in pockets, not across the board.
And inflation refuses to cooperate. Fuel-led CPI inflation is running at 4.1%, well above the RBNZ’s 1% to 3% target band, which is precisely why the Bank hiked at all.
The three headwinds boxing in Wellington are worth isolating:
- Stalling growth: Q2 GDP is forecast to nearly flatline at 0.1% quarter-on-quarter.
- An uneven services recovery: the PSI is expanding at 51.2, but most sub-indices remain soft.
- Out-of-target inflation: CPI at 4.1% sits above the ceiling of the target band.
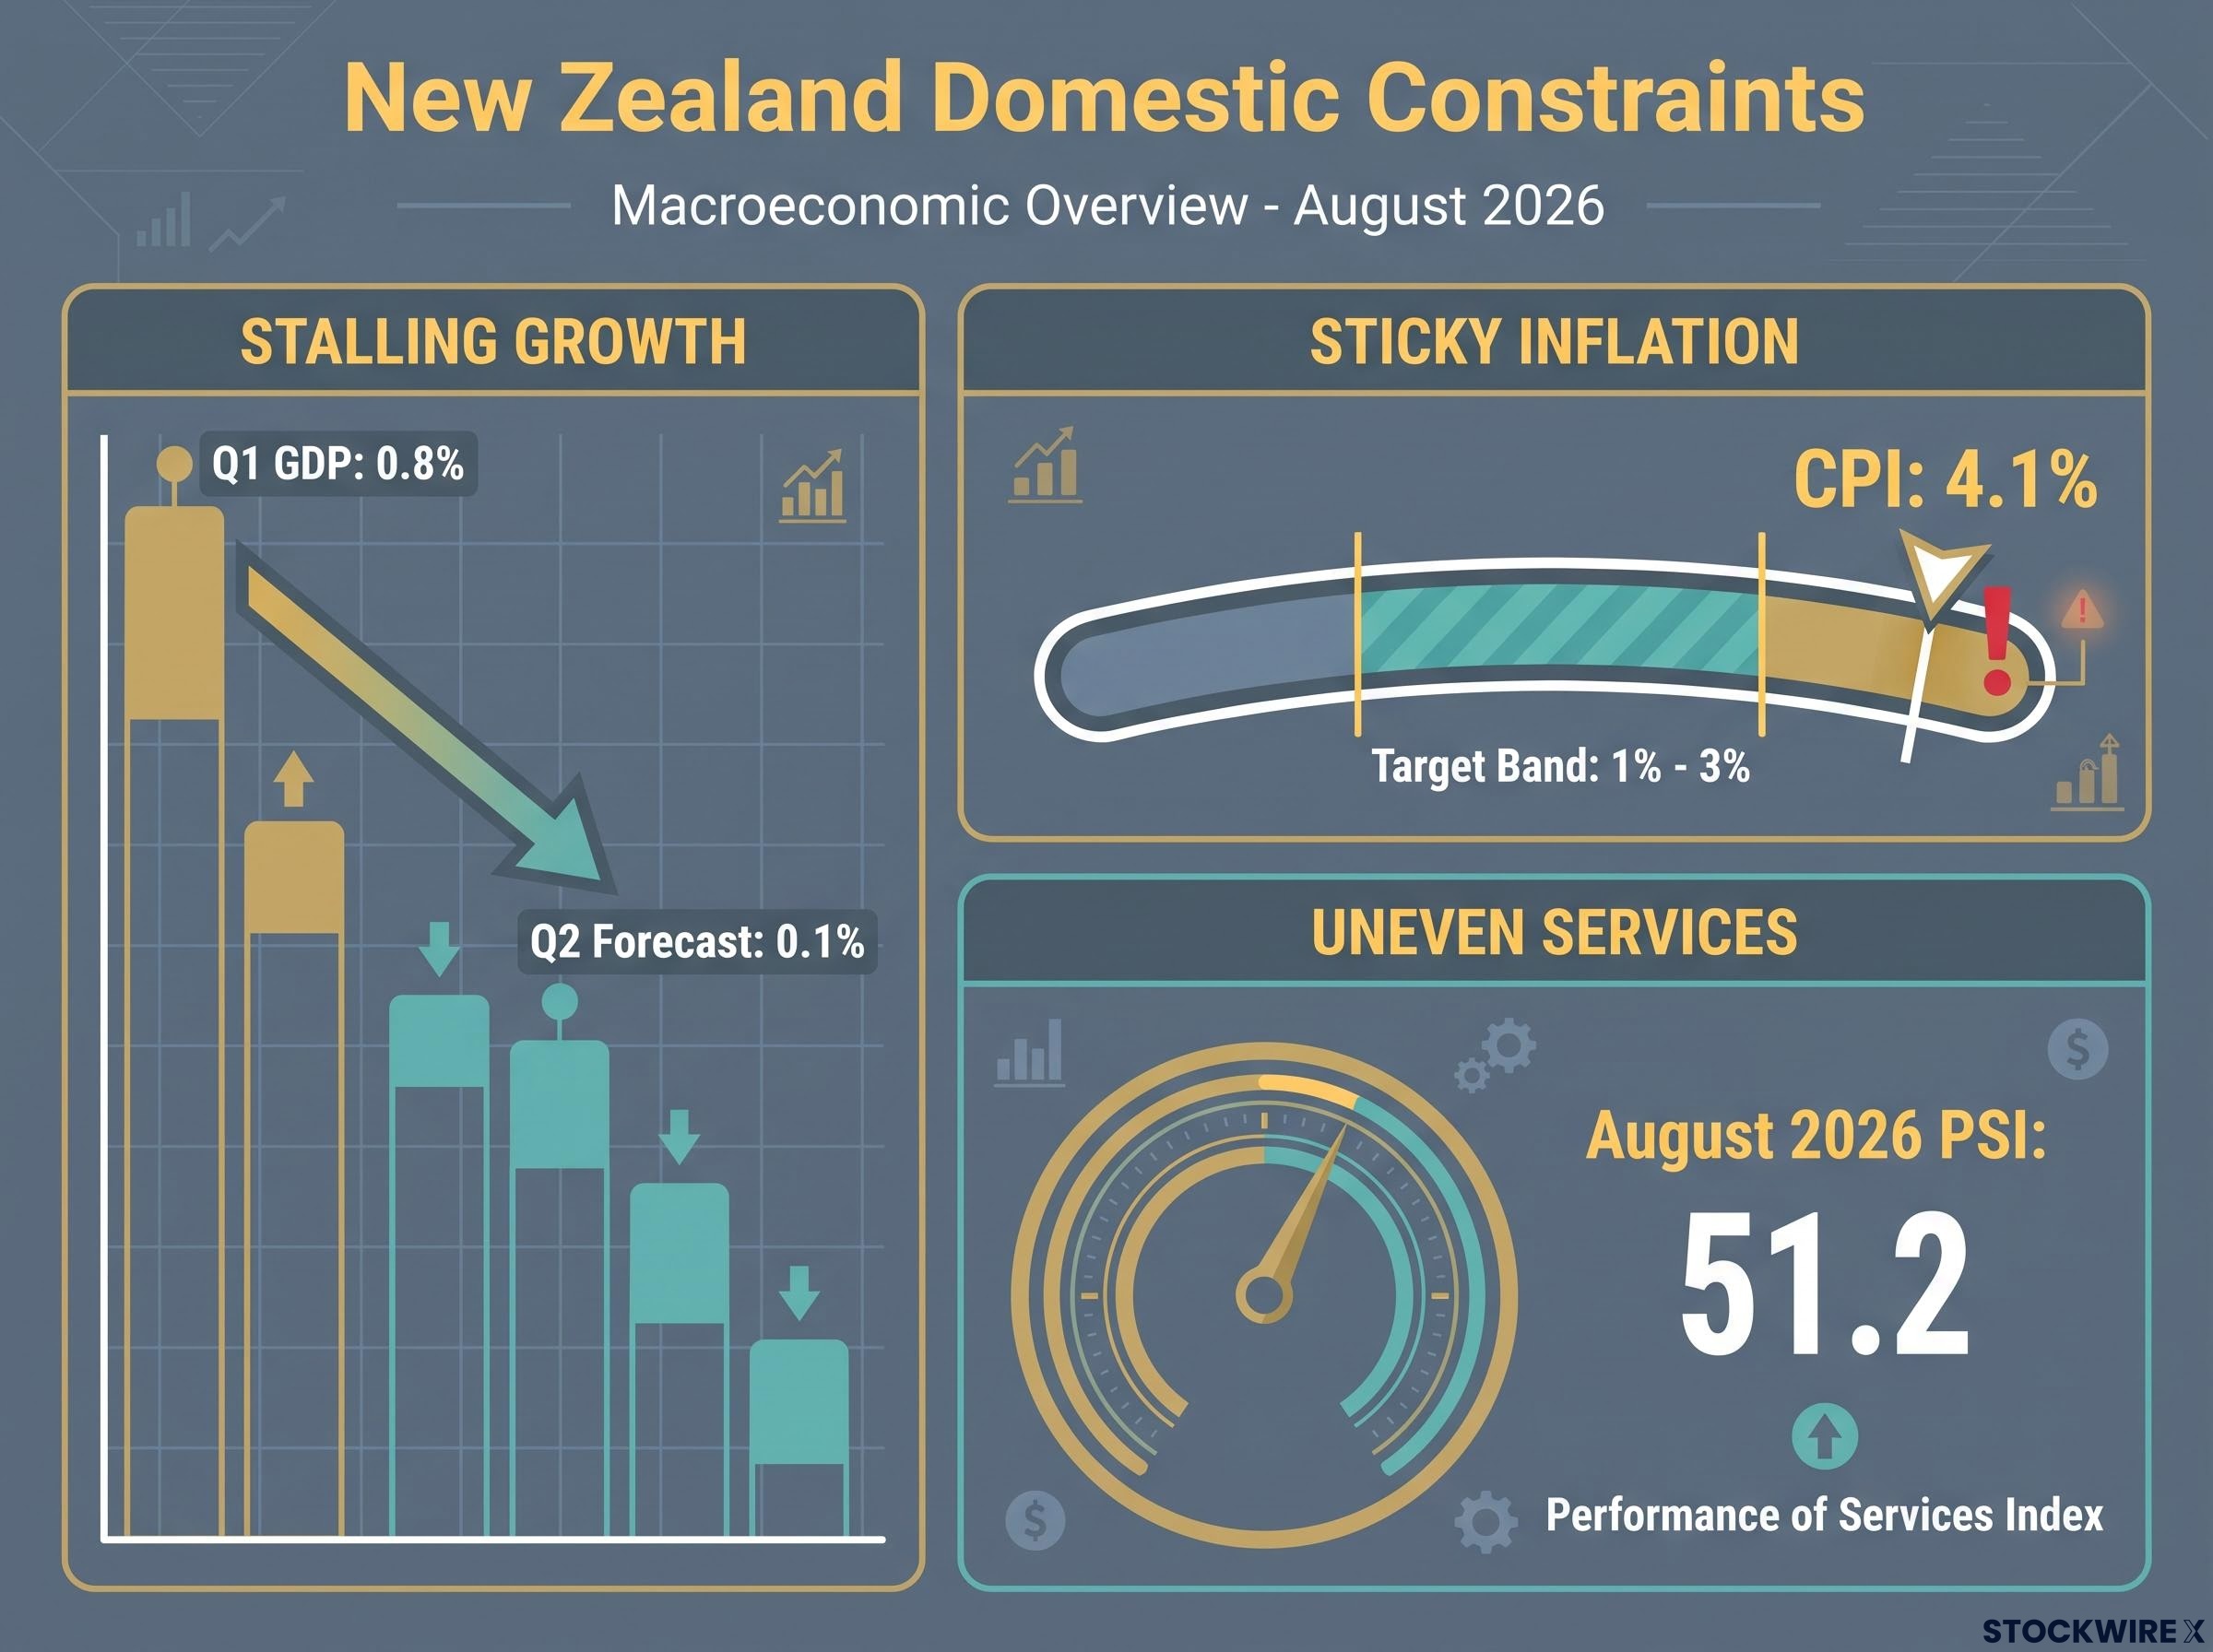
This combination is the RBNZ’s dilemma. Inflation demands tightening, but a weak economy limits how far it can go, which is exactly why the Bank believes spare capacity still lingers in the labour market and justifies its gradual pace.
For your positioning, the takeaway is uncomfortable for Kiwi bulls. Stalling growth paired with sticky inflation leaves the RBNZ heavily constrained, which drastically reduces the odds of the hawkish surprise that might rescue a struggling long trade.
Technical parameters capping the recovery window
The fundamental case points down. The chart tells you where that case runs into friction.
The bearish NZD/USD structure is reinforced by external commodity pressures: Strait of Hormuz disruption has collapsed commercial vessel transits and pushed Brent crude above $97, while China’s August crude import volumes fell 23.4% year-on-year, compressing the commodity export revenue outlook that underpins the Kiwi’s longer-term fair value.
On the one-hour chart, NZD/USD is trading beneath both the 100-period SMA at 0.5828 and the 200-period SMA at 0.5848. Together these moving averages form a supply zone, a band of overhead selling pressure that has repeatedly capped recovery attempts.
Below current price, the immediate horizontal support sits at 0.5760. That floor is the line bears need to break and hold to open the door to fresh downside discovery. Hold above it, and the structure leaves room for a corrective bounce.
Momentum, however, sends a warning to the sellers. The 14-period RSI has dropped to around 24, deep in oversold territory. That signals the bearish move is stretched, not necessarily finished, but overextended enough that chasing price lower into support carries real risk of a snapback.
For bulls attempting to invalidate the immediate bearish bias, the levels to clear stack up in sequence:
- 0.5793, the first resistance cluster.
- 0.5802, the next horizontal barrier.
- 0.5828, the 100-period SMA.
- 0.5848, the 200-period SMA and the top of the supply zone.
Here is how to read that RSI of 24. It tells you the down move is currently overextended, so patience matters more than aggression. Rather than selling blindly into support at 0.5760, the higher-quality setups sit at tests of structural resistance, where the bearish trend can reassert itself against a fresh supply of sellers.
Structuring positions around the Wednesday data catalyst
The fundamental picture and the technical picture point in the same direction, but they demand different tempos. Fed hawkishness and the RBNZ’s shallow track justify a bearish NZD/USD lean. The oversold chart demands patience about entry.
The pivot is Wednesday. The Federal Reserve decision and Chair Kevin Warsh’s press conference carry asymmetric event risk. With roughly 88% of a hike already priced, a hawkish confirmation may deliver only modest additional Dollar upside, while any hint of a pause or dovish pivot could trigger a sharp short-covering reversal in the Kiwi, amplified by that stretched RSI.
The read for the week ahead is a fundamentally justified downtrend running into a technically overstretched moment. That combination rewards discipline over conviction: respect the bearish bias, but treat resistance tests, not blind support selling, as the cleaner expression of it.
For investors wanting to position across this broader landscape, our full explainer on global central bank divergence maps how the Fed, ECB, and BOJ are each navigating distinct growth-inflation trade-offs, with cross-regional allocation implications that extend well beyond any single currency pair.
This article is for informational purposes only and should not be considered financial advice. Investors should conduct their own research and consult with financial professionals before making investment decisions.
Past performance does not guarantee future results. Financial projections are subject to market conditions and various risk factors. These statements are speculative and subject to change based on market developments and central bank policy decisions.