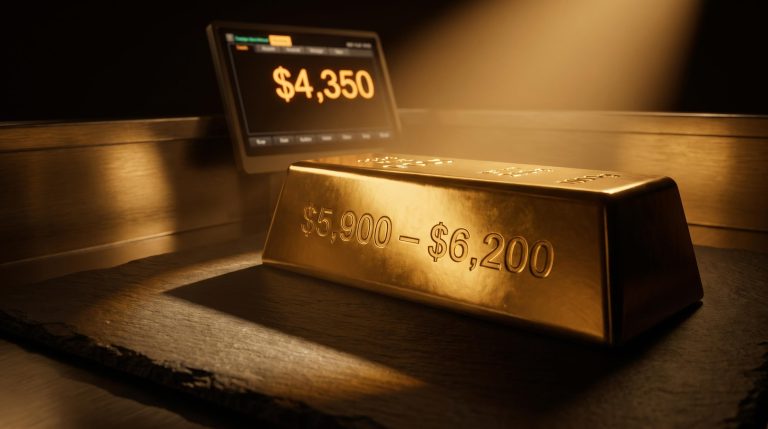
A professional fund manager, a CFA charterholder with real accountability to clients, has placed roughly a third of his fund into precious metals. Not a hedge parked at the edges of the portfolio. The single largest position he holds.
That is not how allocation decisions usually work, which is exactly why it is worth understanding. Gold sits at approximately $4,348 per troy ounce as of 12 September 2026. Central banks bought more than 1,000 tonnes a year for three straight years through 2024. Mining equities have posted some of their strongest share price gains in decades.
Those are not three separate stories. They fit together, and the fund manager’s concentration is a bet that they will keep fitting together. The breakdown below sets out the structural reasoning behind that position, so you can judge for yourself whether any part of it belongs in your own investment thinking.
The convergence thesis: why this moment is different from previous gold cycles
The concentrated position is not built on a single idea. It rests on four structural pressures arriving at the same time, each one making the others harder to ignore.
The first is fiscal deterioration across the major economies, with sovereign debt loads that governments now struggle to service on conventional terms. The second is the fragmentation of the reserve architecture built after 1945, as countries repatriate physical bullion and reassess how much they trust holding another nation’s debt. The third is structural inflation that has proven stubborn. The fourth is the quiet swap of Treasury holdings for gold inside official reserves.
Reserve de-dollarisation is no longer a theoretical trajectory: the OMFIF Global Public Investor survey released in June 2026 recorded the first instance of net dollar-reduction intent outnumbering net dollar-increase intent among sovereign institutions, a qualitative threshold that supports the thesis that geopolitical fragmentation is reshaping the reserve architecture at an institutional rather than retail level.
Take any one of these on its own and you have a reason to hold some gold. Stack them, and the argument stops being a commodity trade and becomes a question about the long-term credibility of the fiat system itself.
That framing is what separates this cycle from the last one. The 2008-2011 gold rally ran on private investor fear and monetary stimulus, but the sovereign buying component operating today was largely absent at this scale back then.
The purchase data makes the shift concrete.
| Year | Central bank net purchases | Trend note |
|---|---|---|
| 2022 | 1,082 tonnes | First year above the 1,000-tonne mark |
| 2023 | 1,037 tonnes | Streak continues |
| 2024 | 1,045 tonnes | Third consecutive year above 1,000 tonnes |
| 2025 | 863 tonnes | Down 21% on 2024, breaking the streak |
According to World Gold Council figures, that three-year run above 1,000 tonnes tells you something private sentiment never could. Sovereign institutions have been systematically repositioning their balance sheets toward bullion, which is a qualitatively different signal from retail enthusiasm or price momentum.
Gold’s share of official global reserves has more than doubled, climbing from below 10% in 2015 to over 23% on current estimates. One European Central Bank estimate places gold at 27% of total official global reserves at the end of 2025, ahead of U.S. Treasuries at 22%.
Seen through that lens, this is not a cycle you can dismiss as a bubble or a trade that has already run. The pieces only make sense as reinforcing forces, not independent ones.
When big ASX news breaks, our subscribers know first
Financial repression and structural inflation: the mechanics behind gold’s bid
So why would negative real returns on cash and bonds persist long enough to matter? The answer sits in a policy tool with a long history: financial repression.
Financial repression means governments deliberately holding interest rates below the rate of inflation. When rates sit under inflation, the real value of outstanding debt erodes over time, which lets a government shrink its debt burden without defaulting or running large surpluses.
The US Treasury’s August 2026 decision to at least double its long-end bond buyback capacity to $4 billion per operation illustrates financial repression mechanics operating in real time, using institutional tools to suppress borrowing costs below what an unfettered market would demand and generating the negative real returns that make non-yielding assets rational holds.
This is not a theory waiting to be tested. From 1945 to 1980, according to analysis cited by BlackRock and Axis Bank, financial repression contributed more than 40 percentage points to the roughly 70-point fall in U.S. debt-to-GDP. Governments have run this playbook before, and it worked.
For that mechanism to keep working, inflation has to stay sticky rather than fade. The research points to several reasons it may.
- Deglobalisation, which raises the cost of goods that cheap global supply chains once held down
- Elevated energy costs feeding through the wider price base
- The lasting effects of prior money supply expansion
- The slow-acting nature of productivity fixes such as reshoring and accelerated capital depreciation
That last point matters most for a multi-year view. Boosting productive output is the genuine cure for inflation, but reshoring factories and depreciating new capital investment take years to bite. Until they do, the repression environment stays durable rather than transitory.
Here is where the link to gold becomes mechanical rather than emotional.
Empirical work cited by the Chicago Fed shows a 1-percentage-point rise in expected long-term real interest rates is associated with a 3.4% reduction in real gold prices. Run that relationship the other way, and rates held below inflation mechanically support the gold price.
What this tells you is that gold’s bid does not depend on a crisis breaking out. It depends on a policy condition that is already in place. As long as governments keep real rates negative to manage their debt loads, the opportunity cost of holding a non-yielding asset stays structurally low, and that is a rational reason to own gold rather than a speculative one.
Physical gold versus mining equities: how the portfolio manager structured the exposure
Deciding to own gold is only half the question. The harder call is which kind, because bullion and mining shares express the same thesis with very different risk profiles.
Mining equities offer operational leverage. Because a producer’s costs are relatively fixed, a rise in the spot price flows disproportionately into per-ounce margins, which is why miners tend to move as high-beta surrogates for gold rather than direct equivalents. Institutional guides note miners typically amplify gold’s price moves by 1.5x to 3x during rallies.
That leverage cuts both ways, and recent history proves it does not always pay off.
| Asset | 2023 return | 2024 return |
|---|---|---|
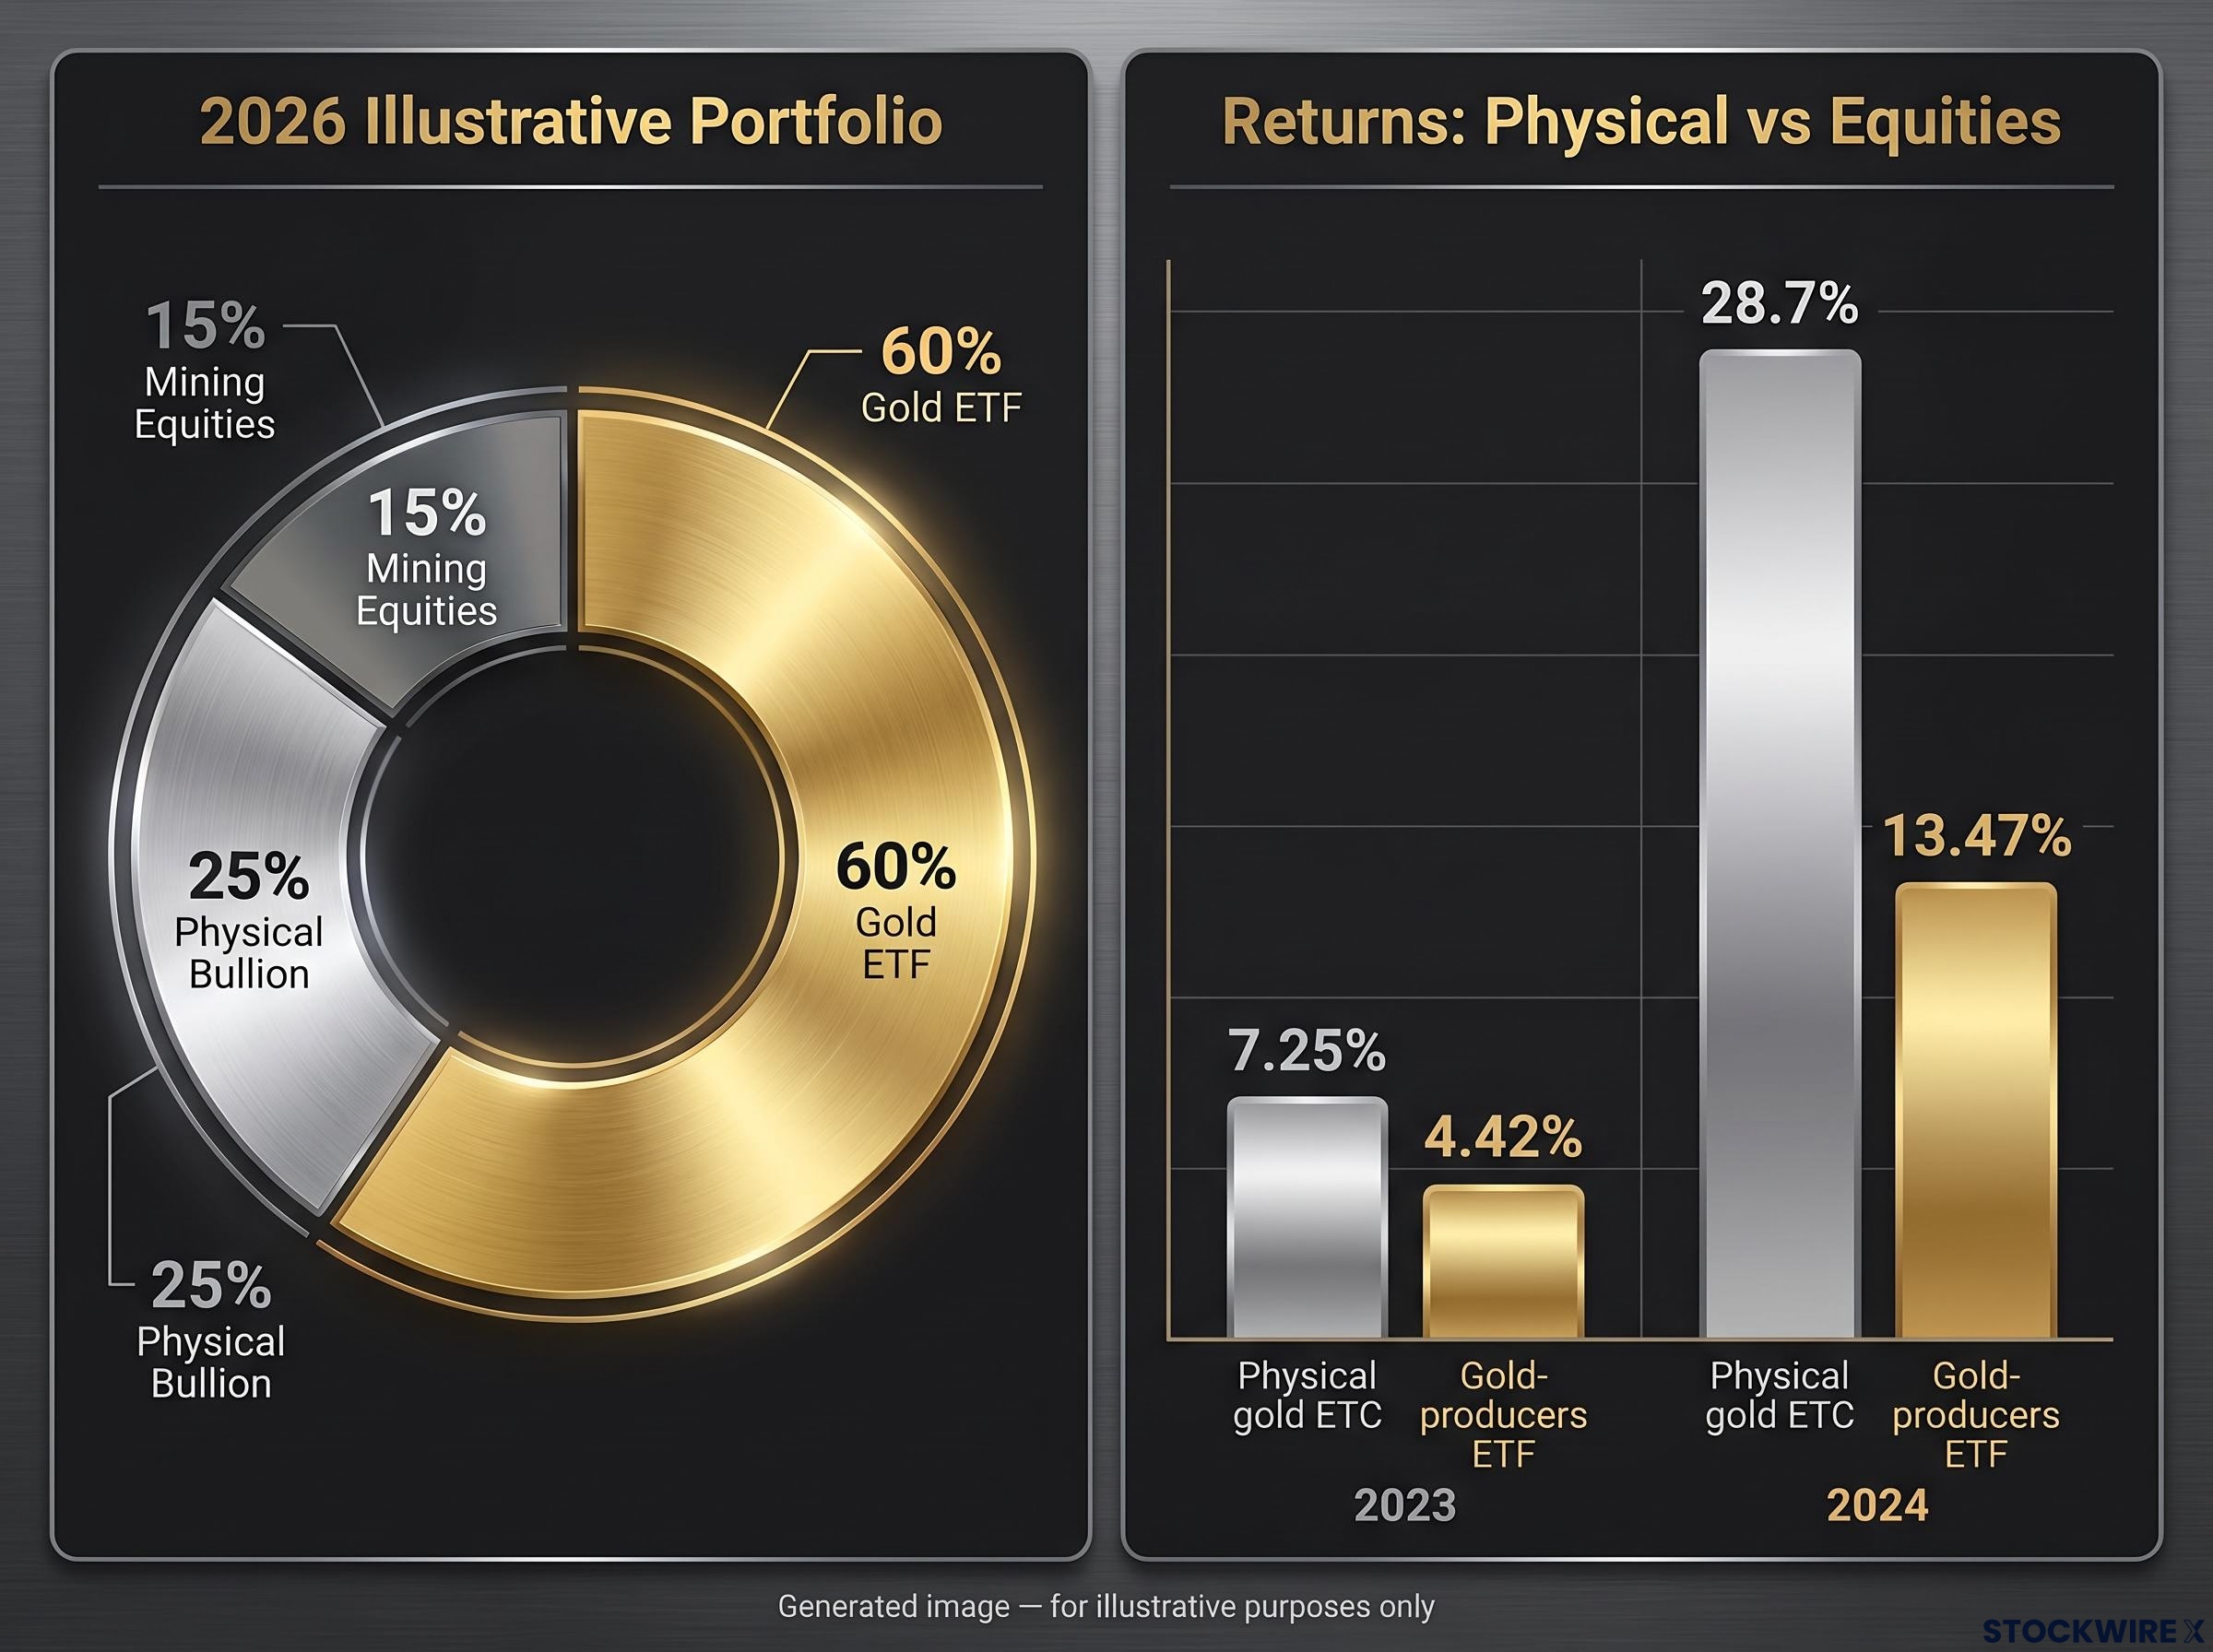
| Physical gold ETC | 7.25% | 28.7% |
| Gold-producers ETF | 4.42% | 13.47% |
According to Morningstar data, physical bullion outperformed a major gold-producers fund in both years. The leverage thesis is real, but it is not automatic, which means the split between bullion and equities is a genuine strategic decision rather than a simple choice to add more beta.
Individual names show the upside when it does arrive. Agnico Eagle Mines (NYSE: AEM) delivered a 1-year total return of roughly 30-34% as of 11 September 2026, per MarketWatch and MarketBeat data.
To hold both protection and leverage in one portfolio, model builders often use a core-satellite structure. One illustrative 2026 construction splits gold exposure this way:
- 60% gold ETF as the liquid core
- 25% physical bullion for tail-risk protection
- 15% mining equities for upside leverage
That framework lets you match your exposure to your conviction rather than treating precious metals as one undifferentiated asset.
The concentration risk counter-argument
The sceptical institutional view deserves an honest hearing, not a dismissal. State Street Global Advisors recommends strategic gold allocations of just 2-5%, a fraction of the fund manager’s one-third weighting.
The concerns are specific. Gold pays no income, carries storage and insurance costs, and can swing by up to roughly 30% in a single year. Portfolios with heavy gold weights generally show worsened Sharpe and Sortino ratios, the standard measures of return per unit of risk, outside high-inflation scenarios.
A 2026 IMF staff note adds that gold’s weak liquidity characteristics limit its viability as a primary reserve asset. None of this refutes the thesis. It is simply the risk disclosure any serious evaluation requires before sizing a position.
Where the thesis breaks and what would have to be true for it to hold
A conviction is only useful if you know what would prove it wrong. So it is worth naming the conditions under which gold underperforms.
The clearest failure scenario is a credible, sustained reduction in fiscal deficits across the major economies, paired with positive real interest rates. That combination would raise the opportunity cost of holding gold and restore confidence in fiat instruments, removing the two pillars the thesis rests on.
The institutional sceptics stop well short of the full reset narrative. UBS commentary positions the current cycle as a meaningful diversification trend rather than a replacement of the dollar system, noting the U.S. dollar still accounts for roughly 57% of global FX reserves with the euro near 15% (figures presented as institutional commentary rather than independently confirmed here).
The most authoritative counterweight comes from the central bank at the centre of the system.
A March 2026 Federal Reserve note cautions that the surge in the market value of gold reserves is largely driven by private sector demand and price-driven valuation gains, not a wholesale structural abandonment of Treasuries.
What that tells you is that even institutions acknowledging gold’s rising reserve share are not endorsing a monetary reset. So you have to decide which bet you are actually making.
- The thesis holds if deficits stay large, real rates stay negative, and geopolitical fragmentation continues. None of these require the dollar to fall.
- The full reset thesis fails if the dollar is genuinely replaced or the system changes at its foundations, a far higher bar.
That distinction matters for position sizing. A strong gold price is compatible with a reformed but intact fiat system, and the portfolio manager’s own 3-5 year horizon implies the thesis does not need a complete reset to generate returns. It only needs the structural pressures to persist for that window.
Dollar reserve-currency risk and Treasury safe-haven risk are analytically distinct, and conflating them leads to both under-hedging on bond duration volatility and over-hedging against outright dollar displacement scenarios that the data, including the dollar’s current 57% share of allocated global reserves, does not yet support.
Making a calibrated call on precious metals in a fragmented monetary world
The debate does not resolve neatly, so the useful takeaway is a framework rather than a verdict. Treat the four structural drivers, fiscal stress, geopolitical distrust, financial repression, and reserve-system fragmentation, as a checklist for whether the thesis stays intact over the next 3-5 years.
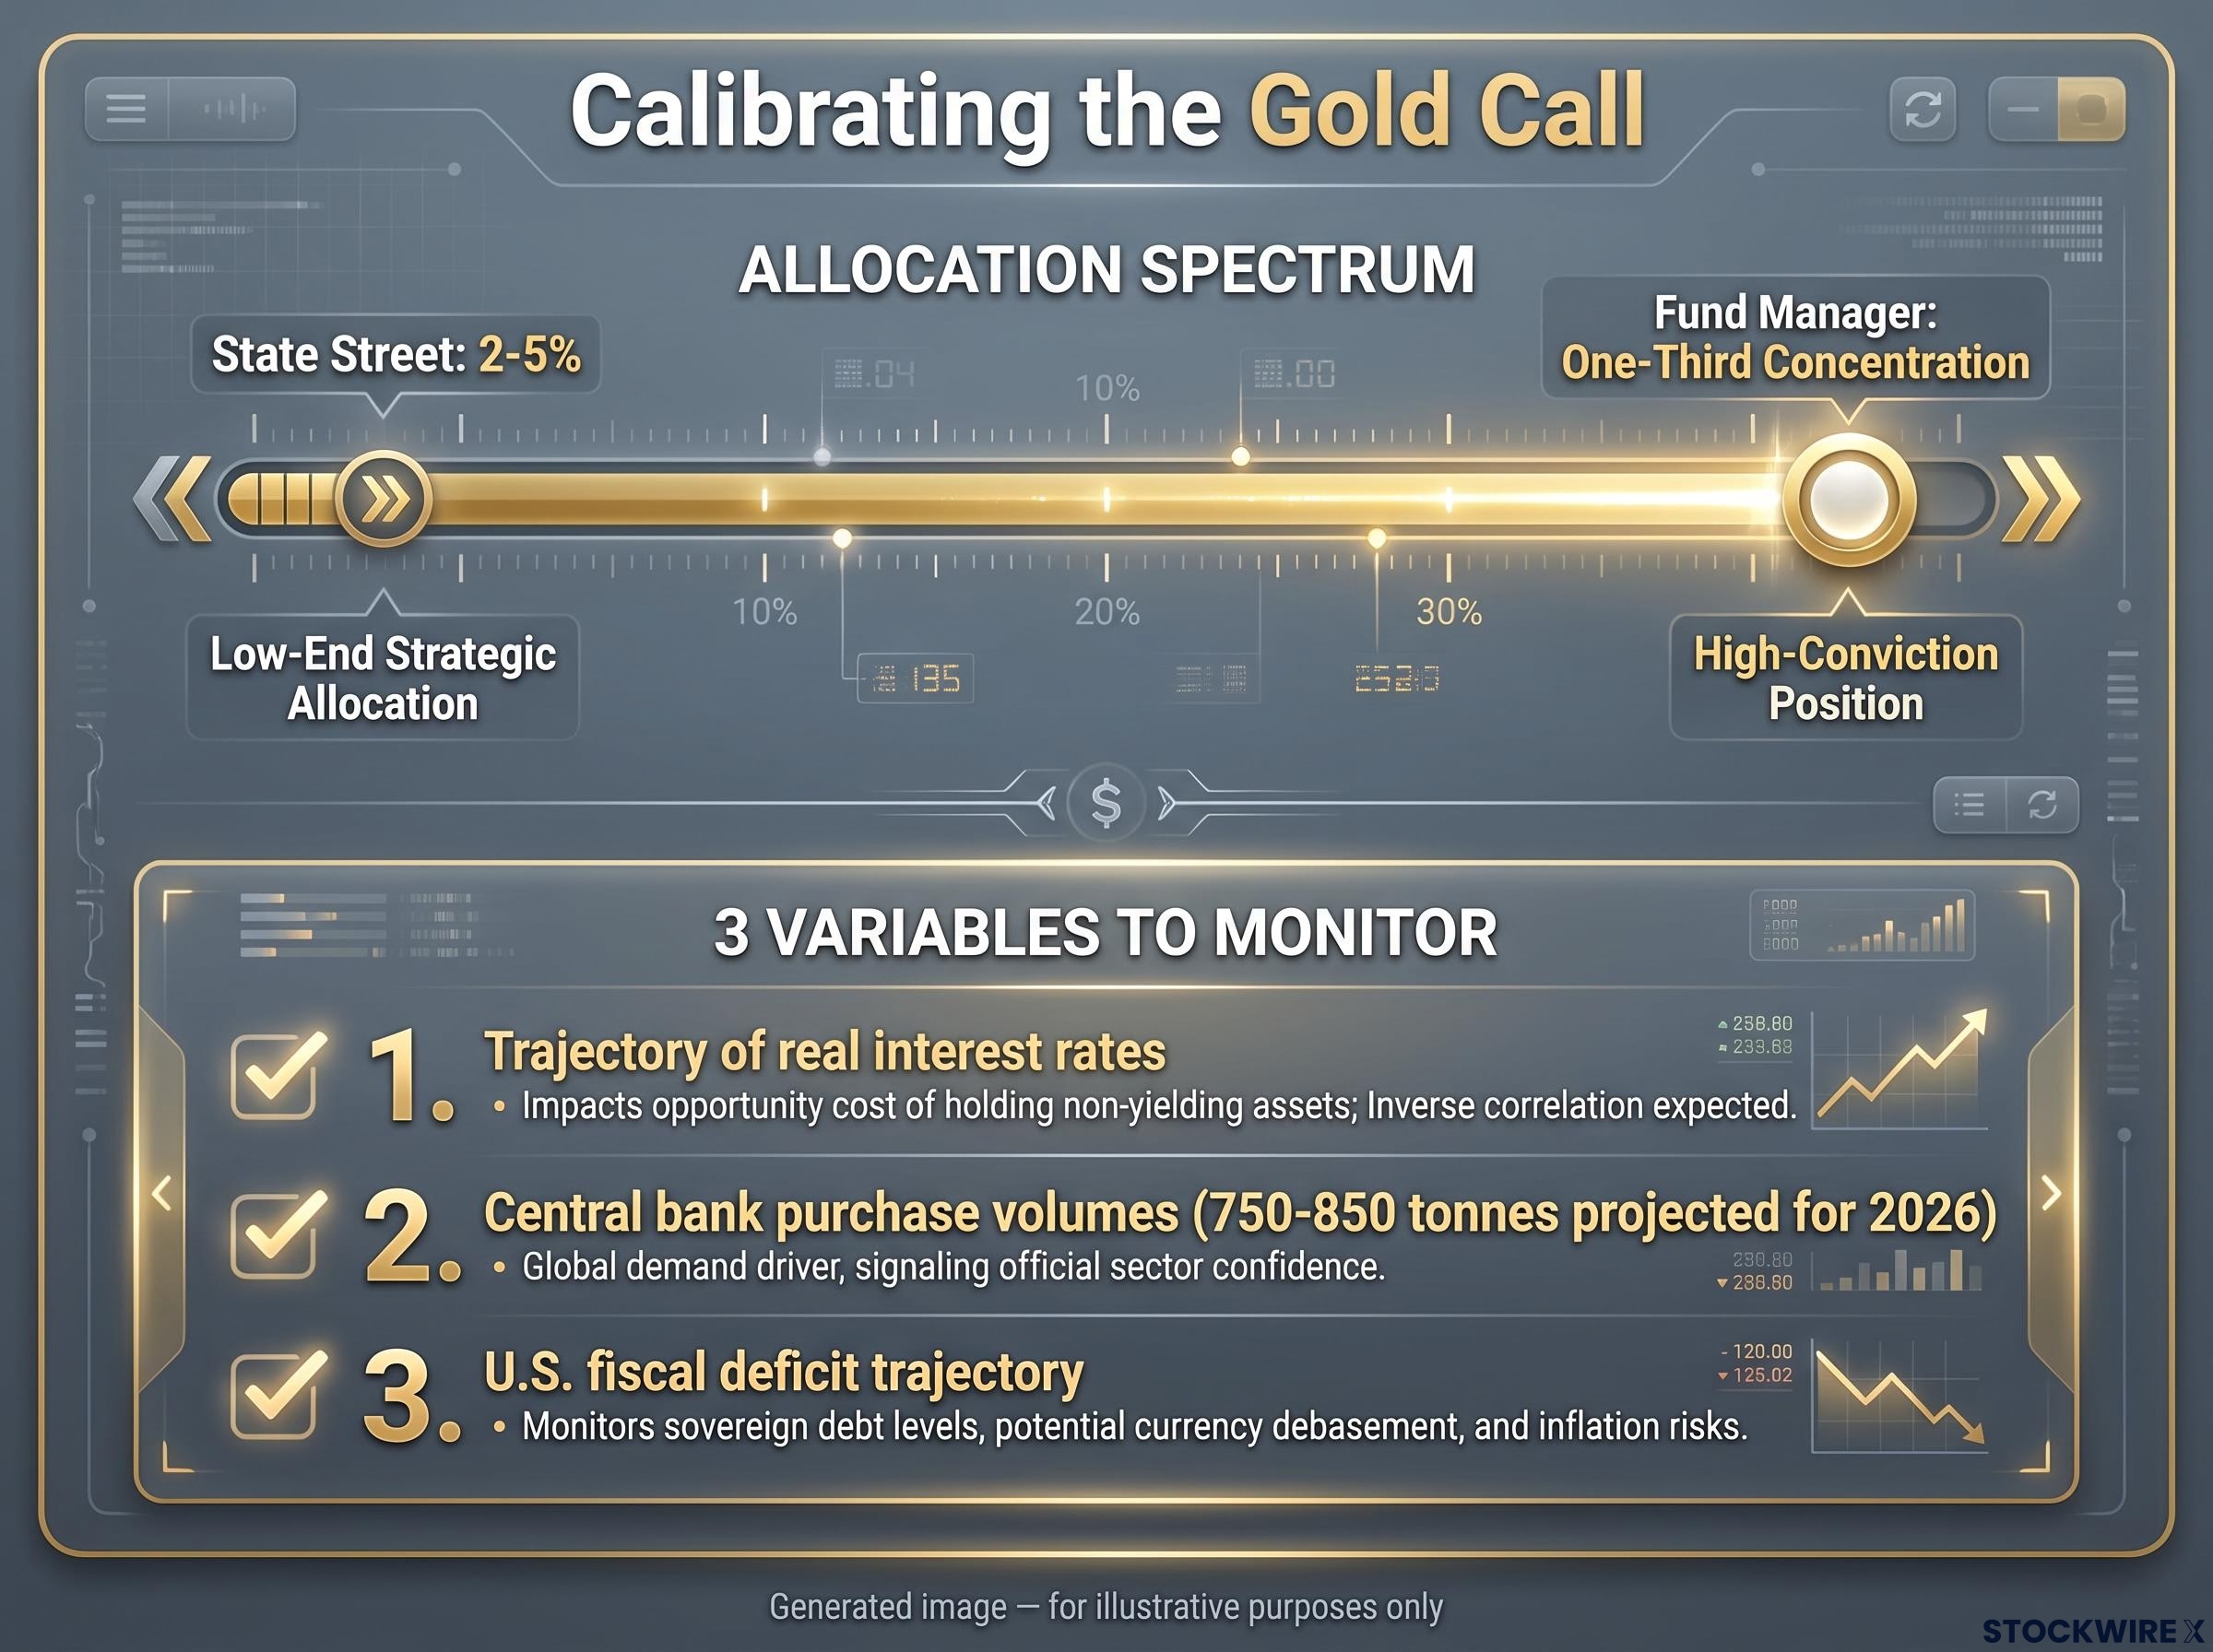
Where you sit on the allocation spectrum should follow from your own inputs. The informed range runs from State Street’s 2-5% strategic weighting to the fund manager’s one-third concentration, and your conviction level, inflation outlook, time horizon, and need for income determine where within that range you belong.
Three variables signal most clearly whether the thesis is strengthening or weakening:
- The trajectory of real interest rates, the single most direct driver of gold’s opportunity cost
- Central bank purchase volumes, with EBC citing World Gold Council projections of 750-850 tonnes for 2026 (presented as a projection, not a confirmed figure)
- The U.S. fiscal deficit trajectory, the source of the repression pressure in the first place
Watch those three, and a conviction becomes a falsifiable view with conditions you can actually monitor.
OTC gold demand delivered 327 tonnes in Q2 2026 alone, a category almost entirely absent from headline data, meaning widely cited investment figures were measuring the wrong pool while the dominant flow went unrecorded; that discrepancy matters for any model that uses reported ETF inflows as a proxy for total structural demand.
This article is for informational purposes only and should not be considered financial advice. Investors should conduct their own research and consult with financial professionals before making investment decisions. Past performance does not guarantee future results, and financial projections are subject to market conditions and various risk factors.