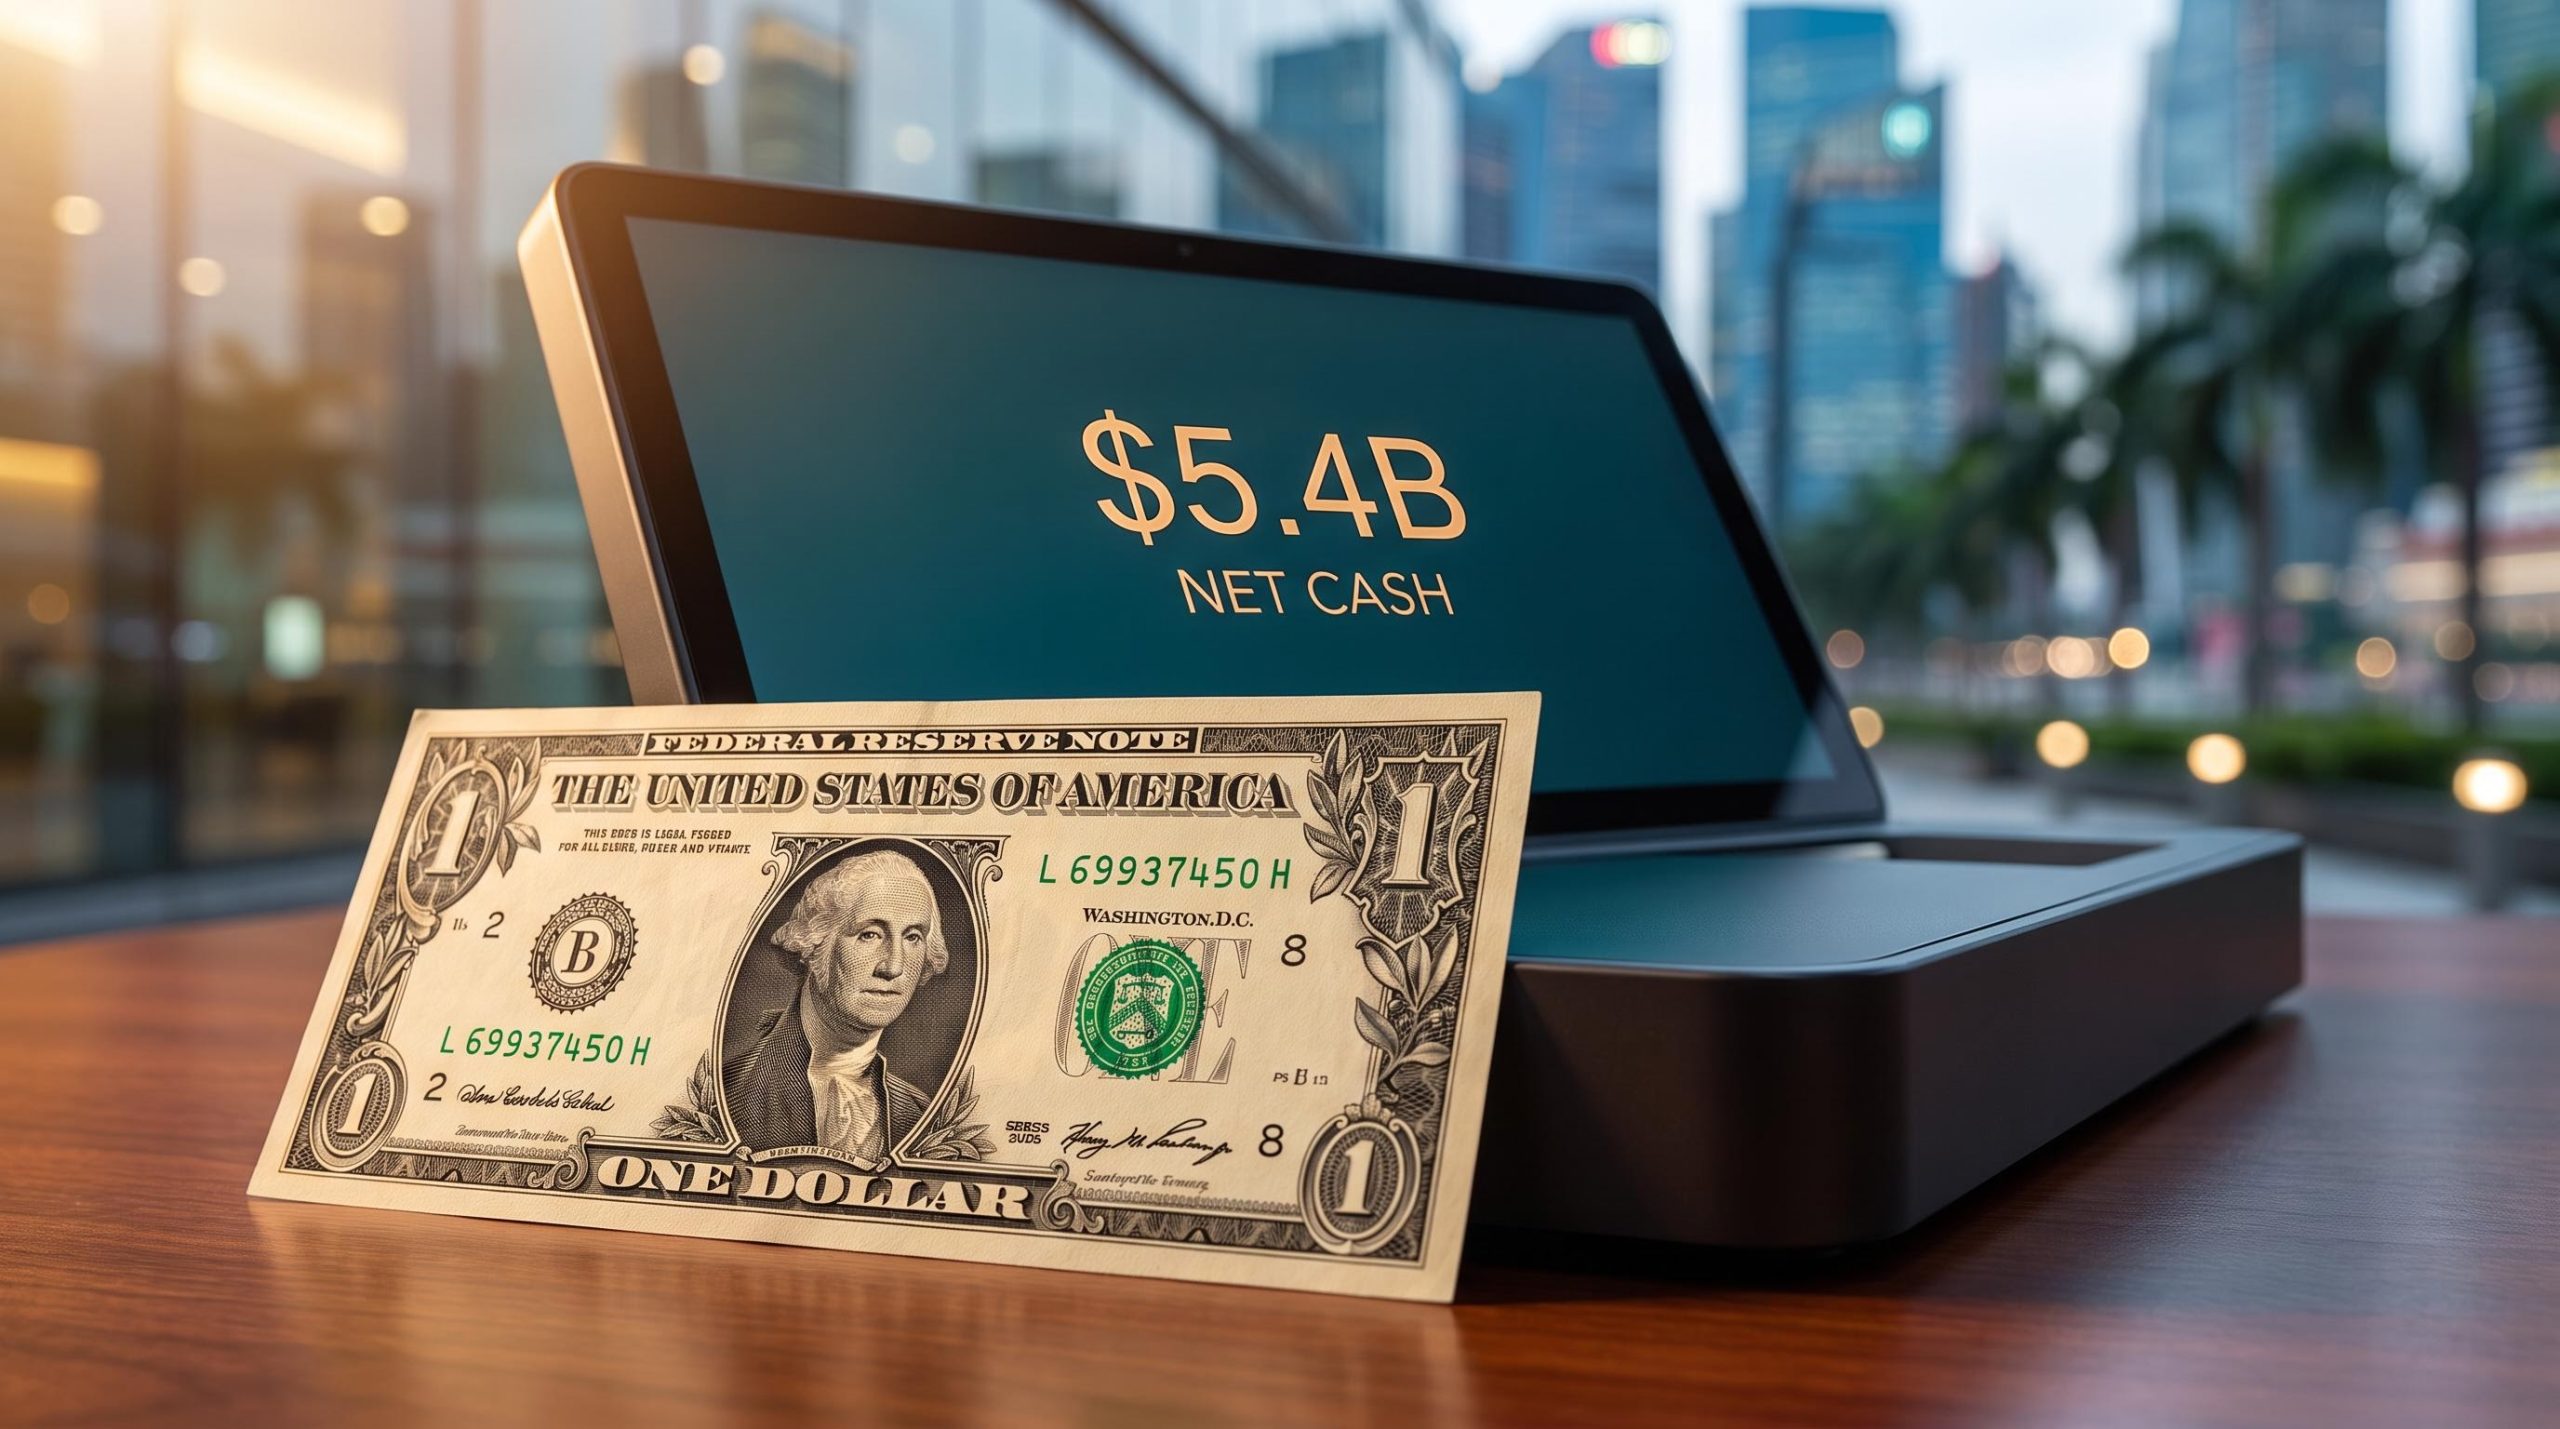
Here is the arithmetic that should stop any value investor mid-scroll. Grab Holdings trades at roughly $3 per share in early September 2026, down more than 70% over five years, yet the company holds $5.4 billion in net cash on its balance sheet. That works out to more than $1.20 per share in cash sitting behind a $3 share price.
The tension gets stranger the closer you look. Grab just posted its first full-year GAAP net profit of roughly $200 million in FY 2025, adjusted EBITDA is climbing 60% year-over-year toward a $700-720 million target for FY 2026, and management has authorised $1.75 billion in buybacks since 2024. And still, the stock sits at a fraction of its SPAC-era peak, with Jim Cramer of Mad Money publicly floating the possibility it goes to zero.
This is exactly the terrain where a genuine turnaround and a value trap hide side by side. This piece gives you a framework for deciding which of those two outcomes the data actually supports, rather than forcing you to pick between promotional analyst targets and blanket bear-case dismissals.
What the headline numbers actually say about Grab’s profitability
Start with the number management wants you to see. FY 2025 adjusted EBITDA came in at $500 million, a 60% jump year-over-year, with Q4 2025 alone contributing $148 million. Management guides FY 2026 adjusted EBITDA to $700-720 million, growth of 40-44%.
That is a genuinely strong-looking figure. The question is what survives once you strip the adjustments away.
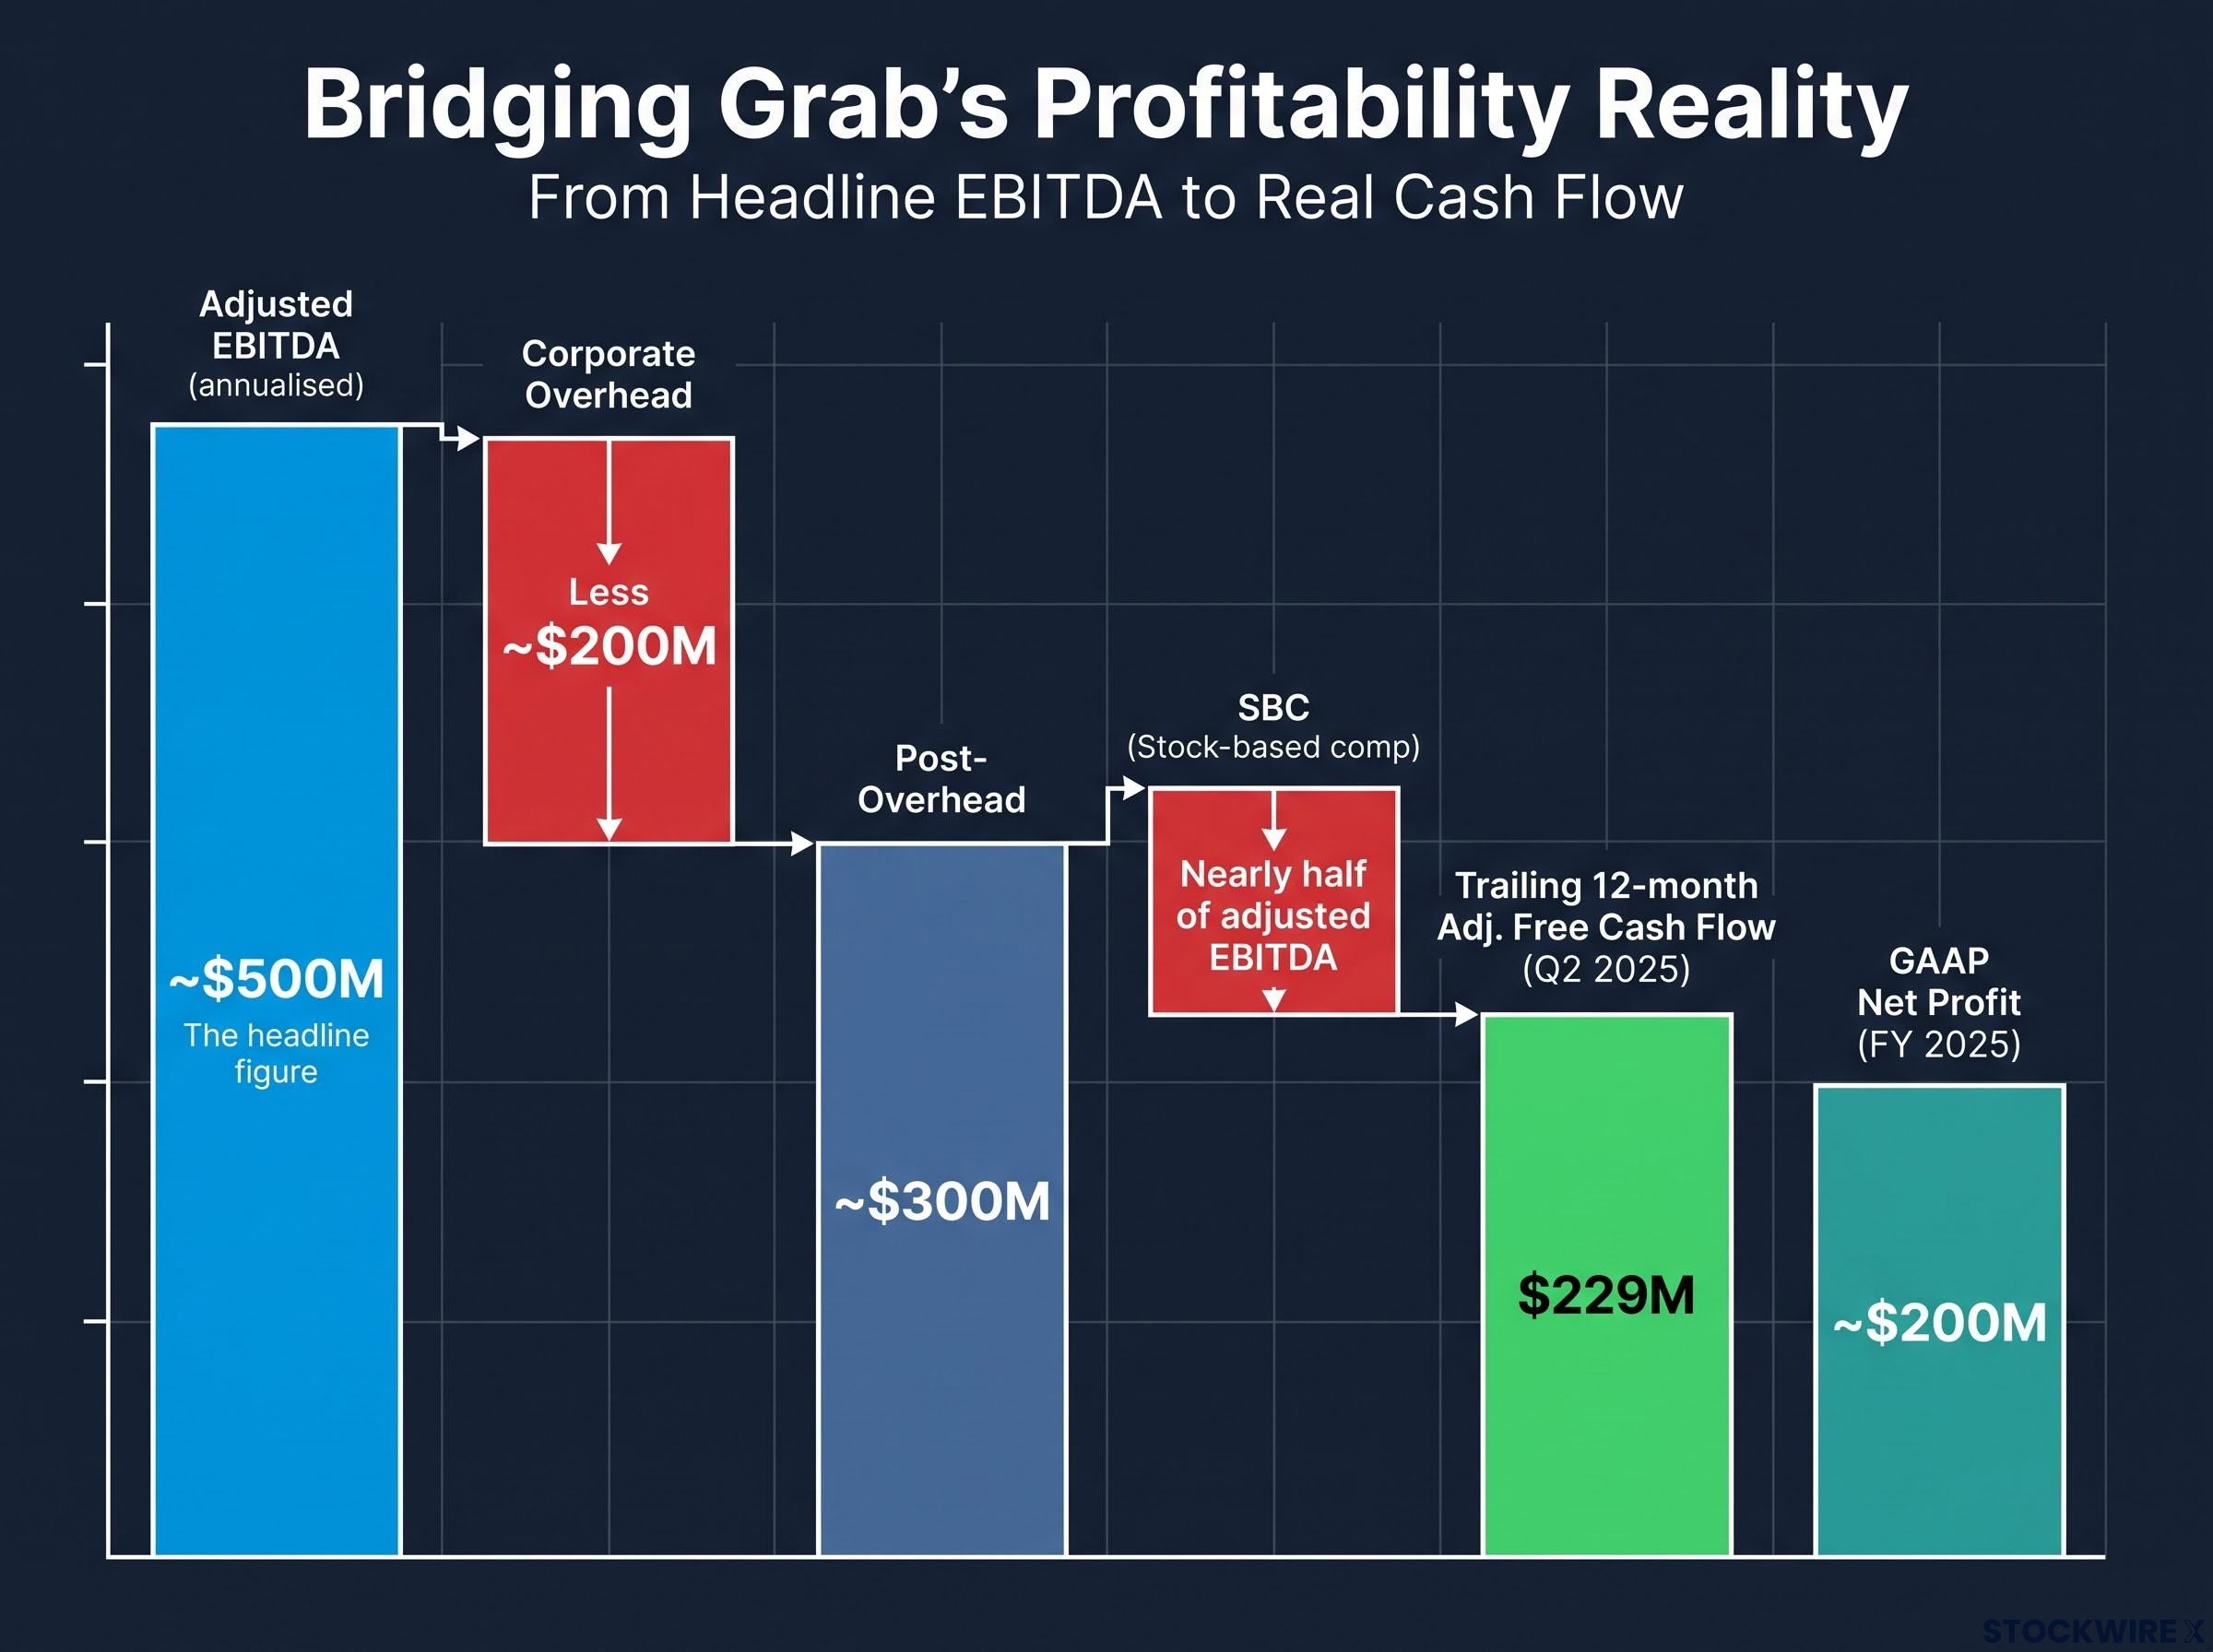
Adjusted EBITDA excludes a lot. In the first half of the fiscal year, that roughly $500 million annualised figure dropped to approximately $300 million after accounting for around $200 million in corporate-level overhead. Then it falls further, because stock-based compensation (shares handed to employees as pay, which dilutes existing shareholders) represents nearly half of adjusted EBITDA.
Here is the bridge from headline to reality.
| Metric | Amount | Note |
|---|---|---|
| Adjusted EBITDA (annualised) | ~$500M | The headline figure management guides on |
| Less corporate overhead | ~$300M | After roughly $200M in corporate-level expenses |
| Less SBC and M&A costs | Materially lower | SBC alone is nearly half of adjusted EBITDA |
The company does convert some of this into actual cash. Trailing 12-month adjusted free cash flow reached $229 million as of Q2 2025, up $274 million year-over-year. That is real money, and it matters. But it sits well below the $500 million adjusted EBITDA headline for a reason.
The segment picture explains where the profitability actually lives. Grab’s two core businesses are at very different stages of maturity.
- Mobility (ride-hailing): margins of approximately 8.6-8.7%, close to the revised steady-state target of 9%. This segment is near maturity.
- Delivery (food): margins of approximately 2%, against a stated target of 4%. This is the segment with room to run, but it has not run yet.
The read you should take from this is precise. Grab is profitable on the metric that drives management incentives, adjusted EBITDA, but not yet on the metric that determines your long-term returns, owner earnings after SBC and overhead. That distinction is the entire valuation debate compressed into a single gap.
Owner earnings after SBC represent the metric that matters most to long-term value investors, capturing what actually accrues to shareholders once employee dilution and capital costs are subtracted from operating profit, a discipline that surfaces the gap between headline EBITDA and genuine per-share value creation.
When big ASX news breaks, our subscribers know first
Is Grab’s super-app moat real, or priced on hope?
The bull case starts with structure, and the structure is persuasive. Grab operates dense driver and merchant networks across eight countries, and those networks create switching costs: a driver embedded in the Grab ecosystem, or a merchant reliant on its delivery flow, does not leave easily. ClearThesis AI (June 2026) framed this as a “toll bridge over the Southeast Asian digital economy.”
On top of that base sit the high-margin layers. Financial services and advertising build on the daily transaction volume that rides and food delivery already generate, and both carry far better economics than the underlying transport business. Seeking Alpha (March 2026) argued that fintech and advertising could unlock the next leg of growth precisely because they lift returns without requiring Grab to acquire new users.
So far, so compelling. Then the competitive reality sets the ceiling.
Indonesia is the constraint that never fully resolves. GoTo holds roughly 45-48% combined market share in ride-hailing and food delivery there, creating a near-permanent two-player dynamic in Grab’s most contested market. That structure caps how much Indonesian operations can contribute to group margins, no matter how well Grab executes elsewhere.
Three competitive pressure vectors define the ceiling:
Delivery platform consolidation is reshaping the competitive ceiling for any operator in the space, with Uber’s $14.8 billion Delivery Hero acquisition expanding its footprint to roughly 99 countries and altering the strategic calculus for regional platforms that compete on density and merchant network depth.
- GoTo in Indonesia: a 45-48% share duopoly means sustained margin pressure in the largest Southeast Asian market, limiting consolidated margin expansion.
- Tokopedia-TikTok Shop (tied up November 2023): intensified competition for merchants and consumer attention across Indonesian e-commerce and delivery.
- Sea Limited in fintech: direct competition (GrabPay versus ShopeePay, digital bank versus digital bank) that constrains the high-margin overlay thesis.
Comparable platforms suggest where this settles. Sea Limited and MercadoLibre show that even successful multi-business internet platforms often land at moderate GAAP margins at scale, with fintech and advertising lifting returns materially only if executed well. DBS Group Research, notably, assigns a 50% probability to a Grab-GoTo merger and premises its bull-case target of $6.64 partly on that outcome materialising, a reminder that even the optimists are pricing in a structural fix to the Indonesian problem.
The point to hold onto is this. The Indonesian two-player dynamic is not a near-term hurdle to be cleared but a structural ceiling on the most contested market, and any forward margin assumption you build should carry that ceiling inside it.
Fintech ambition and regulatory exposure
The fintech layer is where the bull case gets both its upside and its most underappreciated risk. Grab operates digital banking and lending in Singapore, Malaysia, and other markets, and these are exactly the high-margin overlays the “toll bridge” thesis depends on.
But lending carries risks that current profitability does not yet show. Loan losses, capital-adequacy requirements (rules forcing banks to hold minimum reserves against their loans), and tighter regulation in any of Grab’s eight markets could erode GrabFin’s contribution before it ever becomes material.
The MAS capital adequacy requirements set minimum reserve ratios and prudential buffers that digital banks operating in Singapore, including GrabFin, must maintain against their lending books, directly constraining how aggressively the fintech arm can scale before it becomes a regulatory drag on group-level returns.
Quantify what is at stake for you as a shareholder. If GrabFin stays loss-making or gets constrained by regulators, the high-margin overlay that justifies a premium valuation collapses, and the platform is worth materially less than the super-app narrative implies. This is one of the few risks that could invalidate the entire thesis rather than merely trim it.
The buyback programme and what it is actually doing to shareholder value
On the surface, the capital return story is aggressive and well-run. Grab has authorised roughly $1.75 billion in buybacks since 2024, executed through institutional partners including JPMorgan and Morgan Stanley, and funded entirely from excess cash rather than debt.
Here is the full programme.
| Programme | Authorisation | Executed | Mechanism |
|---|---|---|---|
| 2024 (completed) | $500M | $499.99M (126M shares, ~3% of float) | Open-market |
| February 2026 | $500M | $351M definitively disclosed | $250M ASR (JPMorgan) + $101M CFP (Morgan Stanley) |
| August 2026 | $750M | None disclosed (as of early Sept 2026) | Open-market and negotiated |
One footnote worth flagging: the February 2026 programme’s disclosed execution totals $351 million, while management described it as “roughly $400 million” on the August 2026 earnings call. The $351 million figure is the more precisely stated amount, and the gap between the two is the kind of thing worth watching in future disclosures.
Now the harder question. Because SBC represents nearly half of adjusted EBITDA, a meaningful portion of these buybacks is not returning surplus capital to you. It is cancelling the dilution created when Grab issues new shares to employees.
That reframes the whole exercise. A buyback that mops up SBC-driven dilution keeps your ownership stake from shrinking, which is defensive. A buyback that reduces share count on top of that is accretive. The programme is doing some of both, and the mix determines how much you actually benefit.
The floor beneath the debate Grab holds $5.4 billion in net cash, more than $1.20 per share, against a share price of roughly $3. That cash cushion is the strongest argument against a total collapse, even if it does nothing to guarantee the share price rises.
There is one more wrinkle. Management is pursuing acquisitions at the same time it authorises large buybacks, which sends a mixed signal about whether the priority is per-share value or empire-building.
The interpretation for you is straightforward. A buyback funded from $5.4 billion in net cash tells you Grab has the firepower to return capital aggressively. Whether that return is accretive or merely defensive depends entirely on whether SBC declines as a percentage of EBITDA over the next two to three years.
Bull case, bear case, and what has to be true for each
The return range here is not a subtle spread. It is a fork.
The bull case implies roughly 100% upside. Analyst consensus sits near $6.42, with DBS at a Buy rating and $5.68 target (bull-case $6.64) and Morgan Stanley Overweight at $5.90 (trimmed from $6.40). Against a share price of about $3.04, those targets imply the stock roughly doubles. The foundations are the 40-44% FY 2026 EBITDA growth guidance, roughly 20% revenue growth, and the fintech and advertising overlay finally earning its keep.
The bear case is a low-case annualised return of approximately 6%. That requires meaningful operating margin improvement from current levels well below 10%, and it assumes the SBC overhang persists, the Indonesian ceiling holds, and a faster-growing, more profitable Southeast Asian alternative offers better risk-adjusted returns for the same capital.
| Scenario | Key assumptions | Return implication | Primary risk |
|---|---|---|---|
| Bull | Delivery margins expand, fintech turns profitable, SBC falls as share of EBITDA | ~100% upside to ~$6.42 consensus; multi-bagger if execution compounds | Execution across all four levers at once |
| Bear | SBC persists, Indonesian ceiling caps margins, overhead stays sticky | ~6% annualised low-case return | Adjusted-profitable but GAAP-thin value trap |
For the bull case to materialise, four specific things must hold. This is your monitoring checklist, not a vague sense of optimism.
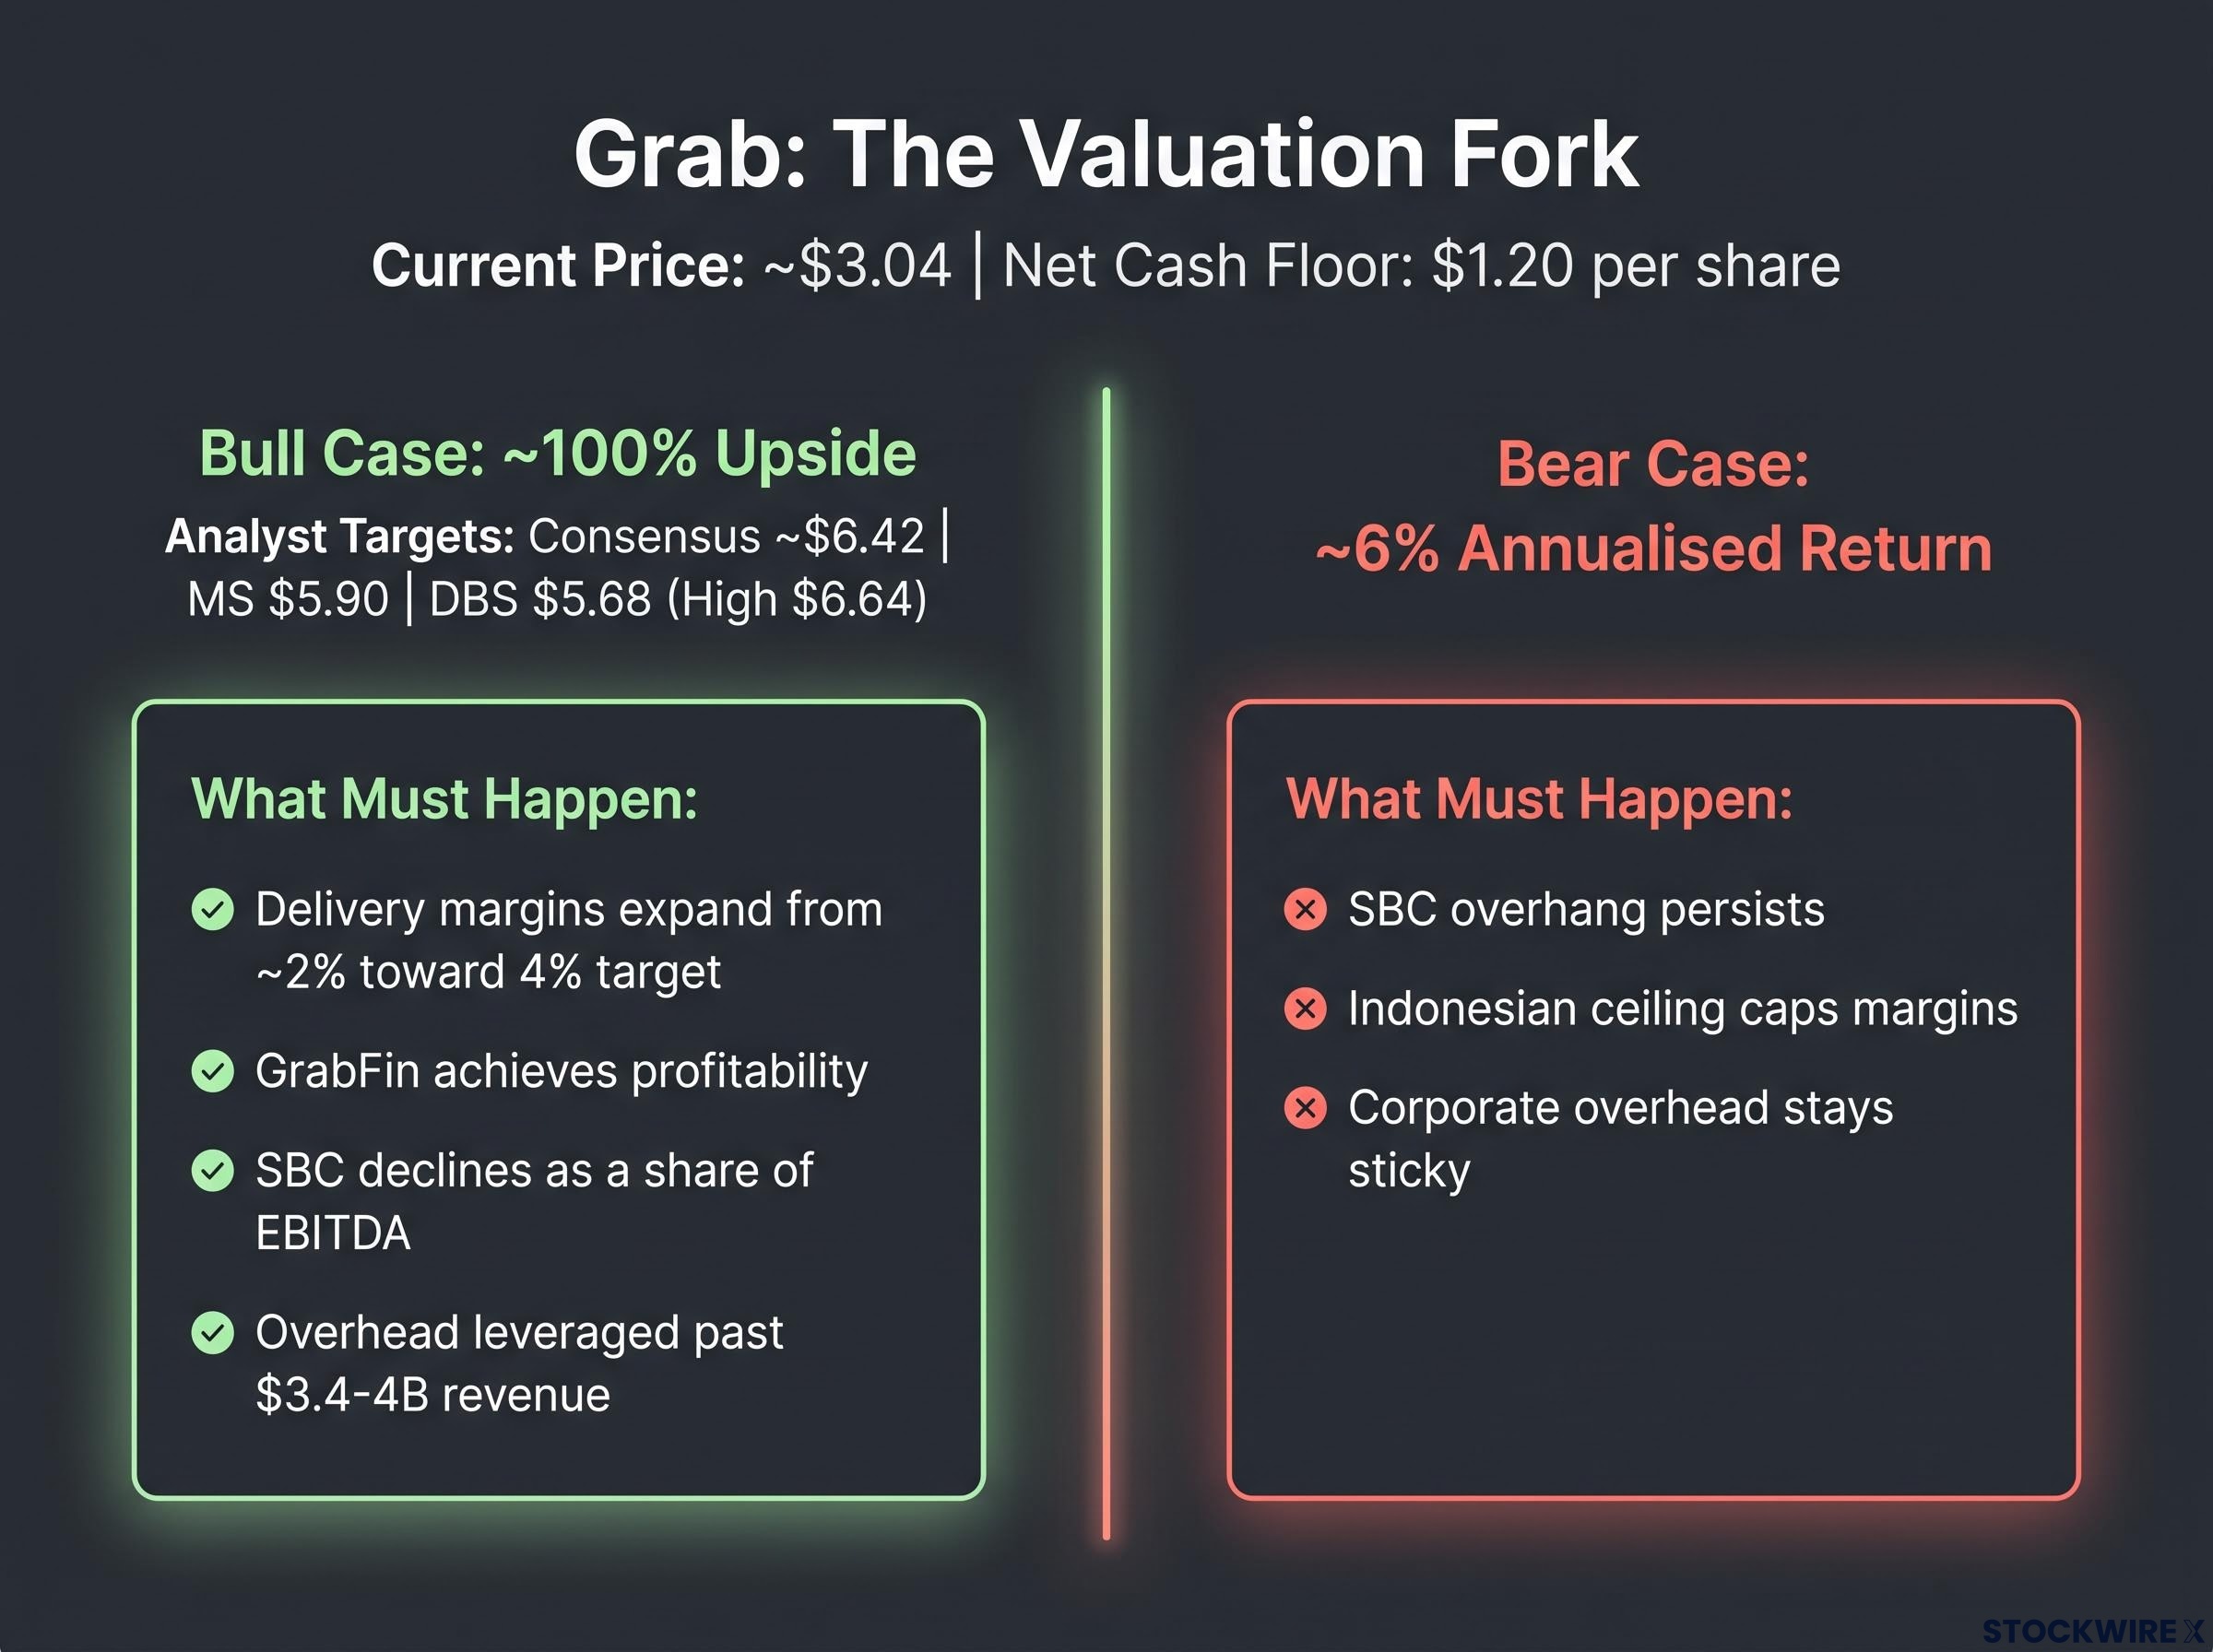
- Delivery margins must expand from roughly 2% toward the 4% target.
- GrabFin must achieve profitability rather than becoming a capital sink.
- SBC must decline materially as a share of EBITDA.
- Corporate overhead must be leveraged as revenues scale past the $3.4-4 billion level.
The most concrete institutional anchor for the bull-case multiple comes from DBS.
The Uber benchmark DBS values Grab’s on-demand business at approximately 20x 12-month forward EV/adjusted EBITDA, a 50% premium to Uber, justified by a projected 30% adjusted EBITDA CAGR over FY 2025-27.
That premium is the entire bull case in one number. It only holds if the growth rate justifies it. With a market capitalisation of roughly $12.4 billion, the market is clearly not paying that premium today.
The gap between a 6% low-case return and a multi-bagger high case is not ambiguity. It is a genuine decision, and your job is to assign a probability to those four bull-case assumptions based on how well Grab has executed so far.
A verdict for investors willing to do the math
Both stories are true at once, and that is what makes this hard. The profitability inflection is real: the first full-year GAAP net profit of $200 million, fourteen consecutive quarters of adjusted EBITDA growth, and $5.4 billion in net cash are not accounting illusions. But the SBC-adjusted owner earnings figure sits materially below the adjusted EBITDA headline, and the Indonesian competitive ceiling is structural, not temporary.
That combination points to a specific kind of investor. This suits someone with a 24-36 month horizon who can tolerate high-beta volatility, accepts that the SBC gap will take several years to close, and genuinely believes the fintech overlay will turn profitable rather than draining capital. DBS itself frames the upside thesis as needing 12-24 more months of consistent profitable growth and controlled fintech risk before it is validated.
The price-versus-estimate gap is one of the clearest value trap diagnostics available to investors: a stock falling faster than analysts cut earnings estimates typically signals the market has absorbed bad news the consensus has not yet caught up to, a pattern that fits Grab’s sustained discount to book and analyst targets almost precisely.
Three variables will resolve which scenario unfolds. Watch these.
- Delivery segment margins (quarterly): movement from 2% toward 4% is the positive signal; stalled or falling margins is the warning.
- GrabFin credit loss trends (biannual): contained losses and licence progress confirm the overlay thesis; rising loan losses or regulatory friction breaks it.
- SBC as a percentage of EBITDA (each reporting period): a steady decline over the next four to six quarters is accretive; a flat ratio means the buybacks are just a treadmill.
The honest verdict is this. The $5.4 billion net cash floor limits your catastrophic-loss scenario, but it does not make Grab cheap on owner earnings. The decision rests entirely on how much confidence you have in the delivery and fintech margin assumptions over the next two years, and whether Grab is genuinely the best available vehicle for Southeast Asian digital economy exposure, or merely an available one.
This article is for informational purposes only and should not be considered financial advice. Investors should conduct their own research and consult with financial professionals before making investment decisions.
Past performance does not guarantee future results. Financial projections are subject to market conditions and various risk factors. These statements are speculative and subject to change based on market developments and company performance.