
Every major bank in Australia just reported strong profits. Then investors sold every single one of them. In August 2026, the big four banks each delivered returns that fell short of an ASX 200 which itself advanced 1.1% for the month, with CBA and Westpac shedding nearly 9% each despite posting record or above-consensus earnings. The gap between what the numbers said and what the market did is the story worth understanding.
The August reporting season produced a clean natural experiment: four major banks, four results events across a three-week window, and four sets of management commentary all pointing in the same direction. What investors heard beneath the headline profit figures was a consistent signal about slowing mortgage demand, cautious outlooks, and deliberate credit buffer construction. The reaction was a sector-wide re-rating on forward expectations, not backward results.
Reading the August results carefully tells you something the headline numbers do not. This analysis breaks down which metrics actually drove the sell-offs, what the mortgage application data signals about net interest income, and what each bank’s individual performance reveals about where the big four stand heading into Q4 FY2026.
Record profits, falling share prices: what the August results actually showed
CBA posted a record cash net profit after tax (NPAT) of $10.982 billion, up 7% year-on-year. Its shares fell 0.7% on results day, 12 August, and finished the month down 9.9% in total return terms, or 8.4% adjusted for the $2.70 fully franked final dividend.
Westpac reported quarterly statutory NPAT of $1.8 billion, representing a 3% improvement over the preceding quarter. Shares dropped 5.9% on 10 August, the sharpest single-day sell-off in the cohort, and ended August down 8.8%.
NAB delivered the strongest quarterly profit growth of the four, with statutory NPAT of $1.81 billion, up 32% against the first-half quarterly average. The stock still fell 4.6% on 17 August and closed the month down 6.5%.
ANZ was the outlier. Cash profit reached $1.90 billion, equivalent to a 1% rise against the first-half quarterly average to 31 March, and shares rose 4.5% on 13 August. Its August total return was -0.3%, the narrowest underperformance in the group.
Against an ASX 200 that gained 1.1%, every one of them finished behind the benchmark. That is not a company-specific story.
The ASX bank valuation premium entering August was historically extreme, with CBA trading at approximately 27-28x forward earnings against a long-run average of 18x, a starting point that amplified the market’s punitive response to any forward uncertainty in the results.
CBA’s record cash NPAT of $10.982 billion, the strongest single result in the cohort, was paired with the largest monthly decline at -9.9%. The paradox captures exactly how the market was pricing the big four in August: on what comes next, not what just happened.
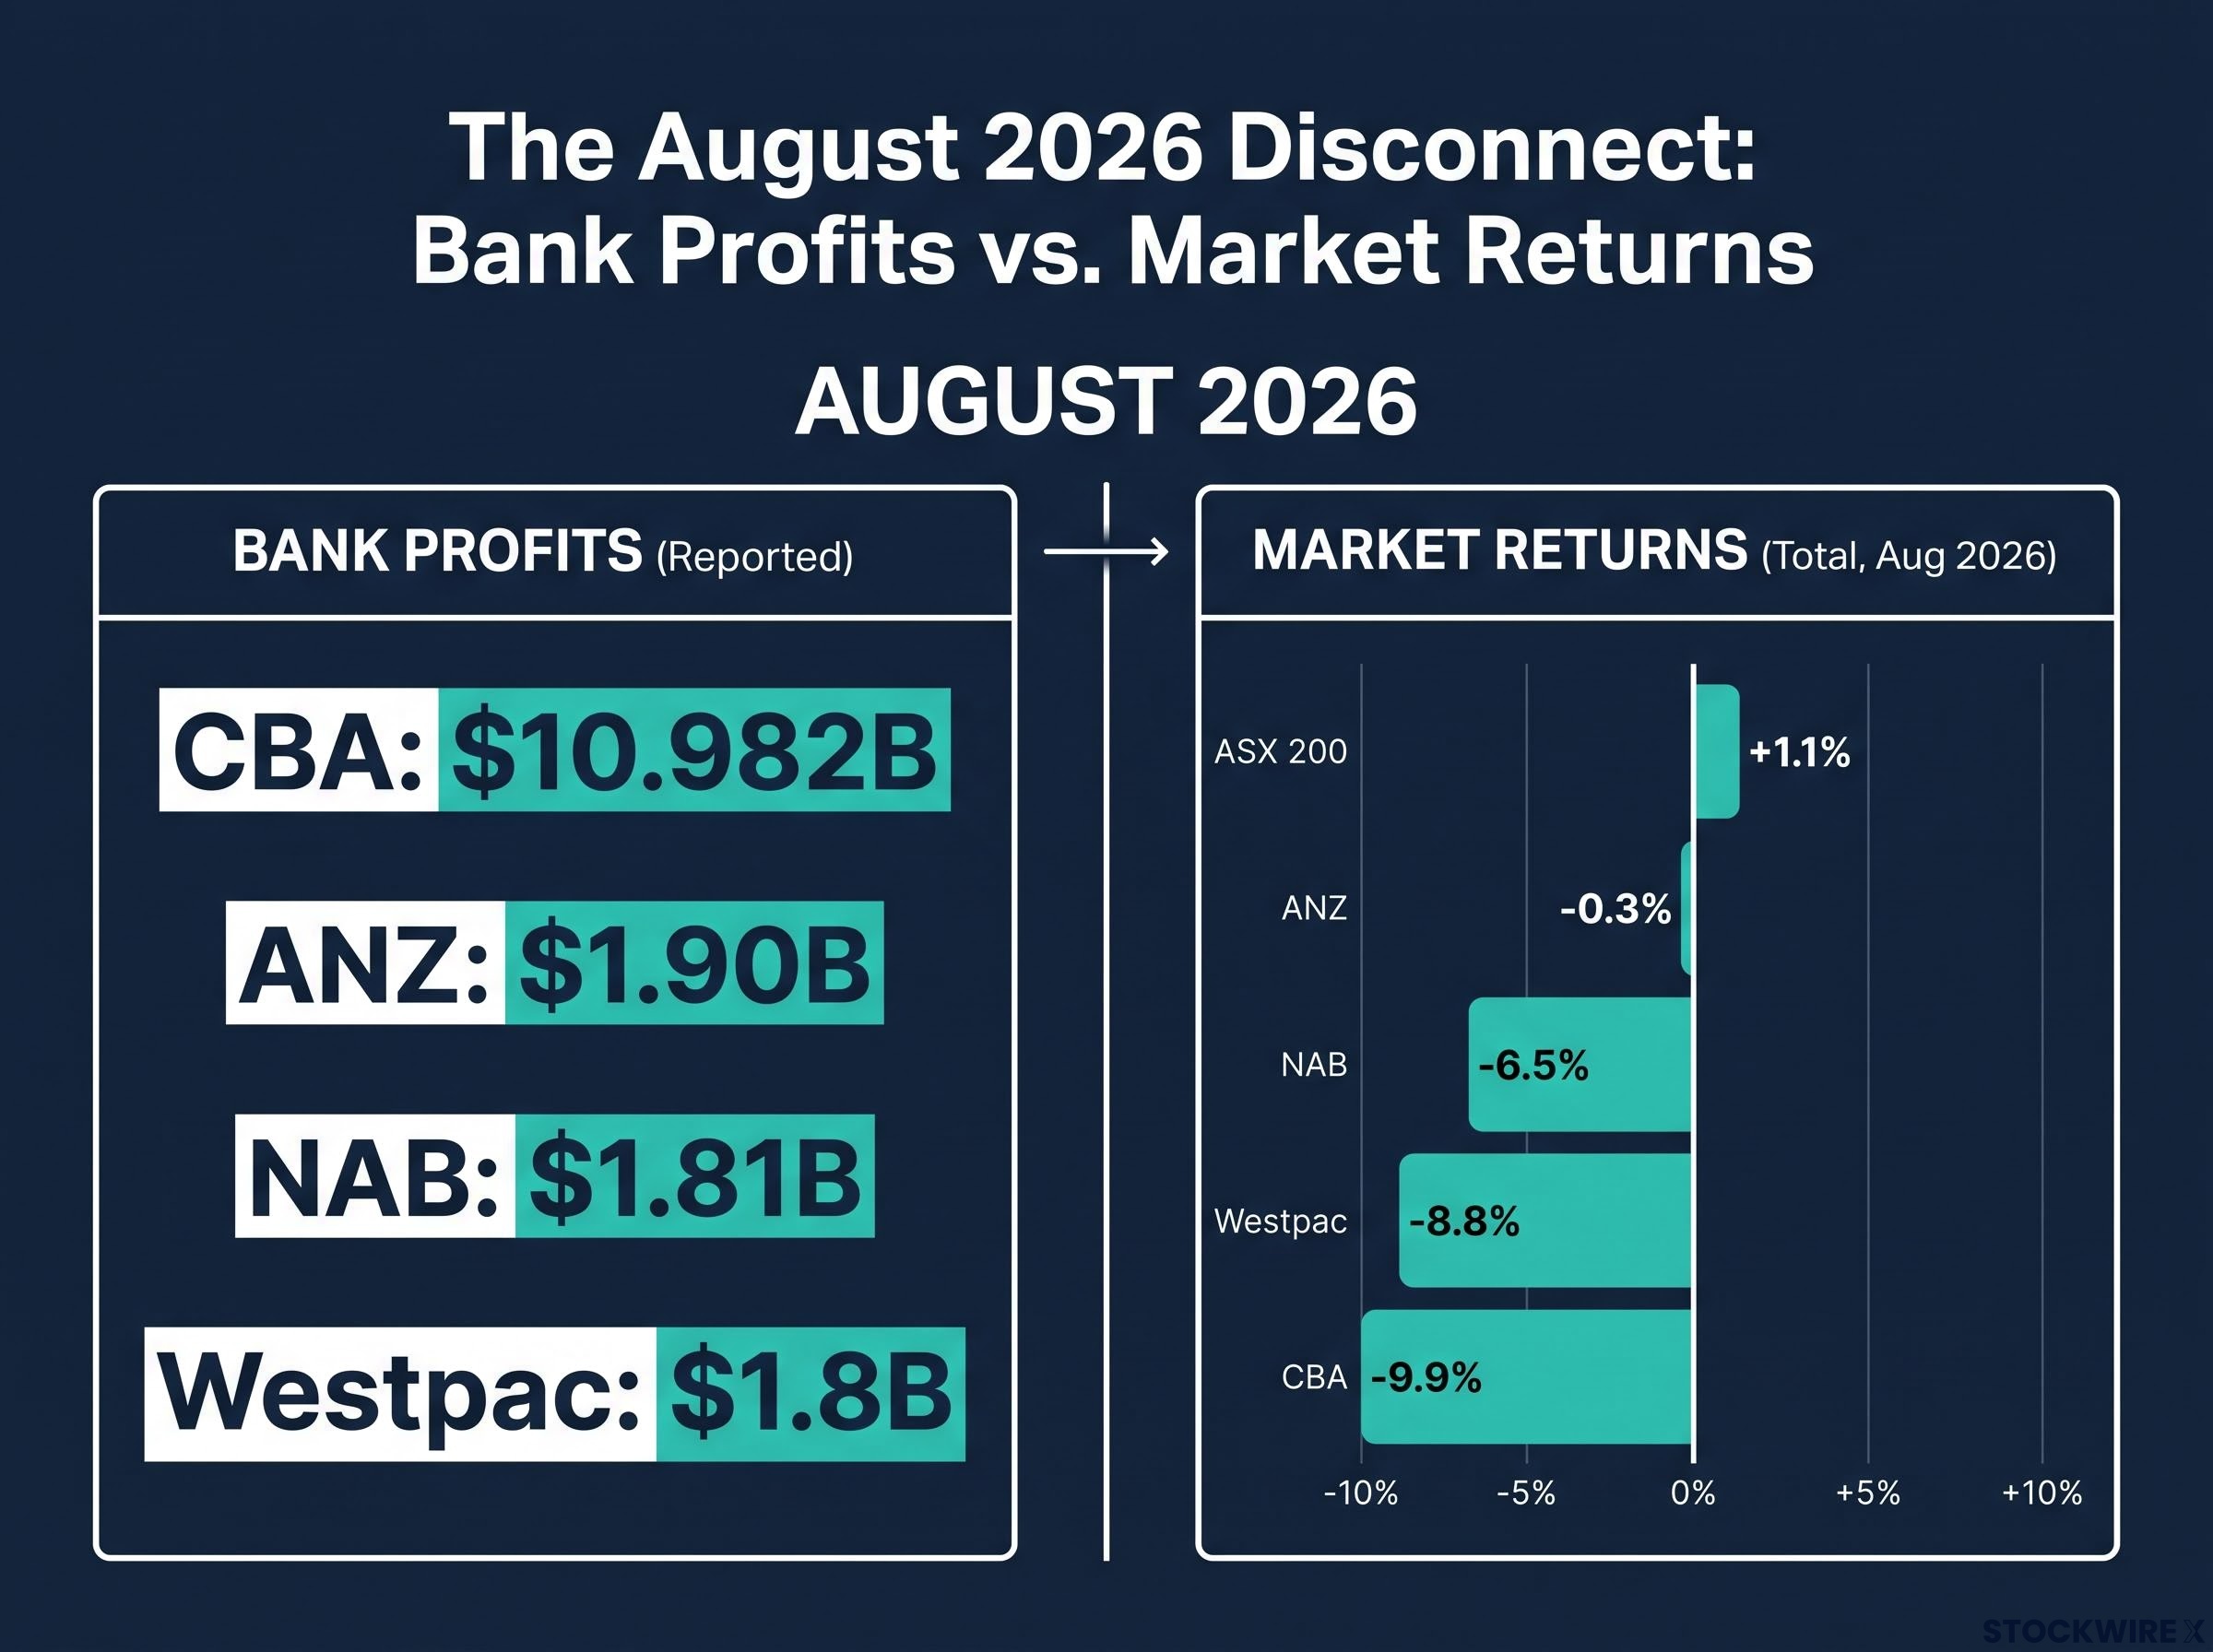
| Bank | Results Date | Headline Profit Metric | Share Price Move (Results Day) | August 2026 Total Return |
|---|---|---|---|---|
| CBA | 12 August | Cash NPAT $10.982B (+7% YoY) | -0.7% | -9.9% |
| Westpac | 10 August | Statutory NPAT $1.8B (+3% QoQ) | -5.9% | -8.8% |
| NAB | 17 August | Statutory NPAT $1.81B (+32% vs 1H26 avg) | -4.6% | -6.5% |
| ANZ | 13 August | Cash profit $1.90B (+1% vs 1H26 avg) | +4.5% | -0.3% |
| ASX 200 | — | — | — | +1.1% |
The consistent sell-off across four separate results events, despite profits ranging from solid to record, tells you the market is pricing these banks on what comes next. That shift in valuation logic is what investors need to recalibrate around.
When big ASX news breaks, our subscribers know first
The mortgage cliff: how a Federal Budget policy change rewrote the lending outlook
The forward signal that worried investors most was not in the profit figures. It was in the mortgage application data.
NAB disclosed that home loan applications fell 15% quarter-on-quarter and 16% year-on-year in Q3 FY2026 (the quarter ended 30 June 2026). These are NAB’s own ASX disclosure figures. ANZ confirmed a 12% decline in its own applications over the same period. CBA and Westpac were both reported in sector coverage to have experienced double-digit declines, though those figures have not been independently confirmed from primary ASX disclosures.
Four institutions. One quarter. Double-digit declines across the board.
NAB CEO Andrew Irvine acknowledged directly that “the Australian home lending market softened in 3Q26.” When the chief executive of Australia’s third-largest bank names the problem unprompted in an ASX disclosure, it is not a data artefact. It is a management-level concern.
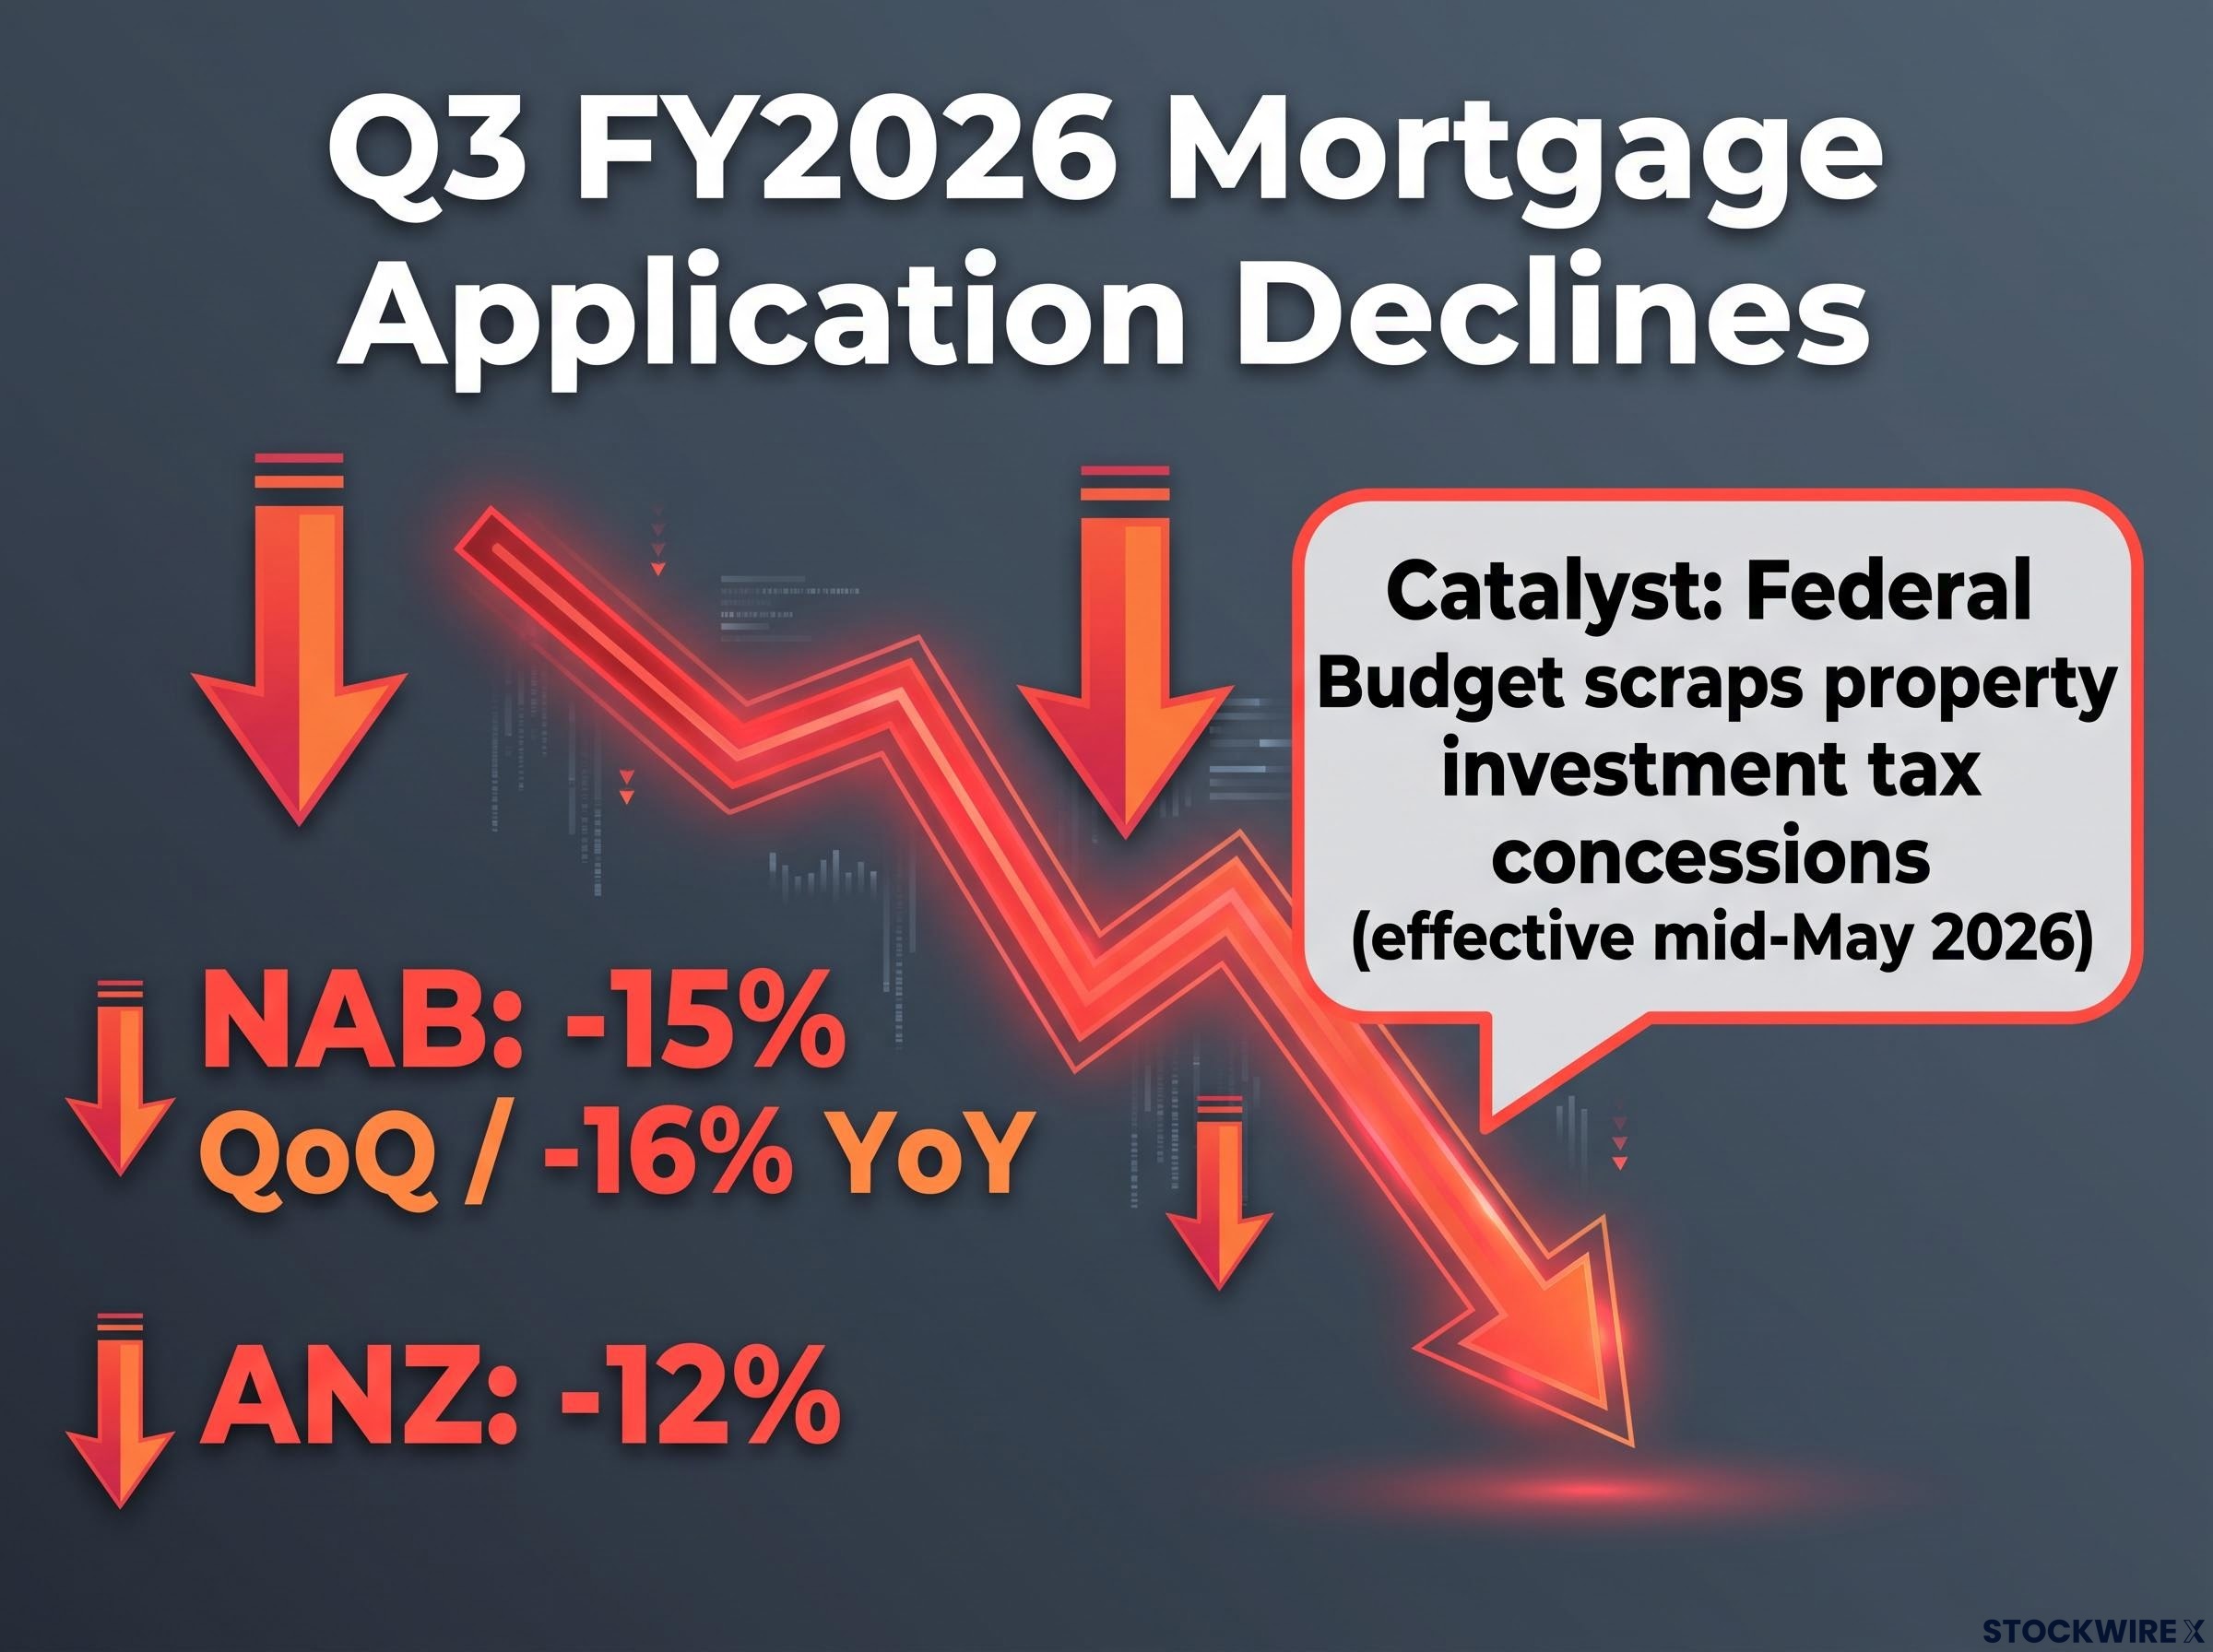
| Bank | Application Decline | Reference Period | Source Status |
|---|---|---|---|
| NAB | -15% QoQ / -16% YoY | Q3 FY2026 | Confirmed (ASX disclosure) |
| ANZ | -12% | Q3 FY2026 | Confirmed (ASX disclosure) |
| CBA | Double-digit decline reported | Post mid-May 2026 | Unverified from primary disclosure |
| Westpac | Larger decline cited in coverage | Post mid-May 2026 | Unverified from primary disclosure |
Why the Federal Budget change matters beyond the quarter
The catalyst was structural, not seasonal. The Labor government’s Federal Budget scrapped certain property investment tax concessions, effective from mid-May 2026. ANZ management explicitly attributed a meaningful portion of its mortgage decline to these policy changes.
That distinction matters. A cyclical dip in mortgage demand, driven by rate sensitivity or seasonal softness, tends to reverse when conditions shift. A policy-driven change to the tax treatment of property investment alters the demand calculus for a significant segment of borrowers: investors, not just owner-occupiers. When the incentive structure for leveraged property investment changes, the applications it was generating do not simply come back when rates move.
The mid-May effective date also means the Q3 data captures only a partial-quarter impact. Full-quarter effects will first appear in Q4 FY2026 reporting.
For anyone holding the big four, a double-digit fall in mortgage applications across every major lender in a single quarter is a leading indicator that home lending revenue, which underpins a significant portion of each bank’s net interest income (NII, the difference between what a bank earns on loans and pays on deposits), faces a headwind that a single rate move is unlikely to reverse quickly.
The divergence in housing credit growth forecasts between the big four is itself a forward signal: NAB projected just 2.5% system credit growth for FY27, more than 60% below its own FY26 estimate, while CBA revised its guidance down from 5-7% to approximately 4-5%, with the optimist moving toward the pessimist.
What Westpac’s provisioning reveals about where the sector thinks credit risk is heading
If the mortgage data told investors about demand, Westpac’s credit provisioning told them about risk.
At 30 June 2026, Westpac’s total credit impairment provisions stood at $5.3 billion, of which $2.0 billion had been set aside above the bank’s own base-case economic scenario, a figure the bank had actively built up over the period.
$2.0 billion above the base-case scenario. When a bank holds that level of provisions against an economic outcome worse than its own central forecast, it is making a quantified institutional judgment that the downside is plausible enough to price in now.
Credit impairment provisions are capital a bank sets aside to absorb potential loan losses. The base-case scenario is the bank’s own central economic forecast, the outcome its economists consider most likely. Provisions above that level are buffers against a worse outcome: higher unemployment, falling property values, or accelerating household stress.
| Metric | Level | Reference Date |
|---|---|---|
| Total credit impairment provisions | $5.3 billion | 30 June 2026 |
| Provisions above base-case scenario | $2.0 billion | 30 June 2026 |
| Impairment charges | ~10 bps of avg gross loans | Q3 FY2026 |
Westpac’s net interest margin (NIM) held steady at 1.89% during the quarter, a genuine positive that showed the bank was at least maintaining its lending spread. But the market gave that stability far less weight than the provisioning build-up. The 5.9% share price drop on 10 August was the sharpest single-day reaction in the cohort.
Net interest margin dynamics, provisioning philosophy, and funding composition are the three variables that determine whether a bank’s headline earnings are sustainable; NIM compression of even 15-20 basis points can materially reduce a major bank’s net profit and dividend capacity, making Westpac’s stable 1.89% figure a more consequential positive than the market’s reaction acknowledged.
Similar precautionary tones appeared across the other three banks:
- CBA management pointed to weakening consumer spending levels and an expectation that broader economic growth in Australia would moderate
- NAB reported elevated attention to credit quality alongside its mortgage decline data
- ANZ commentary noted a cautious economic backdrop alongside its quarterly update
None of the other three, however, disclosed an equivalent quantified overlay figure. That makes Westpac’s $2.0 billion the single most transparent window into how the sector collectively views credit risk right now. When a bank deliberately holds that level of capital above its own central case, it is telling you its own economists consider the downside scenario plausible enough to price in today.
ANZ’s relative resilience and what each bank’s August tells you about their individual positioning
Within a broadly negative month, the individual stories diverge in ways that matter for positioning.
ANZ was the standout among its peers, the only bank to close higher on results day. Its shares climbed 4.5% on 13 August, a result that looked markedly different from the heavy selling that greeted the other three banks’ updates. The quarterly numbers were modest: cash profit of $1.90 billion, flat revenue, and a 12% decline in home loan applications. But that mortgage decline was the smallest confirmed figure in the cohort, and the credit narrative was less alarming than Westpac’s quantified overlay.
The contrast with CBA crystallises the forward-versus-backward valuation dynamic. CBA posted the record result: $10.982 billion in cash NPAT, return on equity of 14.0%, operating income of $30.224 billion (up 6.2% year-on-year), and a full-year dividend per share of $5.05. By every trailing metric, it was the strongest performance in the sector. And it suffered the worst monthly return.
That tells you the market was not rejecting CBA’s profitability. It was discounting CBA’s exposure to the same forward headwinds, and at a premium valuation, the discount was steeper.
The metric that matters most heading into Q4 FY2026
Across all four results, mortgage application volumes were the most consistent forward signal. It was the one metric where every institution showed the same directional movement, the one that management teams named explicitly, and the one most directly connected to future net interest income.
Q4 FY2026 data will capture the first full quarter of the Federal Budget policy change impacts, making it the most important reporting window for assessing whether August’s mortgage declines represent a new floor or an ongoing deterioration.
Each bank’s August positioning, in one line:
- CBA: Record trailing earnings, but the premium valuation amplified the punishment for any forward uncertainty; -9.9% for the month
- NAB: Strongest quarterly profit growth in the cohort, but the largest confirmed mortgage application decline (-15% QoQ) overshadowed it; -6.5% for the month
- Westpac: Stable NIM at 1.89% was the one operational positive in an otherwise cautious update dominated by the $2.0 billion provisioning overlay; -8.8% for the month
- ANZ: Modest profit, smallest confirmed mortgage decline, and the least alarming credit narrative earned it the best relative outcome; -0.3% for the month
The cross-bank comparison tells you that in August 2026, the market was rewarding banks that looked less exposed to forward credit and housing headwinds, not those with the largest trailing profits. That distinction should inform how you weigh each institution’s current valuation.
What a sector-wide underperformance month tells investors about big four valuations right now
Three intersecting forces defined August for Australian bank stocks, and they are connected, not separate.
The trailing-versus-leading indicator gap showed investors that strong past profits do not insulate against forward repricing. The policy-driven mortgage demand shock gave the forward concern a specific, named catalyst with a quantifiable timeline. And the credit provisioning build-up, led by Westpac’s $2.0 billion above-base-case buffer, revealed that the banks themselves see enough downside risk to set capital against it now.
The ASX 200 gained 1.1% in August 2026. The big four returned between -0.3% (ANZ) and -9.9% (CBA). When four of Australia’s most widely held stocks all underperform a rising market in a single month, it is a signal about institutional sentiment, not individual company problems.
The Q4 FY2026 reporting cycle is the next checkpoint. Three data points will be most diagnostic:
- Mortgage application volumes: Whether the double-digit declines stabilise or continue to deteriorate under the first full quarter of the Federal Budget policy change
- Provisioning overlay trajectory: Whether Westpac’s $2.0 billion above-base-case buffer holds steady, grows, or begins to be released, and whether other banks disclose equivalent figures
- Net interest margin direction: Whether the sector maintains current spreads or faces compression from competitive lending pressure in a shrinking mortgage market
Whether August represents a one-month re-rating or the start of a multi-quarter revaluation depends almost entirely on whether mortgage application volumes stabilise in Q4. That single metric is the clearest watch point for investors in this sector right now.
For investors wanting to translate August’s mortgage application data and provisioning disclosures into a forward valuation framework, our comprehensive walkthrough of ASX bank stock stress-testing covers arrears thresholds, CET1 ratio buffers, and NIM sensitivity inputs that connect the sector’s current headwinds to specific earnings range scenarios.
CBA’s $2.70 fully franked final dividend is a reminder that income investors received a concrete return even within a deeply negative capital return month. A month where four of Australia’s most widely held stocks all underperform a rising market is not a reason to act impulsively in either direction. It is a signal to understand the mechanism, and the August results provide enough specific data to assess the sector’s forward risk with considerably more precision than headline profit figures allow.
This article is for informational purposes only and should not be considered financial advice. Investors should conduct their own research and consult with financial professionals before making investment decisions. Past performance does not guarantee future results. Financial projections are subject to market conditions and various risk factors.
—