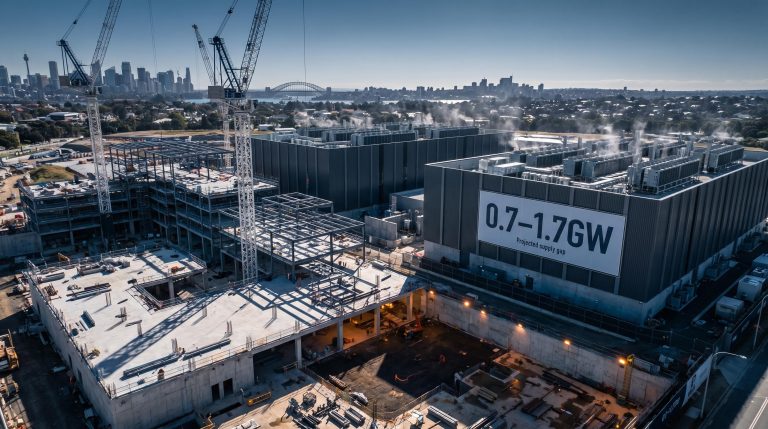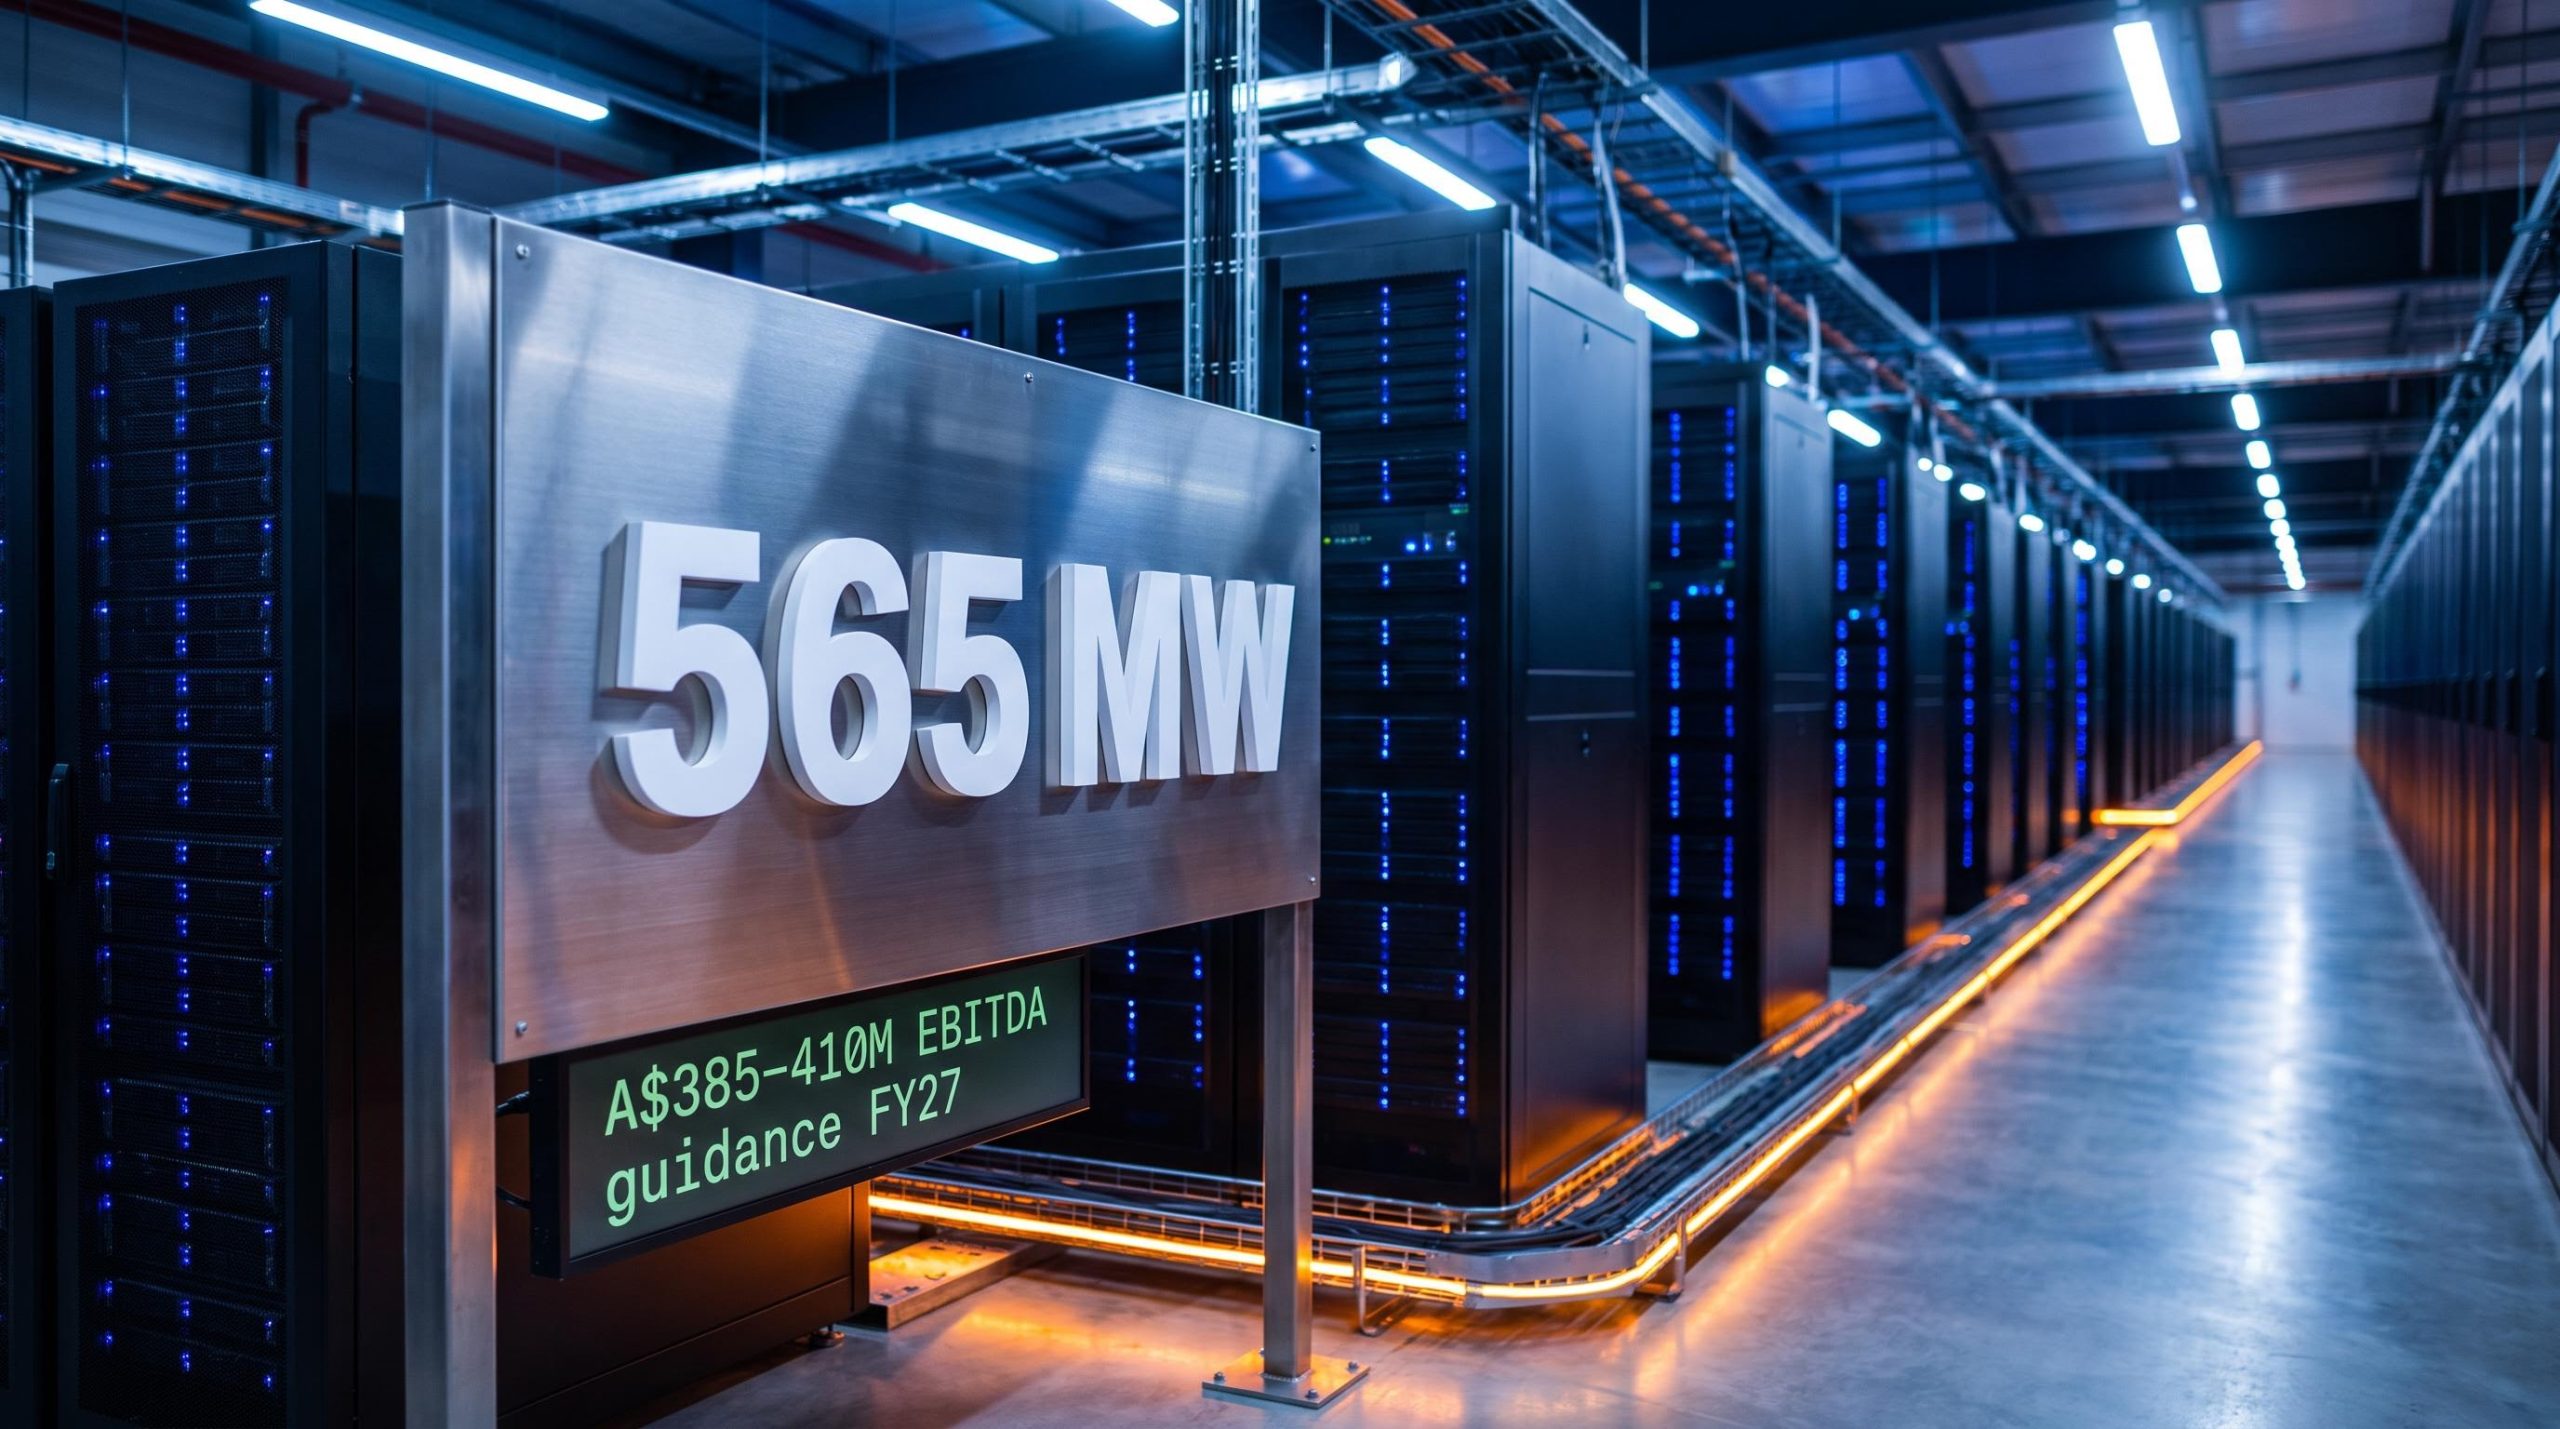
NextDC holds a 565 MW forward order book, more than three times its current billing utilisation. That is the number the bull case rests on: a contracted growth runway stretching through FY30 that few ASX-listed companies can match. Yet Morningstar assigns the stock no economic moat, and at least one detailed valuation analysis suggests the shares trade at a significant premium to intrinsic value.
That tension sits at the centre of every investment decision involving NextDC. AI and cloud infrastructure demand is real, and Australian investors have limited options for listed, sovereign exposure to the theme. NextDC is, in practice, one of very few ASX-listed vehicles offering direct access to carrier-neutral data centre capacity. But scarcity of listed exposure is not the same as scarcity of competitive advantage, and confusing the two is where capital gets mispriced.
AI infrastructure investment on the ASX spans multiple exposure models, including colocation operators, property trusts, and network services, each carrying a distinct risk and return profile within the same structural trend, and NextDC sits at the highest-conviction, highest-capital-intensity end of that spectrum.
This piece gives you a structured way to weigh both sides of the case, including four structural risks that do not appear cleanly in a revenue growth chart. The goal is a framework you can update as evidence arrives, not a static verdict on a stock this complex.
What NextDC actually sells, and why the economics are misunderstood
The most common misconception is that NextDC is an AI compute company. It is not. Customers own and operate the servers. NextDC sells powered floor space, power usage, and connectivity between clouds, carriers, and enterprises inside its facilities. The distinction matters because it changes which metrics you should be watching.
Revenue growth depends on contracted capacity, power utilisation rates, and interconnection density. That makes contracting quality and utilisation the correct analytical lens, not headline AI demand narratives. Over 70% of billing capacity now comes from hyperscale workloads, meaning the business is anchored directly to cloud provider capital expenditure decisions rather than to the broader AI theme in a diffuse sense.
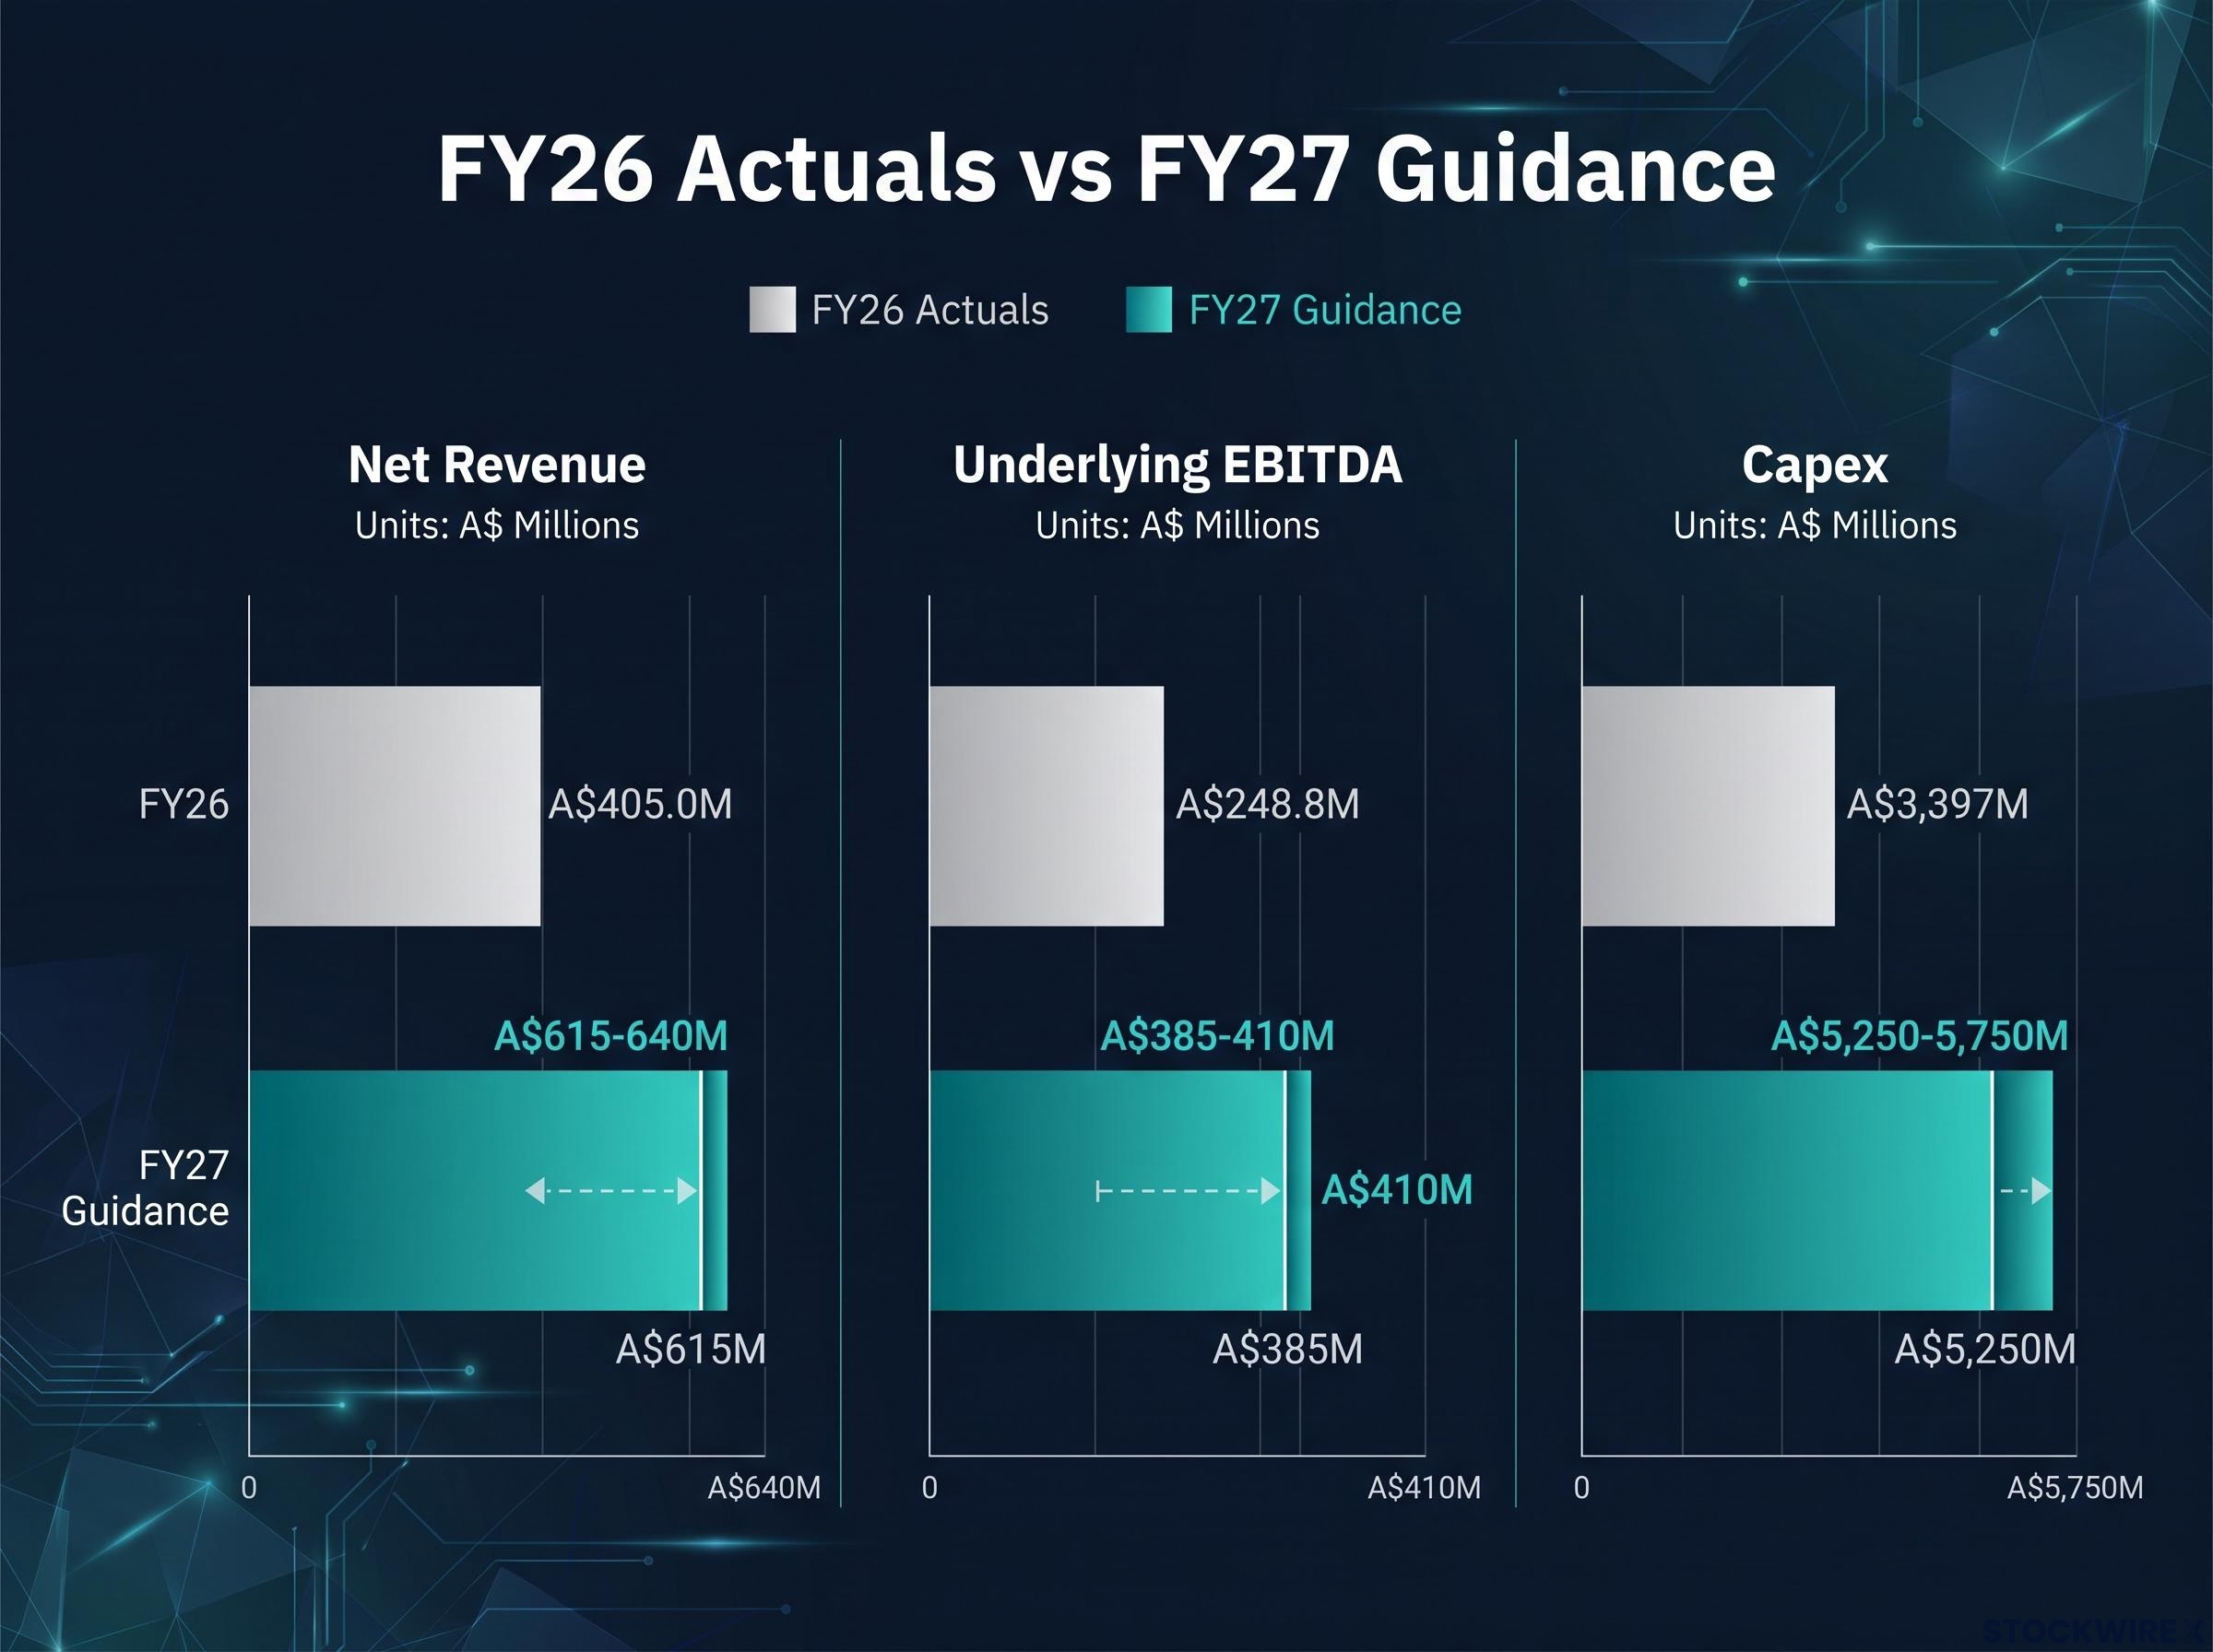
The financial trajectory reflects that anchor. FY26 net revenue reached A$405.0 million, up 16% year on year. Underlying EBITDA came in at A$248.8 million, up 15% and ahead of guidance. Billing utilisation hit 175 MW, a 58% year-on-year increase, while contracted utilisation stood at 740.1 MW pro forma.
The single number that captures the J-curve dynamic: a forward order book of 565 MW, more than 3.2 times current billing utilisation, expected to convert progressively through FY27-FY30.
The domestic footprint covers 17 Australian facilities spread across eight cities, alongside operating sites in Kuala Lumpur and Japan:
- Sydney: four facilities
- Melbourne: three facilities
- Perth: two facilities
- Brisbane: two facilities
- Adelaide: one facility
- Canberra: one facility
- Darwin: one facility
- Newman: one facility
| Metric | FY26 Actual | FY27 Guidance | Change |
|---|---|---|---|
| Net revenue | A$405.0M | A$615-640M | +52-58% |
| Underlying EBITDA | A$248.8M | A$385-410M | +55-65% |
| Billing utilisation | 175 MW | ~197 MW conversion | +13% billing conversion |
| Capex | A$3,397M | A$5,250-5,750M | +55-69% |
What this tells you is that NextDC’s returns are driven by the quality and duration of hyperscale contracts and the depth of its interconnection ecosystem, not by AI narrative momentum. Evaluating the stock means assessing those drivers specifically rather than using AI exposure as a proxy for quality.
When big ASX news breaks, our subscribers know first
The structural case for owning NextDC: scarcity, network effects, and contracted visibility
The bull case is not just thematically attractive; it has structural logic that explains why serious institutional capital sits on the register. Three advantages underpin it:
- Sovereign scarcity. NextDC is one of very few scale, carrier-neutral data centre platforms listed on the ASX. International operators have made relatively limited inroads into Australia compared with other developed markets, giving the company a first-mover positioning advantage that is real, even as new capital arrives to contest it.
- Network effects. Each additional cloud provider, carrier, or enterprise inside a NextDC facility increases the connectivity value for every other participant. International analogues Equinix and Digital Realty demonstrate how this flywheel compounds at scale: multi-market, high-connectivity platforms generate increasing returns as cross-regional traffic intensifies and enterprises adopt hybrid cloud architectures.
- Contracted visibility. Long-dated contracts and the 565 MW forward order book underpin multi-year revenue visibility that is unusually strong for a growth stock of this type.
FY27 EBITDA guidance of A$385-410 million represents a 55-65% year-on-year increase, the single most quantified anchor for the growth trajectory’s near-term credibility.
The FY27 billing conversion of approximately 197 MW is expected as a staging post, with further acceleration in FY28. Targeted yields on hyperscale deployments using efficient cooling technologies exceed 10%. Interconnection services are expected to grow in significance as enterprises move to hybrid cloud storage models, adding a higher-margin revenue layer on top of base colocation.
Why the J-curve cash-flow profile matters for timing
The J-curve is the defining feature of the financial profile: heavy upfront capital expenditure and negative free cash flow now, converting to strong cash generation as assets reach maturity and ramp utilisation. This curve extends through at least the early 2030s, meaning patience and entry price discipline are prerequisites for positive returns, not optional refinements.
The 565 MW forward order book and multi-year guidance upgrade tell you that near-term revenue visibility is unusually strong. But the quality of that revenue, specifically contract terms, counterparty mix, and conversion timing, matters more than the headline MW figure in assessing whether the bull case holds through to the mid-2030s.
Four structural risks that a revenue growth chart will not show you
The most quantified risk is hyperscaler customer concentration. Two customers reportedly account for roughly 46% of data centre revenue (this figure is approximate and sourced from external analysis, not independently confirmed). Over 70% of billing capacity is tied to hyperscale workloads. Major cloud providers have the financial scale and technical capability to build out their own dedicated campuses and bring third-party enterprise workloads in-house. If even one significant hyperscaler redirected capacity investment toward its own infrastructure, the consequences for NextDC’s utilisation rates and pricing power would be material.
The broader question of AI capex returns remains unresolved at the industry level, with US$630 billion in combined hyperscaler spending in 2026 raising investor scrutiny over monetisation timelines, a macro dynamic that directly shapes the probability of hyperscalers maintaining or expanding their third-party colocation commitments through the decade.
The capital intensity compounds this exposure. FY26 capex reached A$3,397 million, and FY27 guidance lifts that to A$5,250-5,750 million. Total available senior debt facilities stand at A$8.7 billion, with pro forma liquidity of A$8.7 billion. Analysts have flagged significant shareholder dilution risk from sustained external financing dependency, though this concern is directional rather than independently verified. The funding model works if demand holds and facilities ramp on schedule. If either falters, the balance sheet tightens quickly.
Morningstar analyst Dan Baker assigns NextDC a no-moat rating, with the concern that return on invested capital (ROIC), the profit a company generates relative to the capital it invests, will not consistently exceed its cost of capital over the next decade. In plain terms: even if revenue and EBITDA grow, the value created per dollar of capex may be marginal.
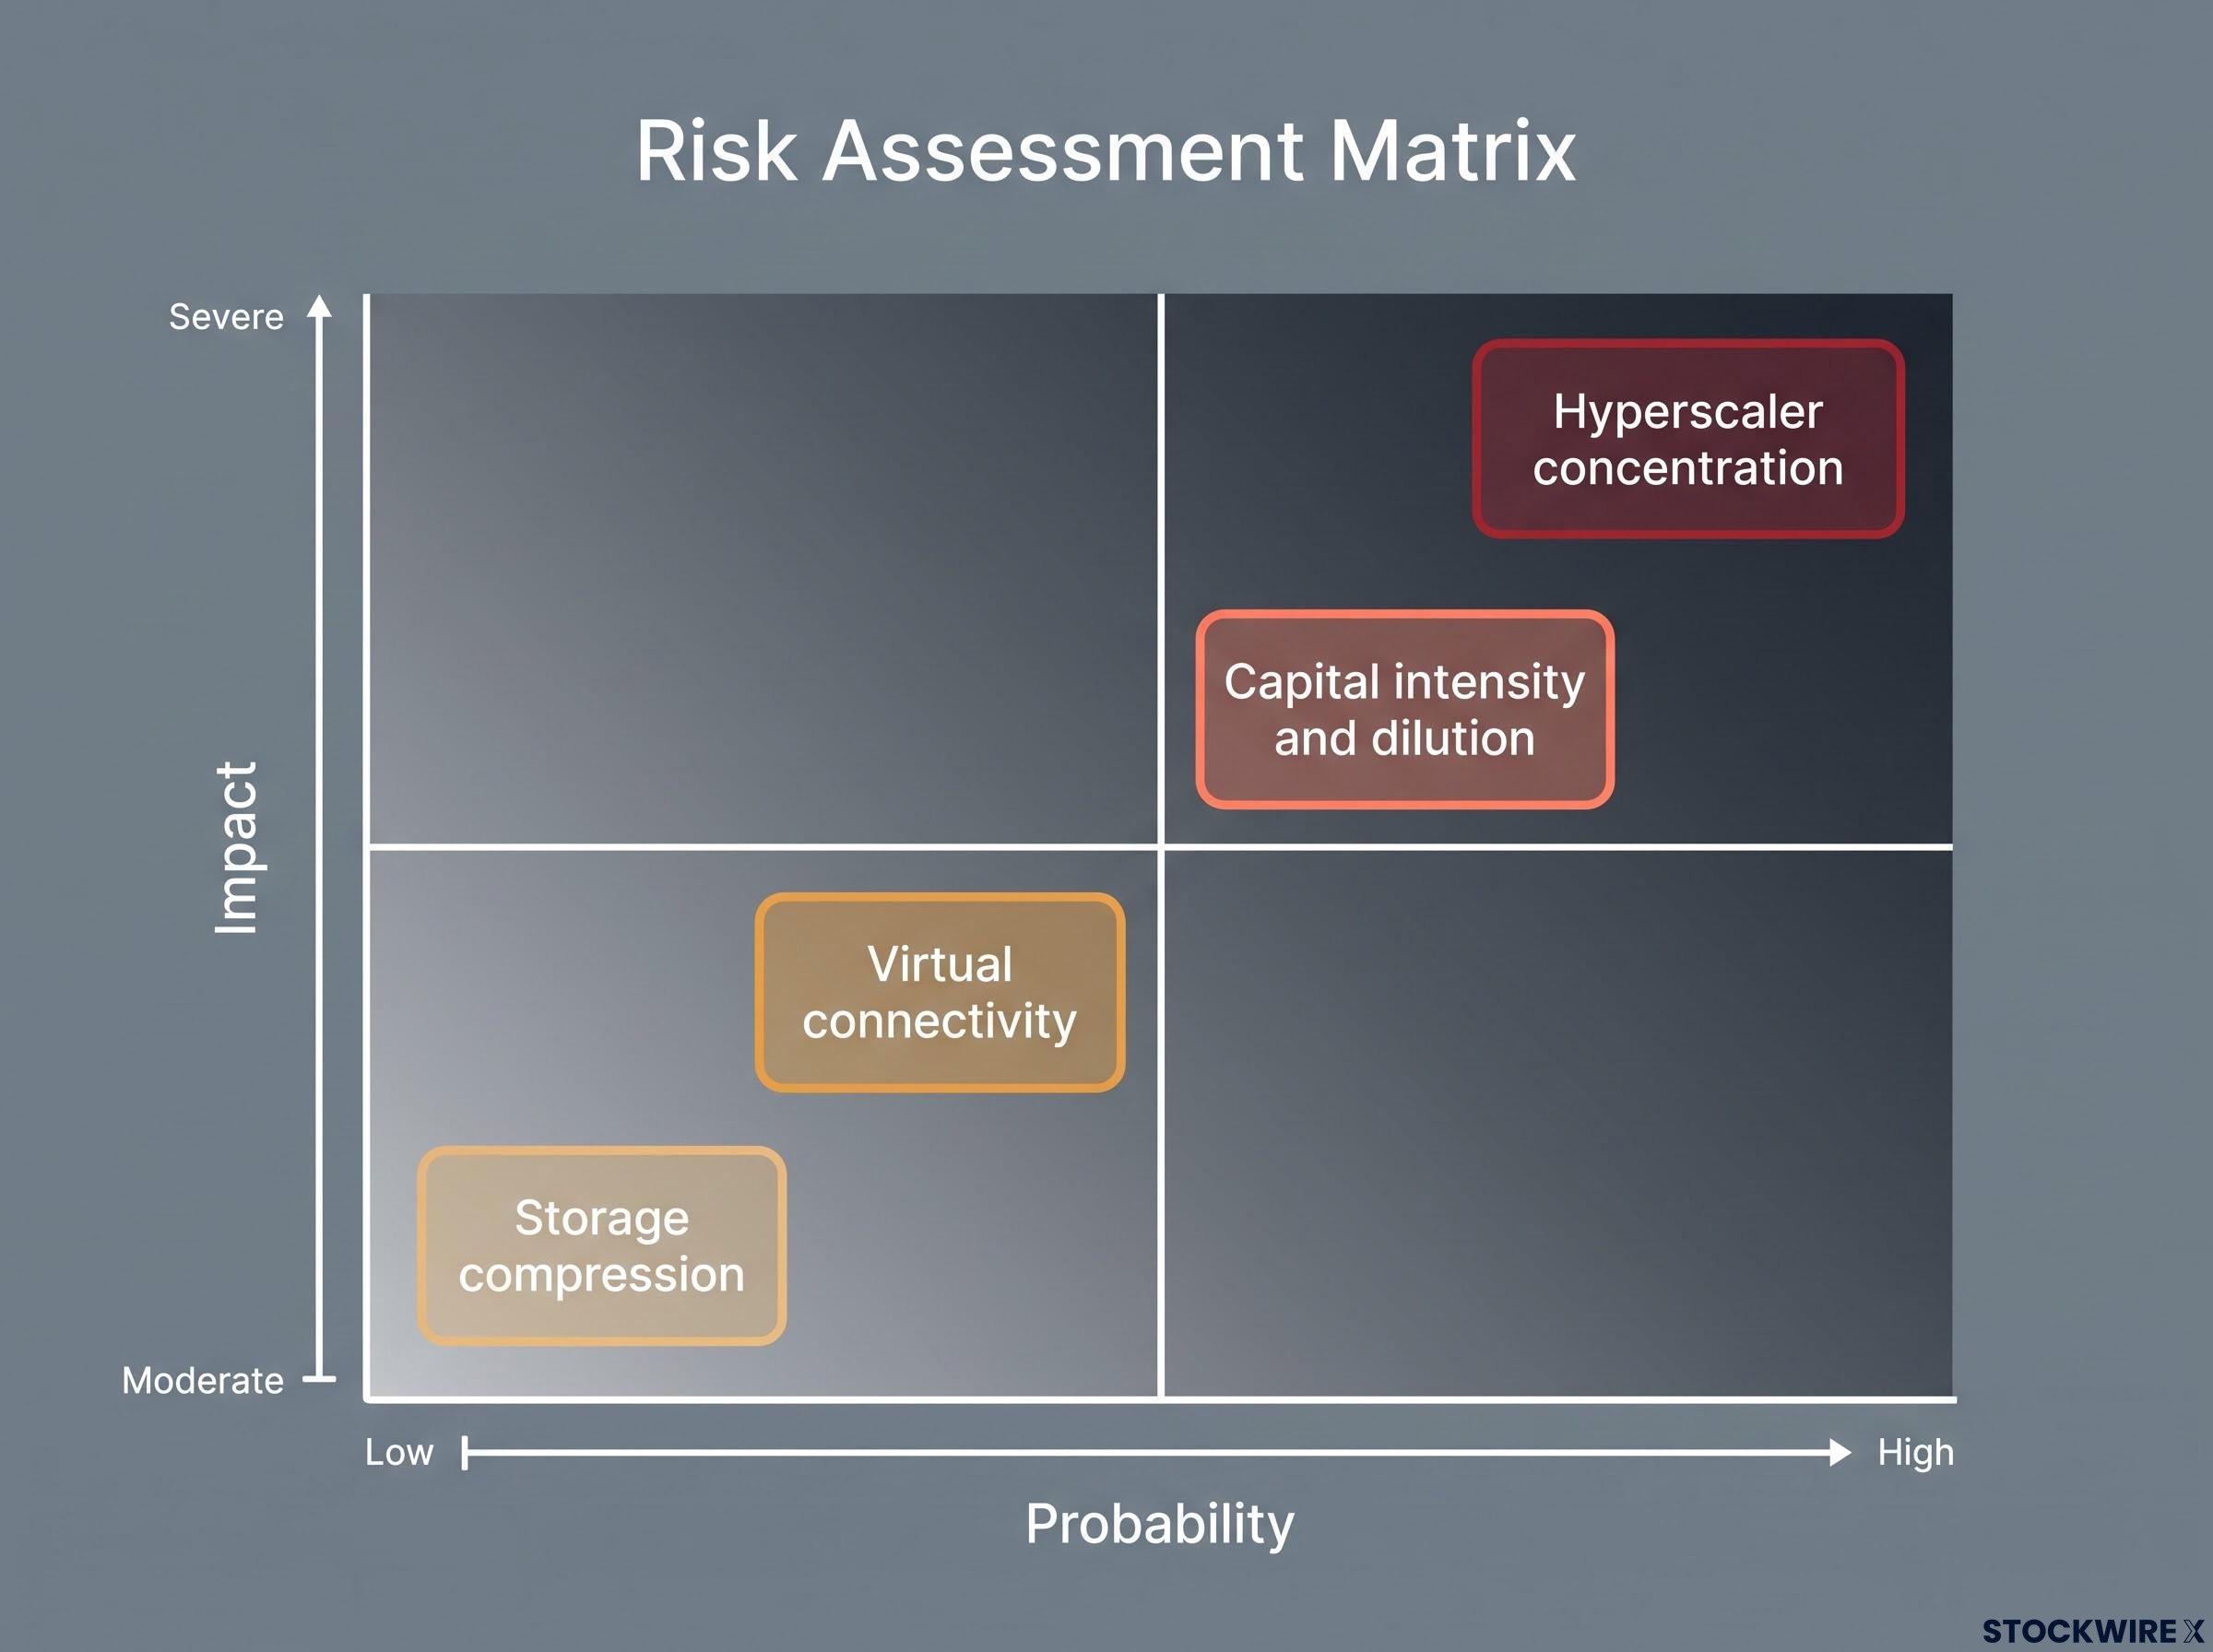
| Risk | Trigger Condition | Probability | Impact |
|---|---|---|---|
| Hyperscaler concentration | Major hyperscaler shifts to proprietary campuses | Medium-High | Severe: revenue and utilisation compression |
| Capital intensity and dilution | Demand softens or ramp delays extend funding cycle | Medium | High: per-share value erosion |
| Virtual connectivity | Software-defined networking reduces need for physical colocation | Medium (longer horizon) | Moderate: caps interconnection revenue upside |
| Storage compression | Storage density advances reduce tenant rack footprint | Low-Medium | Moderate: underutilised capacity, compressed yields |
Virtual connectivity and storage compression as slow-burn risks
These two risks operate on a longer time horizon than concentration or funding risk, but both can cap the upside of the interconnection revenue line. As software-defined networking and cloud-native on-ramp technologies mature, enterprises are increasingly able to stitch together multi-cloud environments without relying on a physical colocation hub, a shift that would progressively weaken demand for high-margin cross-connects. Separately, ongoing improvements in storage density technology may allow tenants to house the same workloads in a smaller rack footprint, which could leave NextDC carrying underutilised floor space even as overall AI adoption expands.
Neither may fully materialise, but the probability of partial materialisation is high enough that a valuation model ignoring them is optimistic by construction. These are real-option risks: they shape the ceiling of what the bull case can deliver.
Competitive supply risk reinforces the picture. Global entrants including Equinix and Digital Realty are targeting Australia, and in capital-intensive sectors, simultaneous build-outs by multiple players have historically produced oversupply, slower utilisation ramps, and weaker yields at project completion.
Valuation, entry discipline, and what to monitor if you hold
Valuation is a central part of the bear case. One detailed analysis estimates intrinsic value at approximately A$8.26, compared with the late August 2026 trading range of approximately A$13.80-13.87 (this estimate is sourced from external analysis and should be treated as directional, not independently verified). Some analysts have suggested materially lower entry ranges of approximately A$9.50-11.50 to compensate for uncertainty, though these figures are similarly directional.
The gap between trading price and estimated intrinsic value highlights the premium embedded in the stock. If the intrinsic value estimate is directionally correct, the market is pricing in a degree of future success that leaves limited margin of safety given the no-moat rating and the J-curve cash-flow profile extending through at least the early 2030s.
The entry-price question is direct: the J-curve profile and no-moat rating mean that a margin of safety is not optional. It is the difference between a sound infrastructure bet and a momentum trade. For investors who hold or are considering entry, five monitoring signals matter most:
Demanding a margin of safety in an inflationary rate environment carries additional weight when the asset in question has a J-curve cash-flow profile, because higher-for-longer interest rates compound the cost of the extended negative free-cash-flow period that precedes the return phase.
- Hyperscaler share of revenue and contracted capacity: track whether major cloud providers are redirecting investment toward their own dedicated facilities rather than third-party colocation.
- Net debt, funding mix, and per-share dilution from capital raises, as the capex programme accelerates through FY27 and beyond.
- Utilisation and pricing trends as new facilities are commissioned, especially in markets seeing new entrants.
- Interconnection revenue growth relative to basic colocation, as a proxy for whether network-effect value is compounding.
- FY27-FY28 billing conversion rate against the 565 MW forward order book, the most direct test of whether the contracted pipeline is converting on schedule.
A reader considering NextDC should understand that this is not a passive AI infrastructure play. It is an active bet on execution, entry timing, and monitoring discipline. The difference between a good outcome and a poor one often comes down to the price paid and the signals watched rather than the headline growth trajectory.
What the bull and bear cases require to be right
The bull and bear cases each depend on specific conditions, and framing them explicitly is more useful than a single verdict for a stock this layered.
| Bull Case Requires | Bear Case Requires |
|---|---|
| AI and hybrid cloud demand remains robust through FY30 | Demand softens or hyperscalers internalise workloads within proprietary campuses |
| Hyperscalers continue favouring neutral connectivity for enterprise workloads | Competition intensifies and pricing softens across Australian markets |
| Funding and execution navigate capex cycle without excessive dilution | ROIC remains persistently below cost of capital |
| Network effects compound as interconnection density grows | Software-defined networking and improving storage density progressively reduce the need for physical colocation |
| Entry price provides adequate margin of safety | J-curve extends further than modelled, straining the funding model |
The 565 MW forward order book is the single most important variable. If conversion tracks to plan through FY27-FY30, the bull case has quantified support. If it slips, the funding model comes under pressure and the no-moat rating becomes the dominant framing.
Global operators have so far made shallower inroads into Australia than into comparable developed markets, and that relative under-penetration represents a genuine structural opening for NextDC. It is, however, an opening that well-capitalised international competitors are actively moving to close. NextDC is a leveraged play on AI and hybrid cloud adoption, not a GDP-plus infrastructure asset, and treating it as the former demands a disciplined approach to entry price, monitoring, and risk tolerance.
A disciplined framework for a high-conviction, high-risk stock
Four tensions define this investment case: scarce sovereign infrastructure versus a no-moat rating; strong contracted revenue visibility versus capital-intensity and dilution risk; genuine AI tailwinds versus hyperscaler concentration; and network-effect upside versus virtual connectivity as a structural ceiling on that upside.
The FY27 guidance step-up, with net revenue of A$615-640 million and EBITDA of A$385-410 million, is the first major inflection point where the execution story either validates or challenges the thesis. The 565 MW forward order book converting progressively through FY27-FY30 remains the clearest near-term test of whether the bull case is tracking.
This stock suits a specific type of investor:
- Those who can tolerate high volatility and execution risk over a multi-year horizon.
- Those prepared to be disciplined on entry price, recognising that the no-moat rating means paying a premium relies on growth delivery, not durable competitive advantage.
- Those who will actively monitor the five signals identified above rather than treating the position as a passive AI proxy.
- Those whose portfolio construction can absorb the possibility that the bear case conditions partially materialise without forcing a distressed exit.
The quality of an investment decision in NextDC depends almost entirely on the rigour of the investor’s process, not on the attractiveness of the AI theme. The evidence supports a stock that can deliver strong returns under the right conditions, at the right price, with active monitoring. It does not support a set-and-forget allocation built on narrative momentum.
For investors exploring broader exposure to the Australian data centre build cycle beyond a single operator position, our dedicated guide to ASX picks-and-shovels beneficiaries covers the electrical infrastructure stocks capturing the A$26 billion construction wave, with forward earnings visibility independently verified by hyperscaler order books.
This article is for informational purposes only and should not be considered financial advice. Investors should conduct their own research and consult with financial professionals before making investment decisions. Past performance does not guarantee future results. Financial projections are subject to market conditions and various risk factors. Valuation estimates and analyst price targets cited in this article are sourced from external analysis and have not been independently verified; they should be treated as directional rather than definitive.