NextDC has 740 MW of contracted utilisation, a 565 MW forward order book tied to hyperscale and AI workloads, and an Asia-Pacific expansion pipeline that stretches from Kuala Lumpur to Tokyo. The structural tailwind is visible. So is the capital bill: A$3.4 billion in FY26 capex already spent, with A$5.25-5.75 billion guided for FY27.
That combination is the puzzle. Morningstar analyst Dan Baker assigns a no-moat rating, contending that the business is unlikely to generate returns on invested capital that reliably surpass its cost of capital across the coming decade. Multiple independent analyses flag valuation stretch and leverage as reasons the bull case can fail even if every megawatt of demand materialises on schedule.
The AI infrastructure story is real. Whether it justifies the current price, the funding commitment, and the competitive dynamics surrounding it requires a different kind of evidence. Here is a structured framework for holding both the bull and bear cases simultaneously, understanding where the compounding risks sit, and identifying which specific metrics tell you which scenario is playing out.
What NextDC actually sells, and why the business model creates both opportunity and exposure
NextDC is a specialist colocation data centre operator. Its customers, ranging from enterprises to global cloud providers, place their own servers inside NextDC’s facilities and pay for the infrastructure around them rather than building it themselves.
Three revenue categories drive the business:
- Space: Physical floor area within secured, climate-controlled facilities where customers install their own equipment
- Power: Electricity delivery at contracted capacity levels, measured in megawatts, which scales directly with the density of customer workloads
- Interconnection: High-speed physical connections between tenants and cloud on-ramps inside the same facility, carrying higher margins and creating switching friction that ties customers into the ecosystem
Interconnection is the strategically important piece. When an enterprise connects to multiple cloud providers inside a single NextDC facility, the cost and complexity of relocating that web of connections creates stickiness that space and power alone do not.
Where the growth numbers sit
The company reported record pro forma contracted utilisation of 740 MW in FY26, with a 565 MW forward order book weighted toward hyperscale and AI workloads. FY26 capex reached A$3.4 billion, and FY27 guidance sits at A$5.25-5.75 billion.
The S4 capacity milestone at Western Sydney, which added 250MW of contracted capacity and pushed pro forma contracted utilisation to 667MW in April 2026, is the single event most responsible for the step-change in NextDC’s forward order book and the associated capital commitment that now defines the J-curve investors are pricing.
The gap between contracted megawatts and billed, cash-generating capacity is where execution risk lives. Contracted utilisation represents commitments; revenue arrives only when that capacity is built, powered, and occupied. Every financial projection from NextDC or covering analysts rests on the assumption that conversion happens on schedule, and the capital committed to make it happen is already flowing.
When big ASX news breaks, our subscribers know first
The structural tailwinds are real, and mostly already priced in
The demand story has substance. AI and GPU-dense workloads are driving multi-year visibility for powered capacity in Australia. Sovereign data residency requirements benefit domestic operators over offshore alternatives. Hybrid cloud architectures mean enterprises must maintain simultaneous connections to several cloud providers at once, and a co-located facility is generally the most practical environment for doing so efficiently.
Global capacity forecasts have been revised sharply upward, with Goldman Sachs nearly doubling its 2030 estimate to 217 GW in July 2026 and projecting worldwide data centre power consumption 170% higher in 2030 than in 2025; the Jevons paradox applied to compute means efficiency gains are accelerating total demand rather than reducing it, which supports the structural case but also raises the question of how much of that demand lands in Australian colocation rather than hyperscaler-owned facilities.
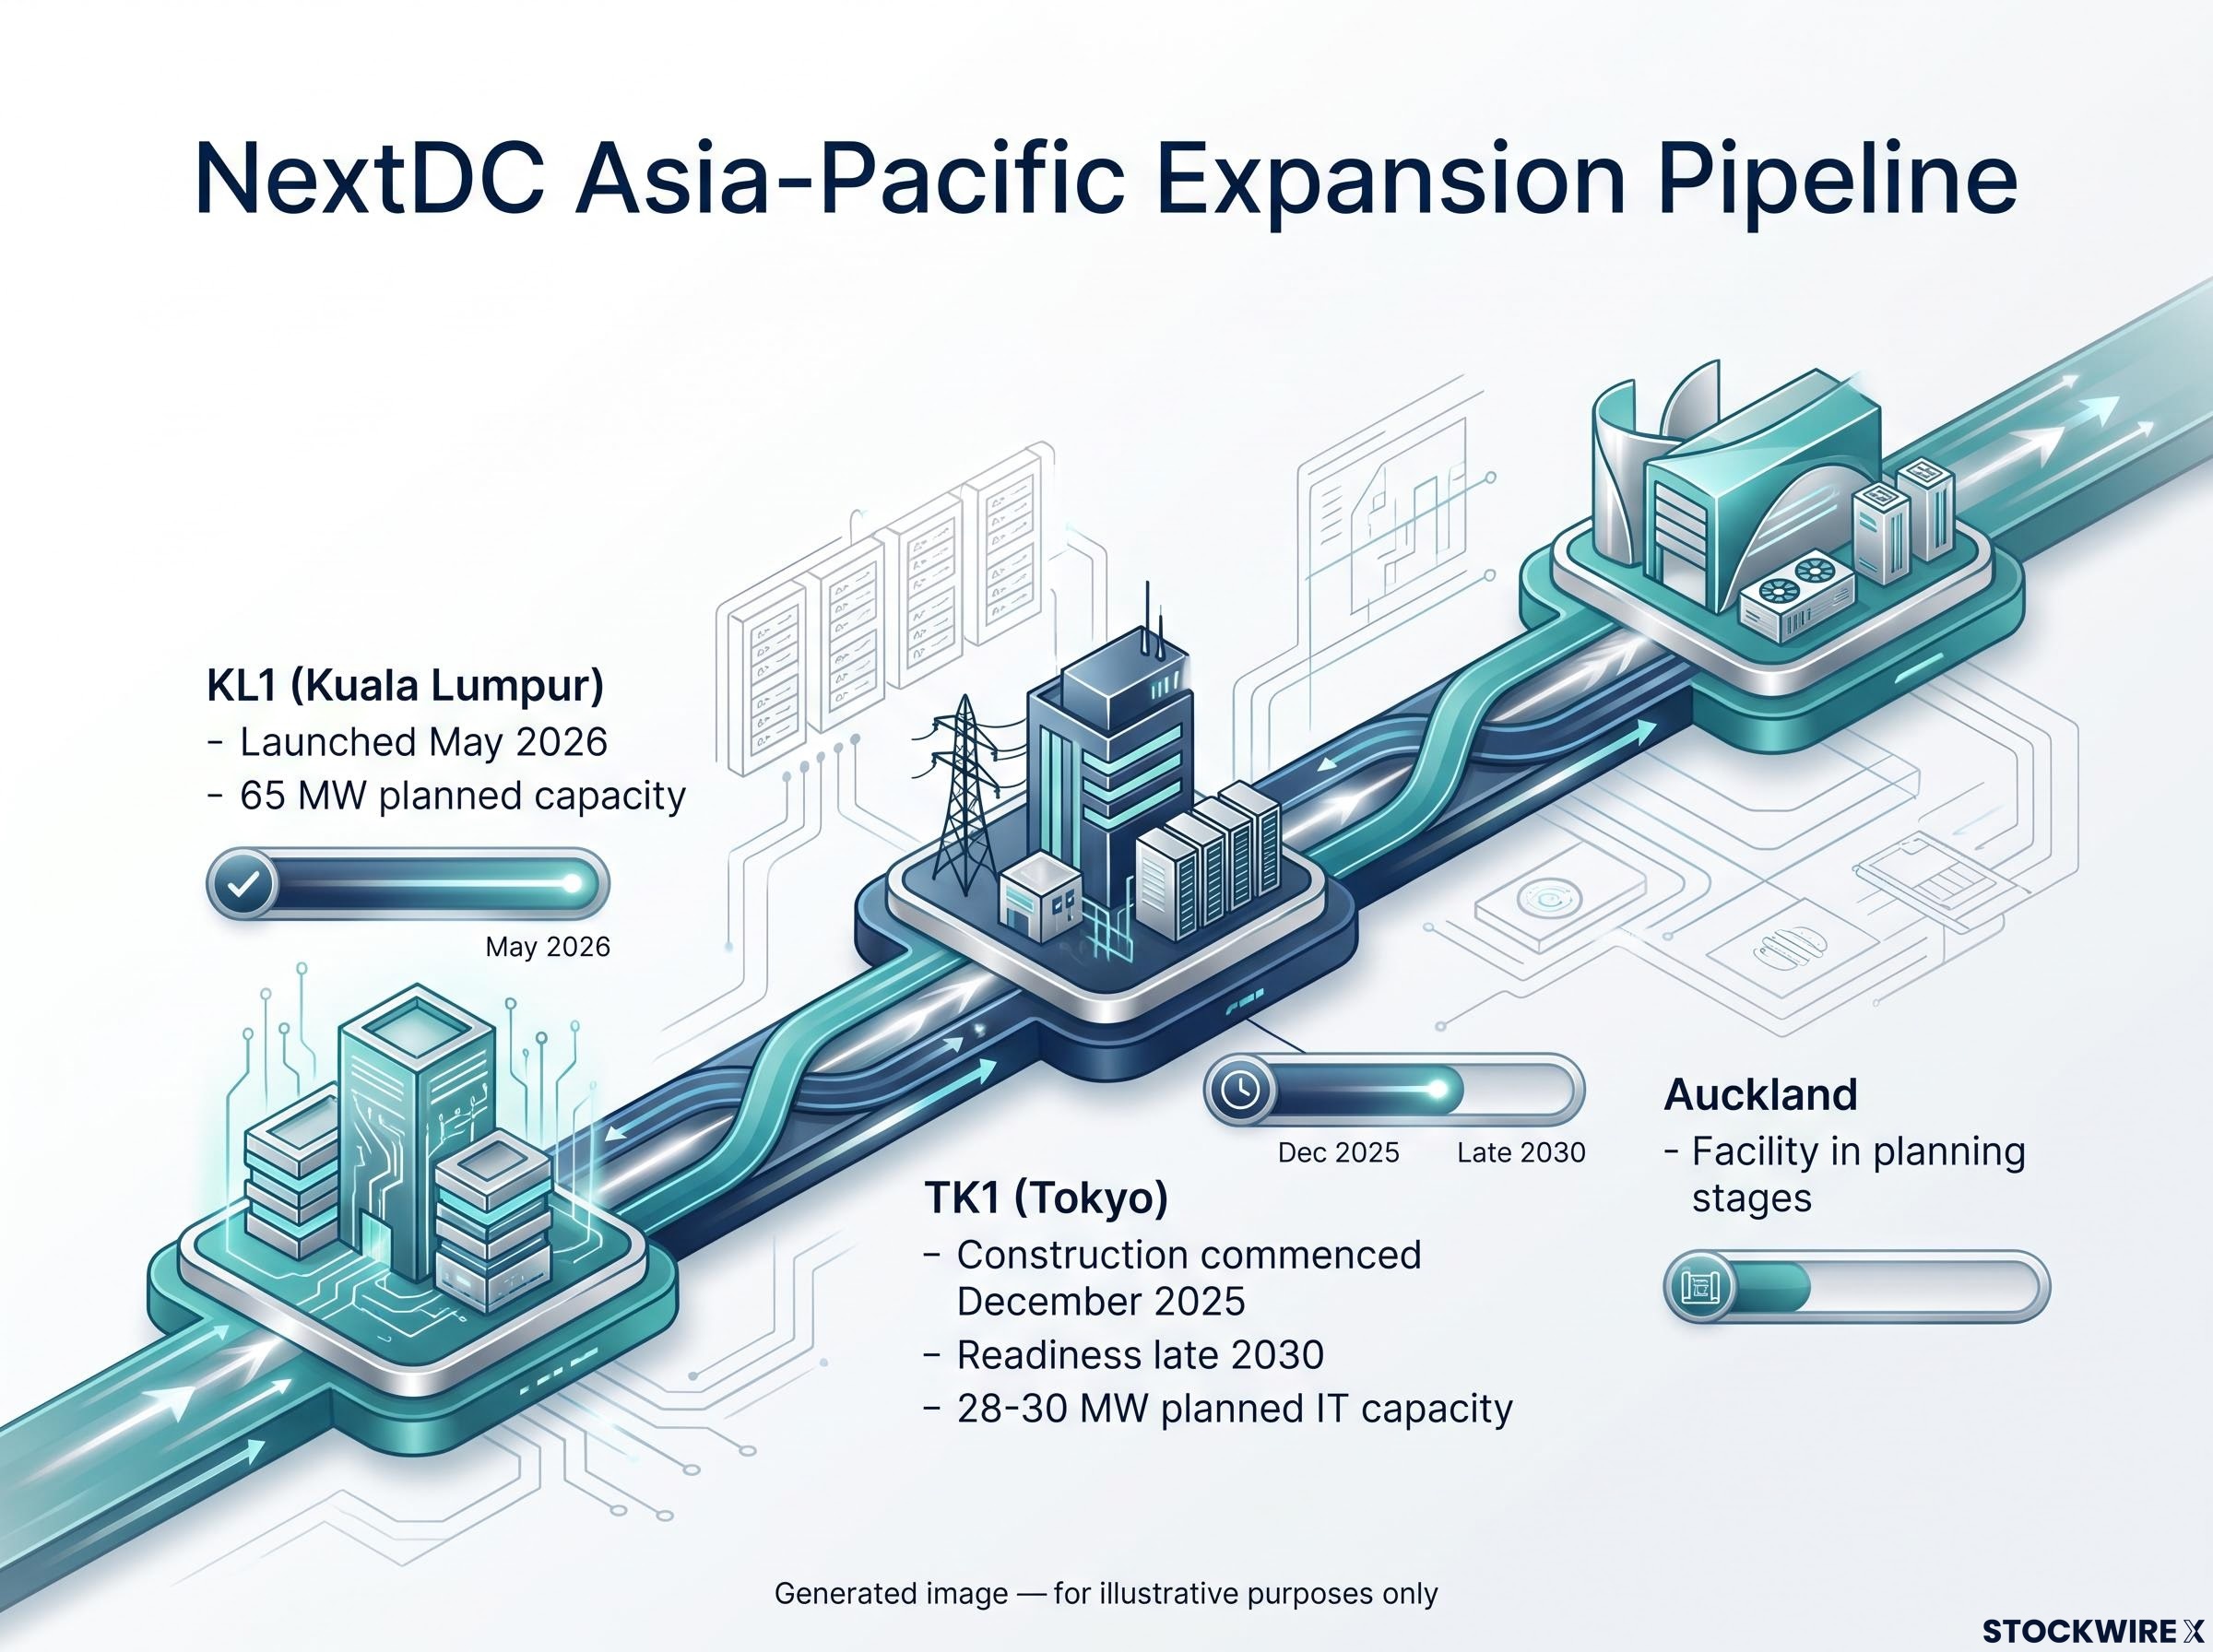
NextDC’s geographic expansion adds to the narrative. KL1 in Kuala Lumpur launched in May 2026 with 65 MW of planned capacity at full build-out. TK1 in Tokyo commenced construction in December 2025, targeting operational readiness in late 2030 with approximately 28-30 MW of planned IT capacity. An Auckland facility is in planning.
- KL1 (Kuala Lumpur): Launched May 2026, 65 MW planned capacity
- TK1 (Tokyo): Construction commenced December 2025, approximately 28-30 MW planned IT capacity, targeted readiness late 2030
- Auckland: Facility in planning stages
Multiple analyses frame the stock as a direct play on AI infrastructure buildout, citing scarce powered capacity and strong contracted growth. That framing is accurate as far as it goes.
Analyst commentary has framed NextDC as a “high-beta, momentum-driven AI play,” making it vulnerable to reversals in tech sentiment or a broader de-rating of long-duration growth names.
The problem is not the thesis. It is the price. One detailed intrinsic-value model (flagged as unverified in the research base, and treated here with appropriate caution) suggests approximately 40% downside to fair value, warning that the market may be pricing visibility beyond a five to seven year competitive-advantage window. Whether that specific figure holds up to scrutiny, the directional argument is echoed across multiple independent assessments: the structural growth narrative appears substantially capitalised into the current share price.
For you, the practical implication is that the degree of conviction required to buy at current prices is substantially higher than the degree of conviction required to believe in AI infrastructure growth. The latter is already the consensus view.
The four risk categories that define the bear case
The bear case is not a list of worries. It is a taxonomy of structural vulnerabilities, and the risks interact in ways that a single-category reading obscures.
| Risk Category | Core Mechanism | Morningstar / Analyst View | Monitoring Signal |
|---|---|---|---|
| Technology and utilisation | Efficiency gains reduce per-workload capacity needs | No-moat assessment reflects scepticism that demand alone will push ROIC sustainably above WACC | Contracted MW growth versus guidance; utilisation trends on new builds |
| Customer concentration | Hyperscalers redirect demand to proprietary facilities | Analysts identify customer concentration as a material risk should major tenants alter their sourcing approach | Top-customer disclosures; hyperscaler-owned capacity announcements in Sydney or Melbourne |
| Virtual connectivity erosion | Software-defined networking reduces physical interconnection pricing power | Analysts warn that interconnection margins face sustained downward pressure over the long run | Interconnection revenue growth; customer pivot toward virtualised network solutions |
| Sector capital inflows | Abundant capital shifts tight capacity to oversupply | Morningstar points to the scale of planned new capacity as a primary basis for doubting that excess returns can be maintained | Competitor capacity announcements; Equinix and Digital Realty expansion in Australian markets |
Technology and capacity utilisation risk
AI workloads are driving near-term demand for high-power, high-density capacity. But future efficiency gains could leave parts of the asset base underutilised relative to assumptions that underpin a multi-billion-dollar build programme. This is a long-horizon risk operating against a business already locked into capital commitments.
Customer concentration and hyperscaler strategy
A significant share of NextDC’s revenue depends on major cloud providers that retain the option to build proprietary Australian facilities. The monitoring trigger is any announced hyperscaler-owned capacity in Sydney or Melbourne, which would signal a direct competitive response to the colocation model.
Hyperscaler cash flow constraints are tightening in ways that could affect NextDC’s anchor tenants directly: Barclays models point to more than $200 billion in debt issuance required to close the structural funding gap between 2026 and 2028, which means the largest customers underwriting NextDC’s forward order book are simultaneously managing their own capital discipline pressures.
Microsoft’s A$25 billion Australian data centre commitment, reported as the largest-ever investment by a global technology company in Australia, illustrates precisely the dual nature of hyperscaler capital: it validates AI infrastructure demand while simultaneously signalling that the largest tenants retain the capacity to internalise supply.
Virtual connectivity and interconnection economics
Software-defined networking and cloud-native network services allow logical connectivity without strict physical co-location. This is a margin-compression risk rather than a binary revenue loss, but it targets the highest-margin component of the business model.
Sector capital inflows and supply uncertainty
Infrastructure, private equity, and sovereign capital flowing into Australian data centres could shift Sydney and Melbourne from tight capacity to oversupply. Equinix operates 18 data centres across Sydney, Melbourne, Perth, Brisbane, Canberra, and Adelaide. Digital Realty maintains multiple strategic sites in Sydney and Melbourne. Morningstar identifies the volume of planned capacity additions as a principal reason to question whether above-average returns can persist over time.
Physical infrastructure bottlenecks, specifically grid access and power availability rather than software or silicon constraints, are the primary binding constraint on how quickly contracted megawatts convert to billed capacity across the Australian market, and AEMO’s formal identification of data centres as a structural demand driver adds regulatory weight to that assessment.
These four risks are not independent. A hyperscaler that redirects demand to its own facility simultaneously reduces contracted megawatts, weakens interconnection revenue, and undermines the valuation multiple. The bear case compounds in ways that a single-risk reading obscures.
How the financial structure amplifies every other risk
The capital-intensity profile is the mechanism through which every operational and competitive risk compounds. A business running FY26 capex of A$3.4 billion and guiding FY27 at A$5.25-5.75 billion has no financial cushion to absorb utilisation shortfalls, competitive pricing pressure, or execution delays without returning to capital markets.
| Financial Metric | Current Figure / Guidance | Investor Implication |
|---|---|---|
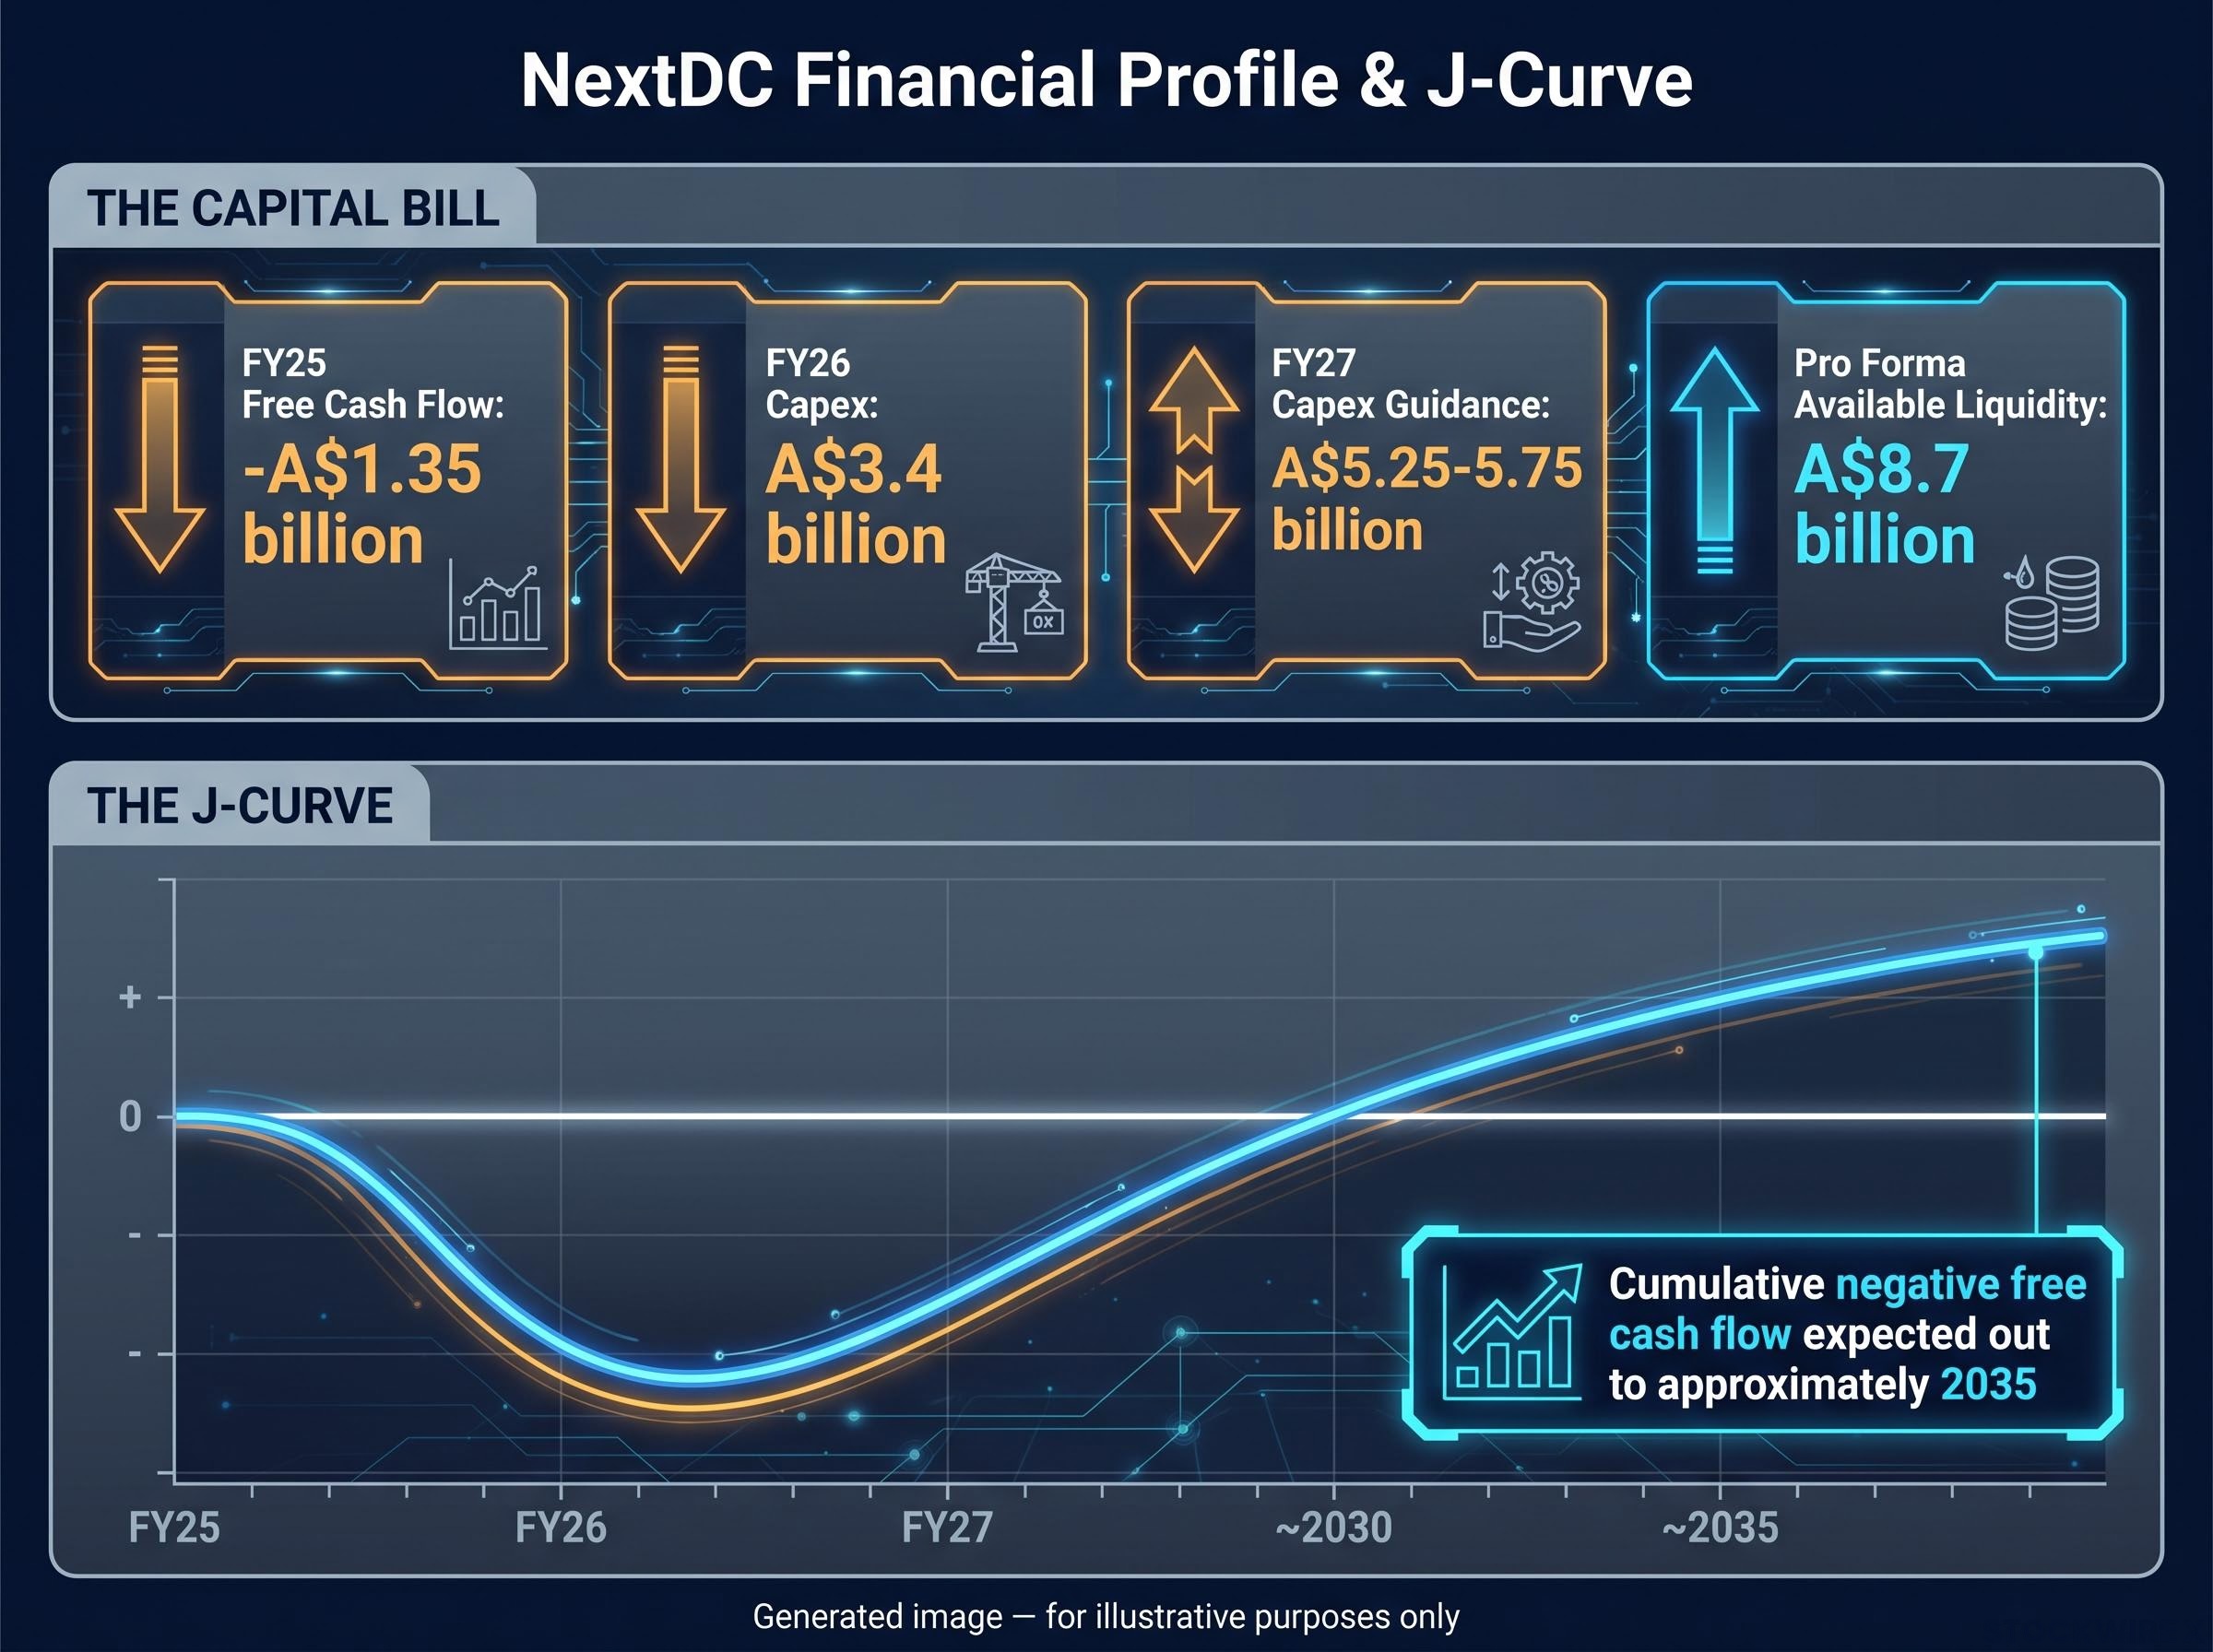
| FY25 free cash flow | Approximately -A$1.35 billion | Deep negative FCF confirms dependence on external funding |
| FY26 capex | A$3.4 billion | Capital commitment already deployed; returns depend on conversion timing |
| FY27 capex guidance | A$5.25-5.75 billion | Largest single-year spend in company history; execution risk peaks here |
| Pro forma available liquidity (30 June 2026) | Approximately A$8.7 billion | Buffer appears large but must fund multi-year build; sensitive to credit conditions |
NextDC is characterised as an infrastructure “J-curve” story, with cumulative negative free cash flow expected out to approximately 2035 as capacity is built and gradually monetised. Under some scenarios, the business runs cumulative negative cash flow deep into the 2030s.
Pro forma available liquidity of approximately A$8.7 billion (comprising A$876 million in cash plus undrawn senior debt facilities and hybrid tranches) provides the buffer. But that buffer must fund a build programme stretching years into the future, and its adequacy is sensitive to credit-market conditions, interest rates, and risk appetite.
For you as an investor, the implication is that NextDC’s risk profile is not merely about whether AI demand materialises. It is about whether demand materialises on a schedule that aligns with the capital structure’s tolerance. Misalignment between demand timing and funding windows is a realistic scenario, not a tail risk. Equity dilution and refinancing risk are named investor risks that can affect the share price independently of whether the demand story ultimately proves correct.
This article is for informational purposes only and should not be considered financial advice. Investors should conduct their own research and consult with financial professionals before making investment decisions.
Building a decision framework: position sizing, entry discipline, and what to monitor
If you are considering NextDC, three portfolio positioning principles apply in sequence:
- Position sizing: Treat the stock as a high-beta, high-duration AI-infrastructure exposure rather than a core defensive holding. The wide distribution of outcomes, skewed toward sharp downside in adverse scenarios, warrants conservative sizing relative to total portfolio value.
- Entry discipline: The structural growth narrative appears substantially capitalised into the price. Analyst commentary recommends patience, with preferred buy ranges meaningfully below prevailing market levels. The margin-of-safety question is as important as the thesis quality question.
- Margin of safety: Independent valuation work consistently flags limited buffer against execution or macro shocks at current prices. Demanding a discount to fair-value estimates before establishing or adding to a position is a discipline, not a timing call.
The monitoring framework below maps directly to the risk categories identified earlier. Each signal category corresponds to a specific vulnerability, so tracking them correctly means you are continuously updating your bear-case probability rather than waiting for a catalyst.
| Signal Category | What to Monitor | Why It Matters |
|---|---|---|
| Demand and utilisation | Contracted MW growth versus the 565 MW forward order book; utilisation on new builds | Validates or challenges the core revenue assumption |
| Hyperscaler and customer behaviour | Top-customer concentration disclosures; hyperscaler-owned capacity announcements in Sydney or Melbourne | Signals whether anchor tenants are building alternatives |
| Interconnection economics | Interconnection revenue growth, pricing trends, customer pivot toward virtualised solutions | Tracks the highest-margin revenue line for compression |
| Funding and leverage | Drawdown against ~A$8.7 billion liquidity; debt raisings; equity placements; credit-spread movements | Measures how fast the financial buffer is being consumed |
| Construction and execution | Milestone delivery on Sydney and Melbourne campuses; KL1 and TK1 ramp-up; cost overruns or timeline revisions | Execution delays feed directly into funding risk and sentiment |
Where the investment case stands for investors willing to sit with complexity
The structural AI and cloud tailwinds are genuine and multi-year. The geographic footprint and land bank create practical barriers to entry. The 565 MW forward order book gives demand visibility that most infrastructure operators would envy.
None of that resolves the core tension. The financial architecture, with FY27 capex guidance of A$5.25-5.75 billion and cumulative negative free cash flow projected out to approximately 2035, means the risk-adjusted case depends heavily on entry price, position size, and tolerance for a long, volatile J-curve. Morningstar’s no-moat rating stands as an independent counterpoint to the bull narrative, one worth revisiting as competitive dynamics evolve.
The stock is appropriate for investors who accept:
- High volatility as a structural feature, not a temporary condition
- Long payback periods stretching deep into the 2030s before cumulative free cash flow turns positive
- Meaningful execution and funding risk as the trade-off for structural AI and cloud exposure
It is not appropriate as a core defensive or income holding.
The next two to three years of delivery on Sydney and Melbourne campuses, KL1 ramp-up, and TK1 construction progress will either validate or challenge the current valuation thesis. That makes this a monitoring-intensive position regardless of conviction level. The framework above gives you the specific signals and the interpretive logic to identify regime shifts before they fully appear in reported earnings.
Past performance does not guarantee future results. Financial projections are subject to market conditions and various risk factors.