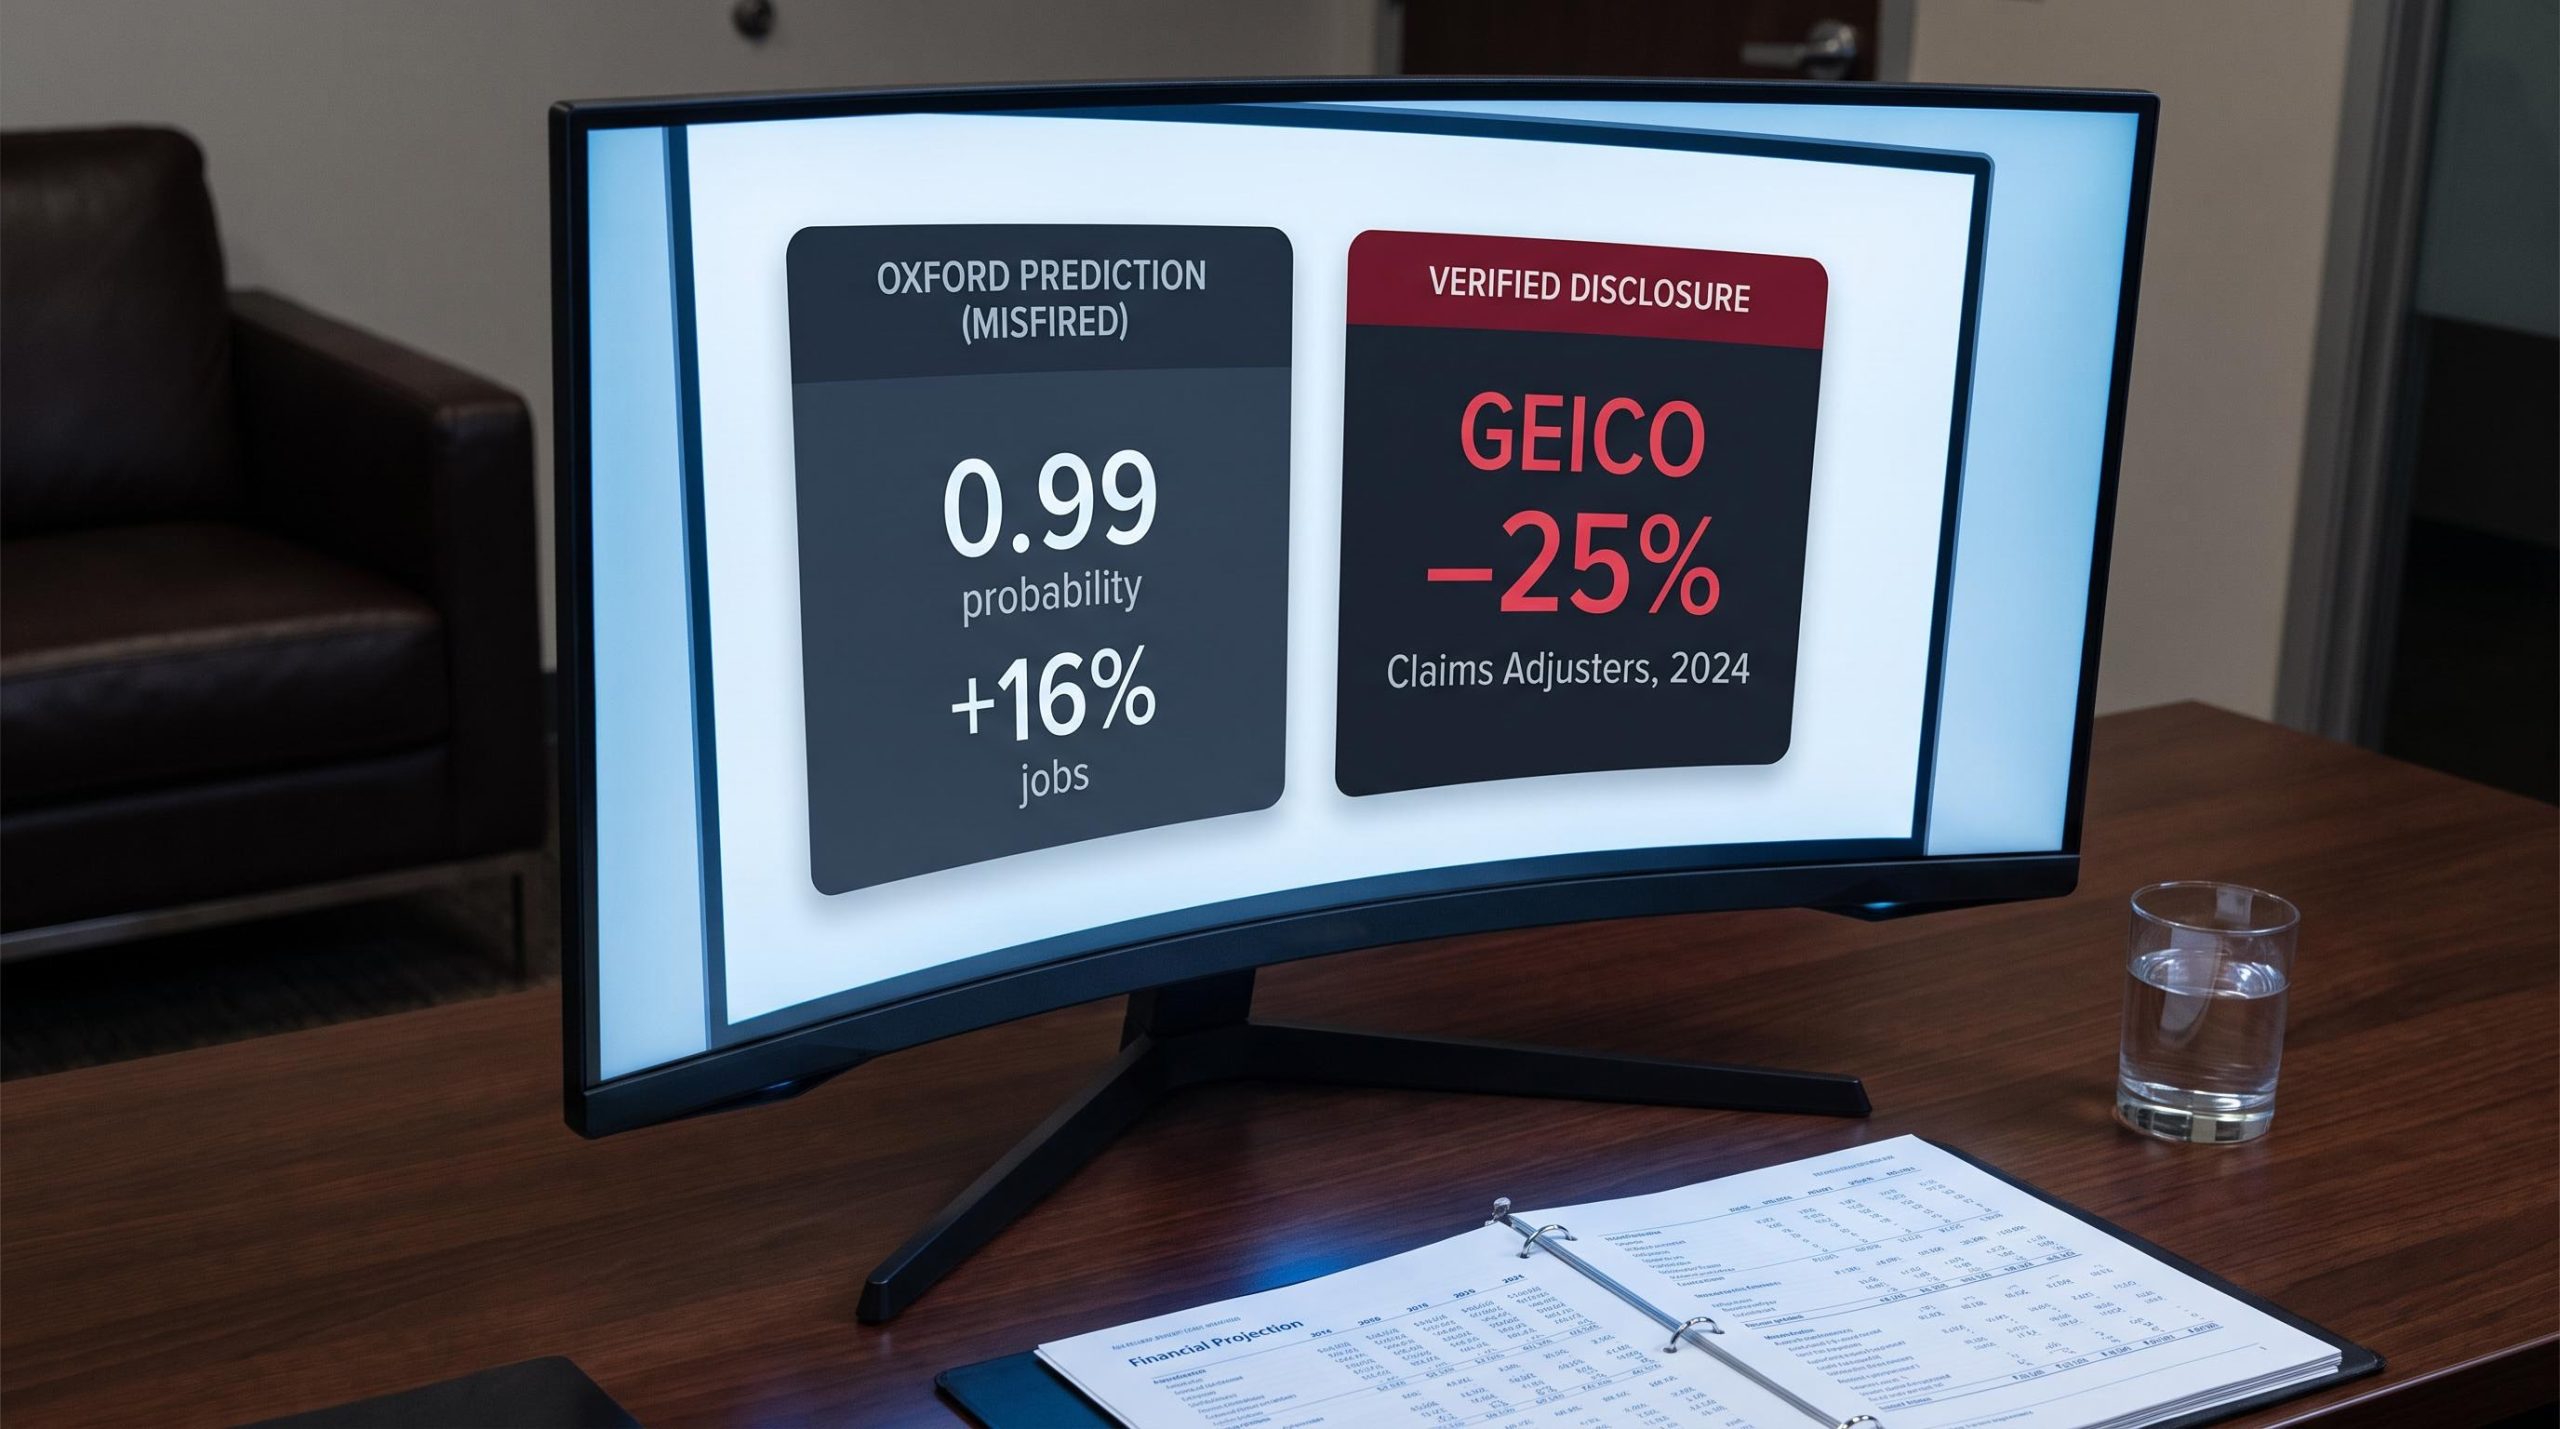
Frey and Osborne’s “The Future of Employment,” released by Oxford University in 2013, assigned insurance underwriters a computerisation probability of 0.99, the highest score in the entire study and a figure that became the landmark data point in automation research. That score implied underwriters were the U.S. occupation most exposed to being replaced by machines. Over the subsequent eight years, the occupation added jobs, with employment rising 16%.
In 2024, GEICO disclosed a 25% reduction in entry-level claims adjuster positions. That single corporate filing carried more practical signal than years of susceptibility modelling: a named firm, a named function, a named scale, and a named year, none of which any predictive ranking had surfaced in advance.
The question for investors is not whether automation is real. It is which signals deserve weight when automation risk is raised about a holding you own, and which belong in the background. Here is a practical framework for telling those two categories apart, built from three occupations where the evidence is already in.
How a 99% automation probability produced 16% job growth
The study behind that 0.99 figure, Frey and Osborne’s “The Future of Employment” (Oxford University, 2013), used a machine-learning classifier trained on a small set of manually labelled occupations and extended its predictions across 702 U.S. jobs. Each occupation received a “computerisation probability,” a score estimating the likelihood that technology could perform the job’s core tasks. A computerisation probability is a model’s estimate of how automatable an occupation’s task bundle is, expressed as a number between zero and one.
Frey and Osborne’s Future of Employment study applied a machine-learning classifier to 702 U.S. occupations, producing computerisation probability scores that became the most widely cited automation risk rankings of the decade, yet its highest-confidence predictions, including the 0.99 score for underwriters, diverged sharply from observed labour market outcomes over the following ten years.
Insurance underwriters topped the list. The model’s logic was sound in narrow terms: underwriting involves structured data assessment, rule application, and risk scoring, all of which pattern-recognition software handles well. The score was not arbitrary. It reflected a genuine reading of the task structure.
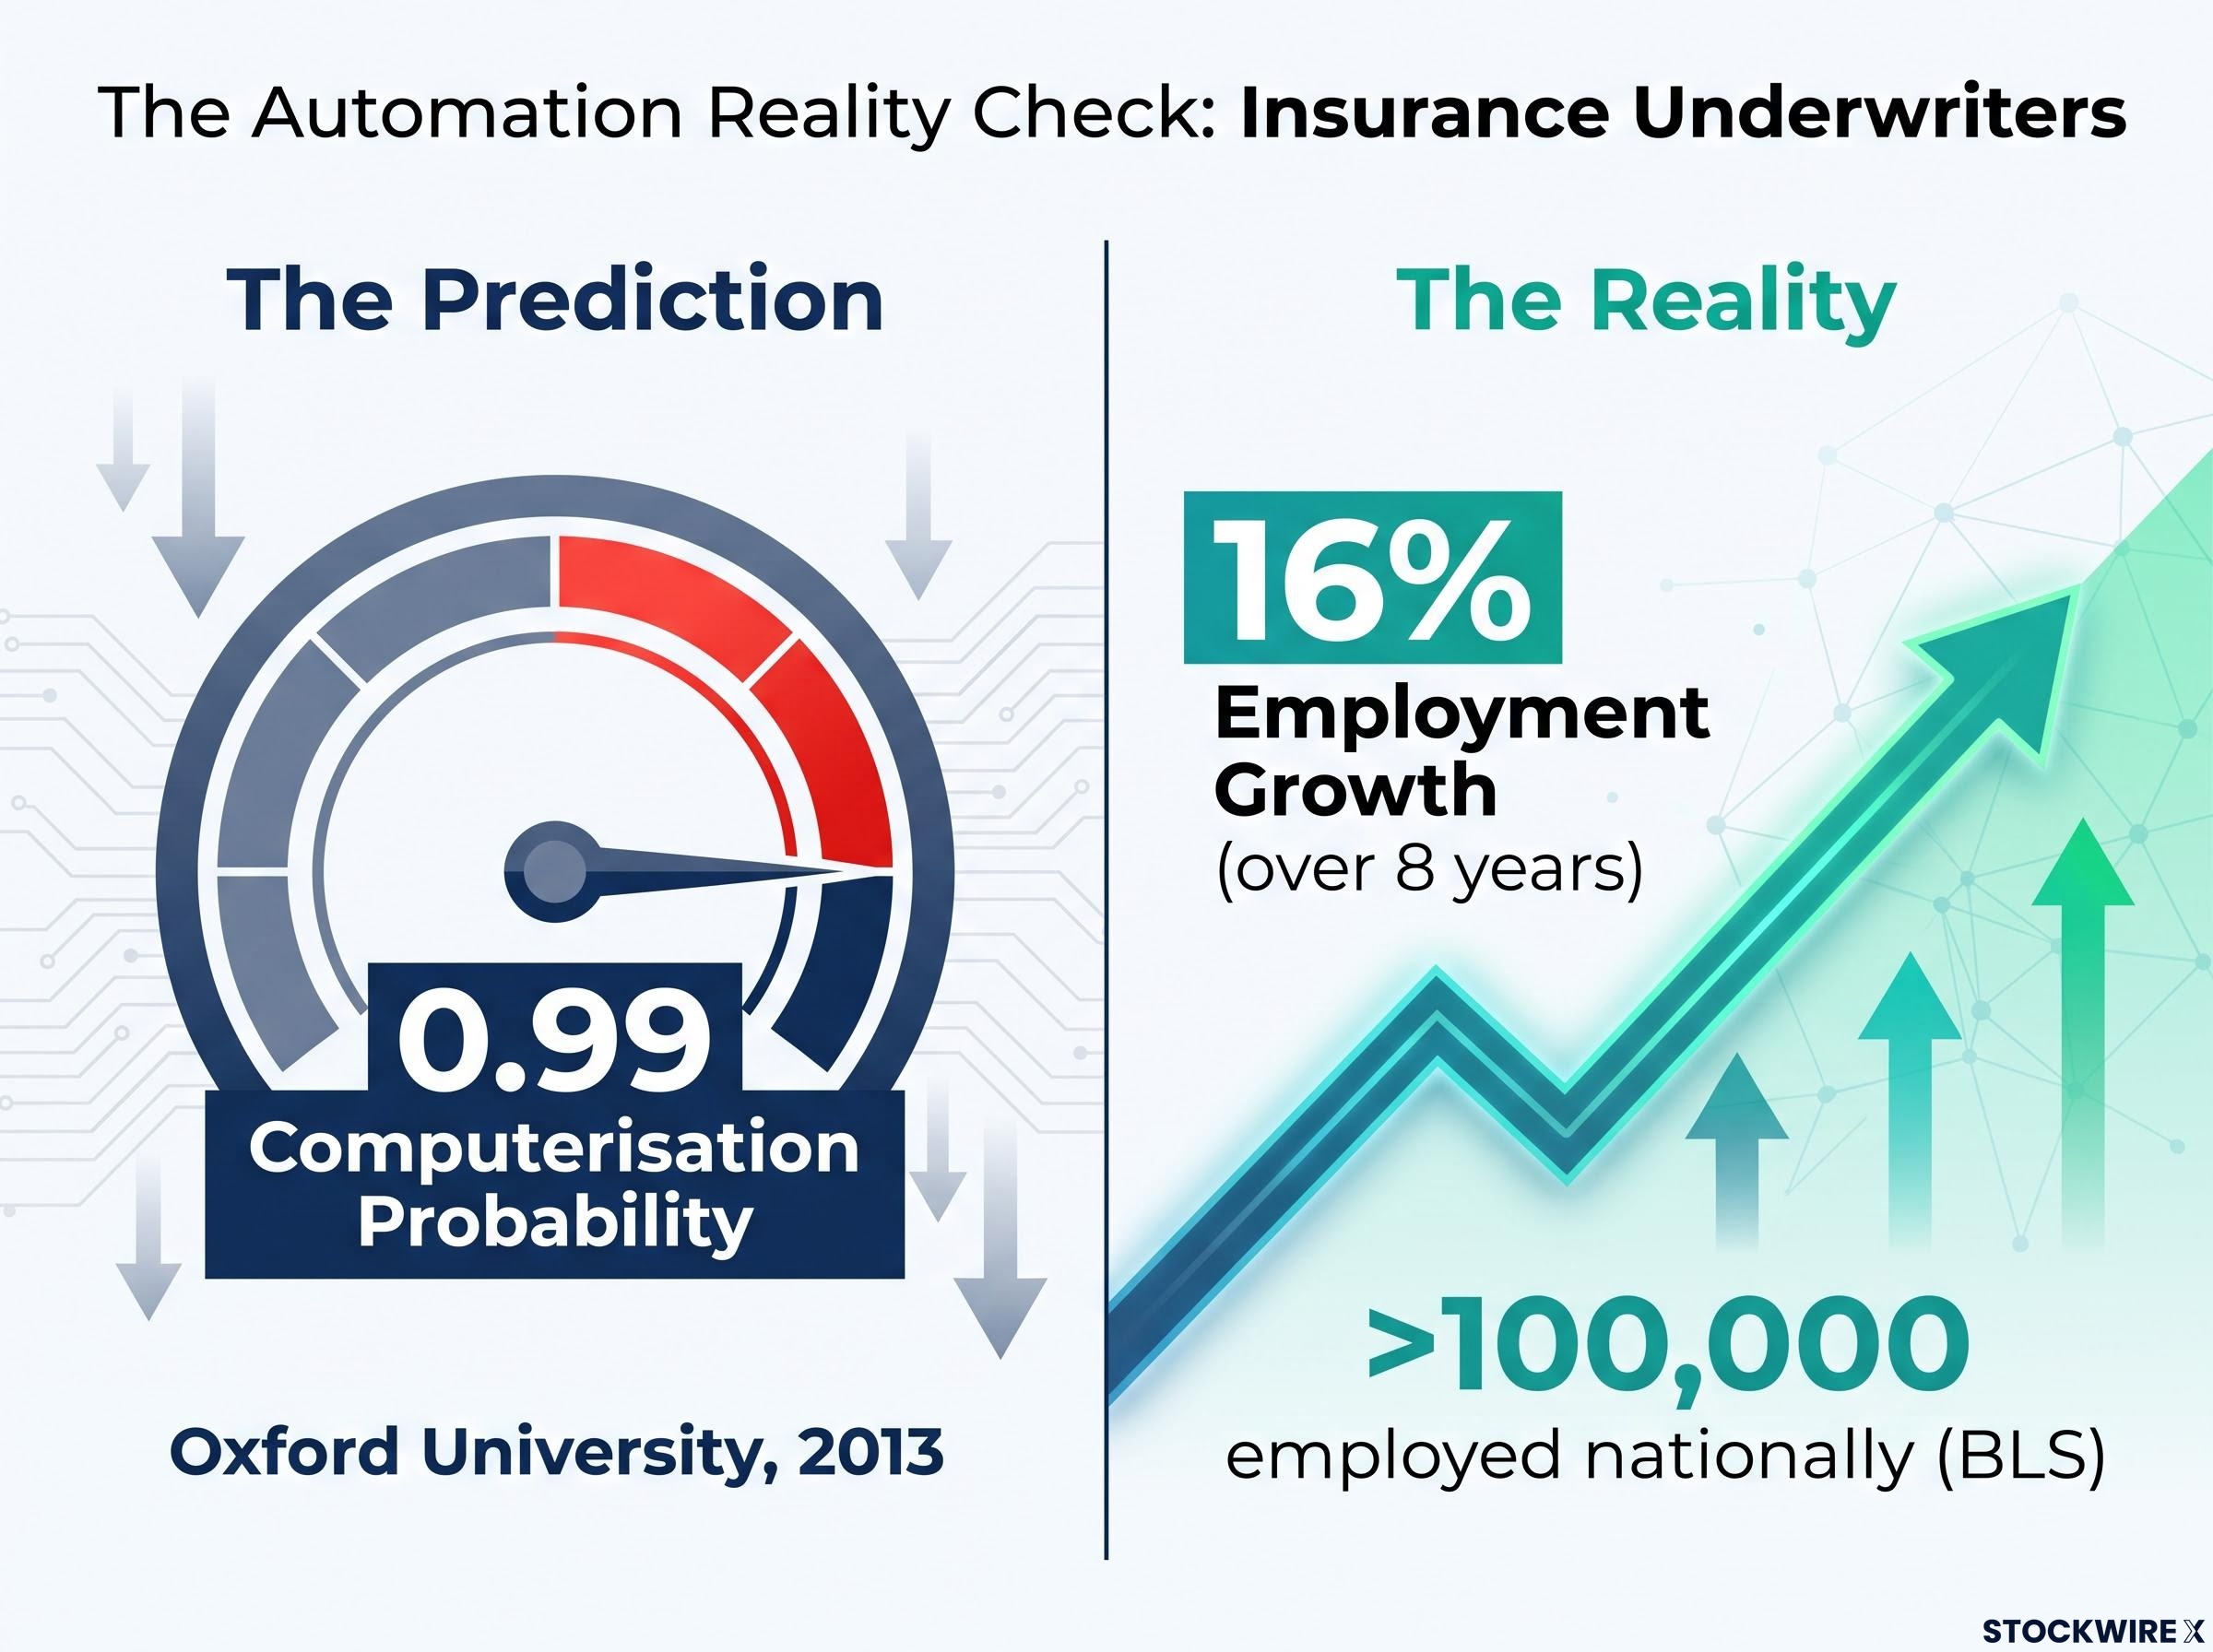
0.99 computerisation probability. 16% employment growth. The gap between what the model measured and what the labour market produced is the single most important calibration point for any investor using automation forecasts.
What the model was measuring vs. what happened in practice
The distinction matters. Frey and Osborne measured what could be automated in theory; the labour market delivered what was being automated in practice. Three categories of deployment reality sat between the model’s prediction and the actual outcome, and the model systematically underweighted all of them.
First, regulatory friction. Insurance underwriting is governed by state-level regulatory frameworks that constrain how quickly firms can replace human judgment with algorithmic decision-making. Second, human-machine complementarity: rather than replacing underwriters, software augmented them, handling data processing while humans retained the judgment calls. Third, organisational inertia, the practical reality that large insurers restructure slowly, particularly in functions tied to client relationships and regulatory compliance.
The Bureau of Labor Statistics (BLS) still reports more than 100,000 underwriters employed nationally, with only a modest decline projected over the next decade. The 0.99 score was not wrong about the task structure of underwriting. It was wrong about the deployment timeline and the degree to which software would complement rather than replace the human role. That distinction is exactly what makes it a poor input for a portfolio decision.
Uber’s robotaxi exposure illustrates why function-level disruption analysis matters more than sector-level framing: trip-growth data from three Waymo-active cities showed Uber accelerating rather than contracting, a real-world outcome that mirrors the underwriter case and directly contradicts the simplest version of the displacement thesis.
When big ASX news breaks, our subscribers know first
Where automation is actually showing up in insurance right now
The same industry, a different function, a completely different outcome. While underwriters absorbed automation as a productivity tool, claims adjusters are experiencing something closer to what susceptibility models originally predicted, not because automation suddenly accelerated, but because claims work is genuinely different. Photo-assessment of property damage, pattern recognition across claim histories, and payout estimation from structured data are precisely the procedural, repetitive tasks that current AI capabilities handle effectively.
GEICO’s response was not theoretical. In 2024, the company disclosed that it had trimmed entry-level claims adjuster roles by 25%, a restructuring tied to its shift toward virtual claims handling and AI-assisted damage estimating tools. GEICO is held within Berkshire Hathaway, one of the most widely owned stocks across diversified U.S. retirement funds, which means this particular workforce reduction lands directly inside a typical investor’s portfolio rather than at the periphery of it.
The BLS projections for claims adjusters, examiners, and investigators confirm the directional trend, though the precise magnitude carries a data-hygiene caveat.
Data note: BLS projection cycles reference different time windows, producing competing figures. One cycle puts the decline at around 11% through 2032, representing roughly 46,000 fewer positions; a separately verified cycle shows approximately 5% over 2025-2035 (roughly 19,000 positions). Both draw on employer-reported payroll data but cover different projection periods. When you encounter conflicting BLS figures on the same occupation, check which projection cycle is being cited before treating either number as definitive.
| Occupation | Automation Evidence Type | Key Metric | Source |
|---|---|---|---|
| Insurance Underwriters | BLS projection | Modest decline from 100,000+ base | BLS |
| Claims Adjusters | BLS projection | 5%-11% decline depending on cycle | BLS |
| GEICO Claims Adjusters | Corporate disclosure | 25% entry-level cut in 2024 | GEICO |
The BLS projection narrative explicitly links part of the adjuster decline to AI tools that assess photographs of property damage and generate payout estimates more efficiently. This is not a speculative overlay; the bureau’s own analysis identifies the mechanism.
The contrast between underwriter and adjuster outcomes within the same industry tells you something specific: “insurance is being disrupted by AI” is too coarse a frame for investment analysis. Occupation-level precision changes the risk picture materially. One function absorbed automation as augmentation and grew. Another is absorbing it as substitution and shrinking. Both are insurance. The portfolio implications are opposite.
Legal services: when automation disrupts work without eliminating job titles
Insurance offers a clean contrast between a misfired prediction and a verified restructuring. Legal services offer something harder to detect: disruption that barely registers in headline employment data but is already redirecting where value accrues.
According to Clio’s 2024 Legal Trends Report, AI-driven automation now touches roughly 69% of the billable hours paralegals generate each year. The tasks driving that figure are specific:
- Document drafting: AI tools now generate first drafts of contracts, briefs, and correspondence that paralegals previously produced from scratch.
- Information retrieval: Legal research that once consumed hours of manual database searching is increasingly handled by AI-powered search platforms.
- Contract and data analysis: Pattern recognition across large document sets, a core paralegal function, is precisely the task category where current AI performs best.
More broadly, Clio’s report finds that roughly 75% of all billable tasks across law firms carry AI exposure, with paralegals and administrative staff bearing the highest shares.
Yet the BLS projects paralegal employment moving from approximately 376,200 to 376,800 over 2024-2034, a 0.2% increase classified as “little or no change,” with around 39,300 annual openings driven mostly by turnover rather than growth. A stable headcount figure for paralegals, however, reveals nothing about whether firms are paying the same, more, or less to generate equivalent output. The Clio data points toward materially less, with the freed-up value flowing somewhere identifiable.
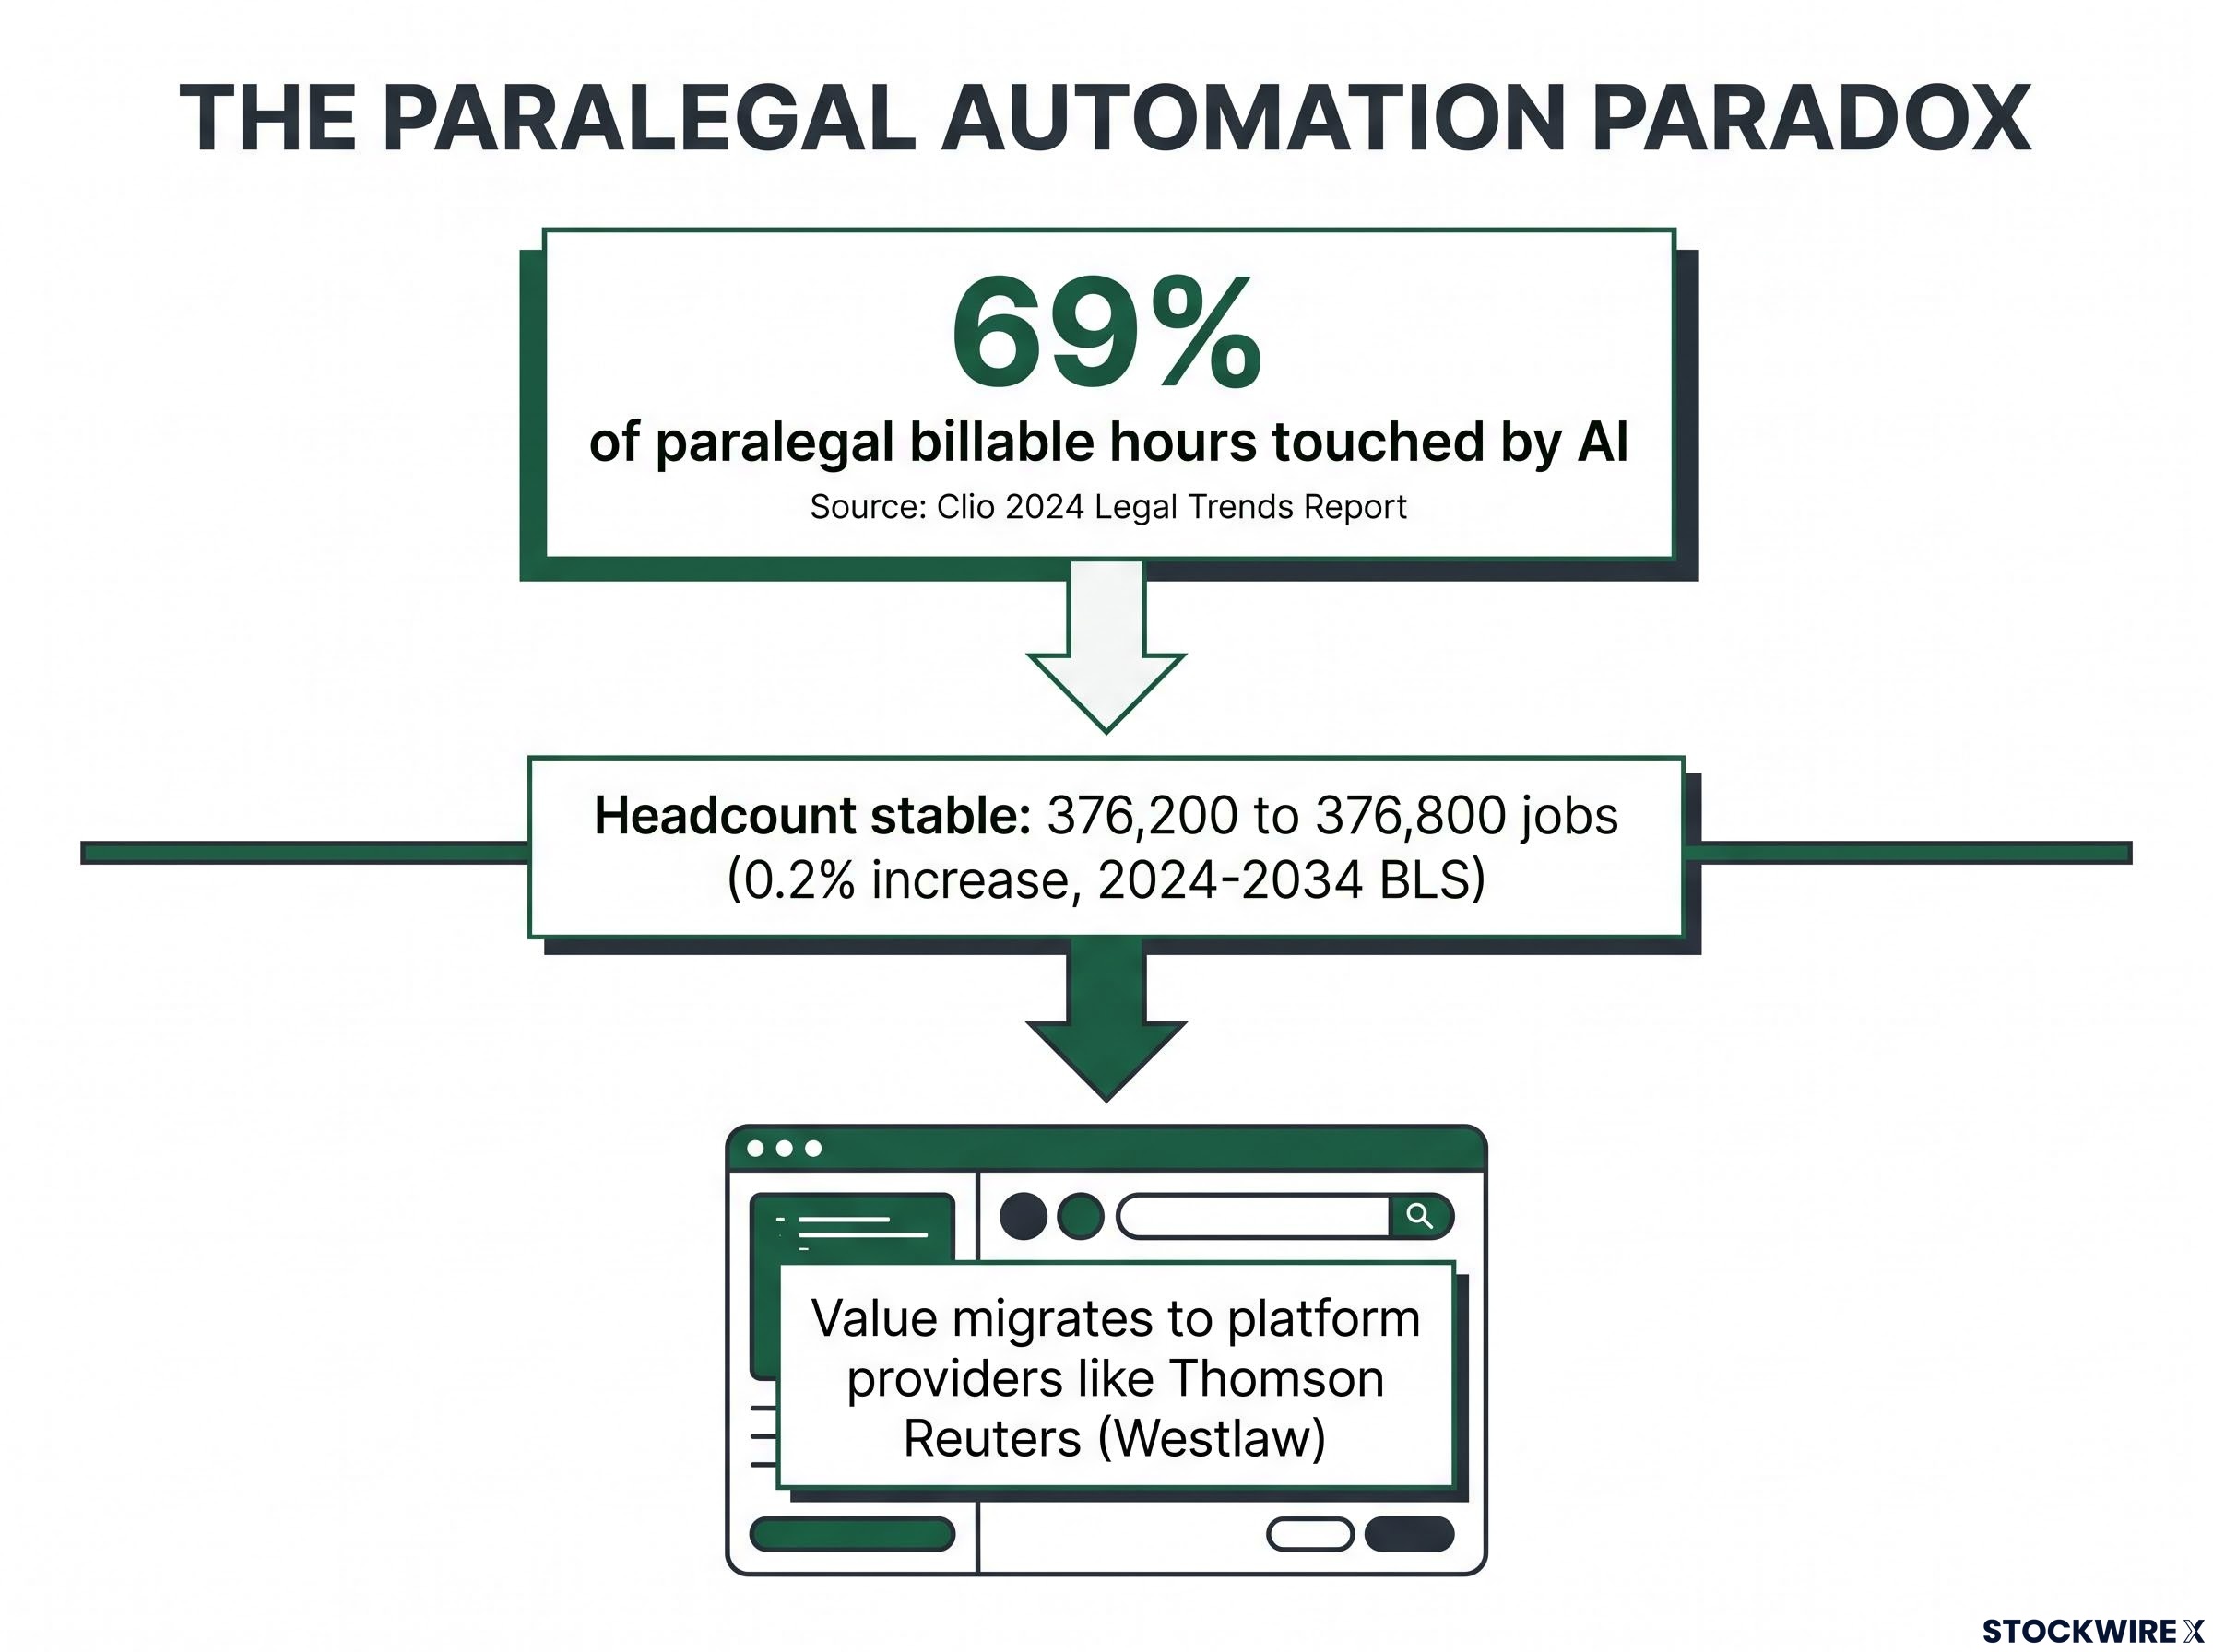
Who captures the value when paralegal hours are replaced by platforms
That somewhere is the platform layer. Thomson Reuters owns Westlaw along with a substantial share of the legal research infrastructure that underpins this shift, and it sits inside major market indices as a direct financial beneficiary of the transition. As AI tools absorb tasks that once filled paralegal billing sheets, the associated revenue does not disappear from the economy; it moves off law firms’ labour cost lines and onto software subscription invoices, with Thomson Reuters positioned to receive a significant portion of that flow.
For a diversified portfolio, automation risk in legal services creates both cost pressure on firms that employ paralegals and revenue opportunity for the platform providers replacing their hours. Your portfolio may hold both sides of that equation without your knowing it, which is why the beneficiary question is not optional in automation analysis.
The legal services case, where value moves from paralegal billing lines to platform subscription invoices, mirrors a broader enterprise value migration that rewarded native AI infrastructure and consumption-based pricing models while repricing legacy per-user licensing businesses by trillions of dollars in early 2026.
A practical framework for reading automation risk in your portfolio
The three cases above, underwriters, claims adjusters, and paralegals, map the full range of outcomes a diversified investor should expect. Translating that into a repeatable decision process requires ranking the available data inputs by reliability.
- Disclosed corporate actions and headcount changes tied to specific functions. This is the highest-confidence input. A named firm, a named function, a named scale, and a named timeframe. GEICO’s 25% entry-level claims adjuster cut in 2024 is the prototype: you know what changed, where, by how much, and when. When this category of evidence appears for a holding you own, it warrants a position review.
- Payroll-based BLS occupational projections with narrative notes on automation. The BLS Occupational Employment and Wage Statistics and Employment Projections series are built on employer-reported payroll records, not opinion surveys or executive expectations. They provide current employment counts by detailed occupation, ten-year projections, and narrative notes when AI is expected to affect trajectories. Research from Stanford using ADP-based payroll records offers supplementary grounding. These are directional baselines with caveats, not precision forecasts.
- Susceptibility rankings and survey-based forecasts. Background context only. The Oxford study’s underwriter prediction, the most confident score in the most cited automation paper of its era, delivered the opposite of its indicated outcome across an entire decade, which illustrates how little predictive weight these rankings carry for portfolio decisions. Treat them as context, not as triggers.
Bank of America’s estimate that 838 million jobs carry meaningful AI job exposure underscores the same critical distinction this framework draws: exposure is not displacement, and conflating the two figures produces portfolio decisions that misread risk in both directions.
The beneficiary question applies at every tier. Every workforce reduction has a counterpart, and identifying it changes your net exposure picture:
- Legal services: Platform providers like Thomson Reuters (Westlaw) capture value migrating from paralegal billable hours to software subscriptions.
- Insurance: Claims-automation vendors and virtual-adjusting tool providers benefit from carriers’ push to process more claims digitally.
This framework converts the vague headline “AI is disrupting X sector” into three specific questions you can answer with public data: has the firm disclosed headcount actions in specific functions? What do payroll-based projections say about those occupations nationally? And which vendors are capturing the value on the other side? That is the operational difference between portfolio noise and actionable risk analysis.
What the underwriter misprediction and the GEICO disclosure actually change
The underwriter case is not evidence that automation risk is overstated. It is a calibration point. It narrows the valid inputs for portfolio decisions to verified, present-tense data rather than theoretical future probabilities. The GEICO disclosure is not evidence that insurance is collapsing. It is a specific, function-level restructuring that affects a widely held portfolio position.
The three case studies together map the spectrum. A 0.99 probability that produced 16% employment growth. A 25% disclosed headcount cut in a specific function at a named firm. A 69% billable-hour exposure that coexists with 0.2% projected employment change. Each demands a different investor response, and no single automation headline captures that range.
The same structural asymmetry applies at the market level: AI model convergence compresses routine inefficiencies on calm days while creating the conditions for correlated exits and sharper tail moves when stress arrives, a dynamic that sits behind headline index moves without registering in any occupation-level dataset.
| Evidence Type | Confidence Level for Portfolio Decisions | Best Use |
|---|---|---|
| Disclosed corporate headcount actions | High | Direct trigger for position review |
| BLS payroll-based projections | Medium-High | Directional baseline with caveats |
| Susceptibility rankings / forecasts | Low | Background context only |
Your next step is specific. For each significant holding, identify which occupations dominate that firm’s cost structure. Check whether any disclosed corporate actions, payroll-based projections, or platform revenue shifts currently apply to those occupations. If the answer is yes, you have a present-tense automation signal worth acting on. If the only evidence is a susceptibility ranking, you have context, not a trigger.
The question was never whether automation is real. It is whether you are looking at the right data.
This article is for informational purposes only and should not be considered financial advice. Investors should conduct their own research and consult with financial professionals before making investment decisions.