
Subprime auto loan delinquencies just hit a 32-year high, and the economy that produced them does not look like one in crisis. Unemployment has not spiked. No recession has been declared. The signal is coming from somewhere else.
Fitch Ratings’ subprime auto asset-backed securities (ABS) index, which tracks securitised loans bundled and sold to investors, recorded a 60-plus-day delinquency rate of 6.9% in its January 2026 reading, covering December 2025 collections. That is the highest figure in the index’s history, stretching back to the early 1990s. Alongside it, Cox Automotive data shows that roughly 1.73 million vehicles were repossessed across 2024, the highest annual count recorded since 2009. None of this fits the pattern of a broad macroeconomic downturn. It fits the pattern of a credit structure that stretched too far.
Here is the framework for reading the data clearly: what the prime/subprime divergence actually tells you, how truck pricing outgrew the borrowers financing it, and what the feedback loop now tightening around subprime lending means for borrowers, lenders, and the auto market heading into late 2026.
A 32-year record that does not look like a recession
The headline number needs a precise anchor. Fitch Ratings’ subprime auto ABS 60-plus-day delinquency index posted a reading of 6.9% in January 2026, marking the highest level the index has reached across its entire history dating to the early 1990s. No prior peak, including the 2008-2009 financial crisis, reached this level.
Fitch Ratings, January 2026: Subprime auto ABS 60-plus-day delinquencies reached 6.9%, the highest reading in 32 years of data.
But the number only becomes diagnostic when you place it alongside the prime borrower data. The divergence between the two tiers is where the analytical signal lives.
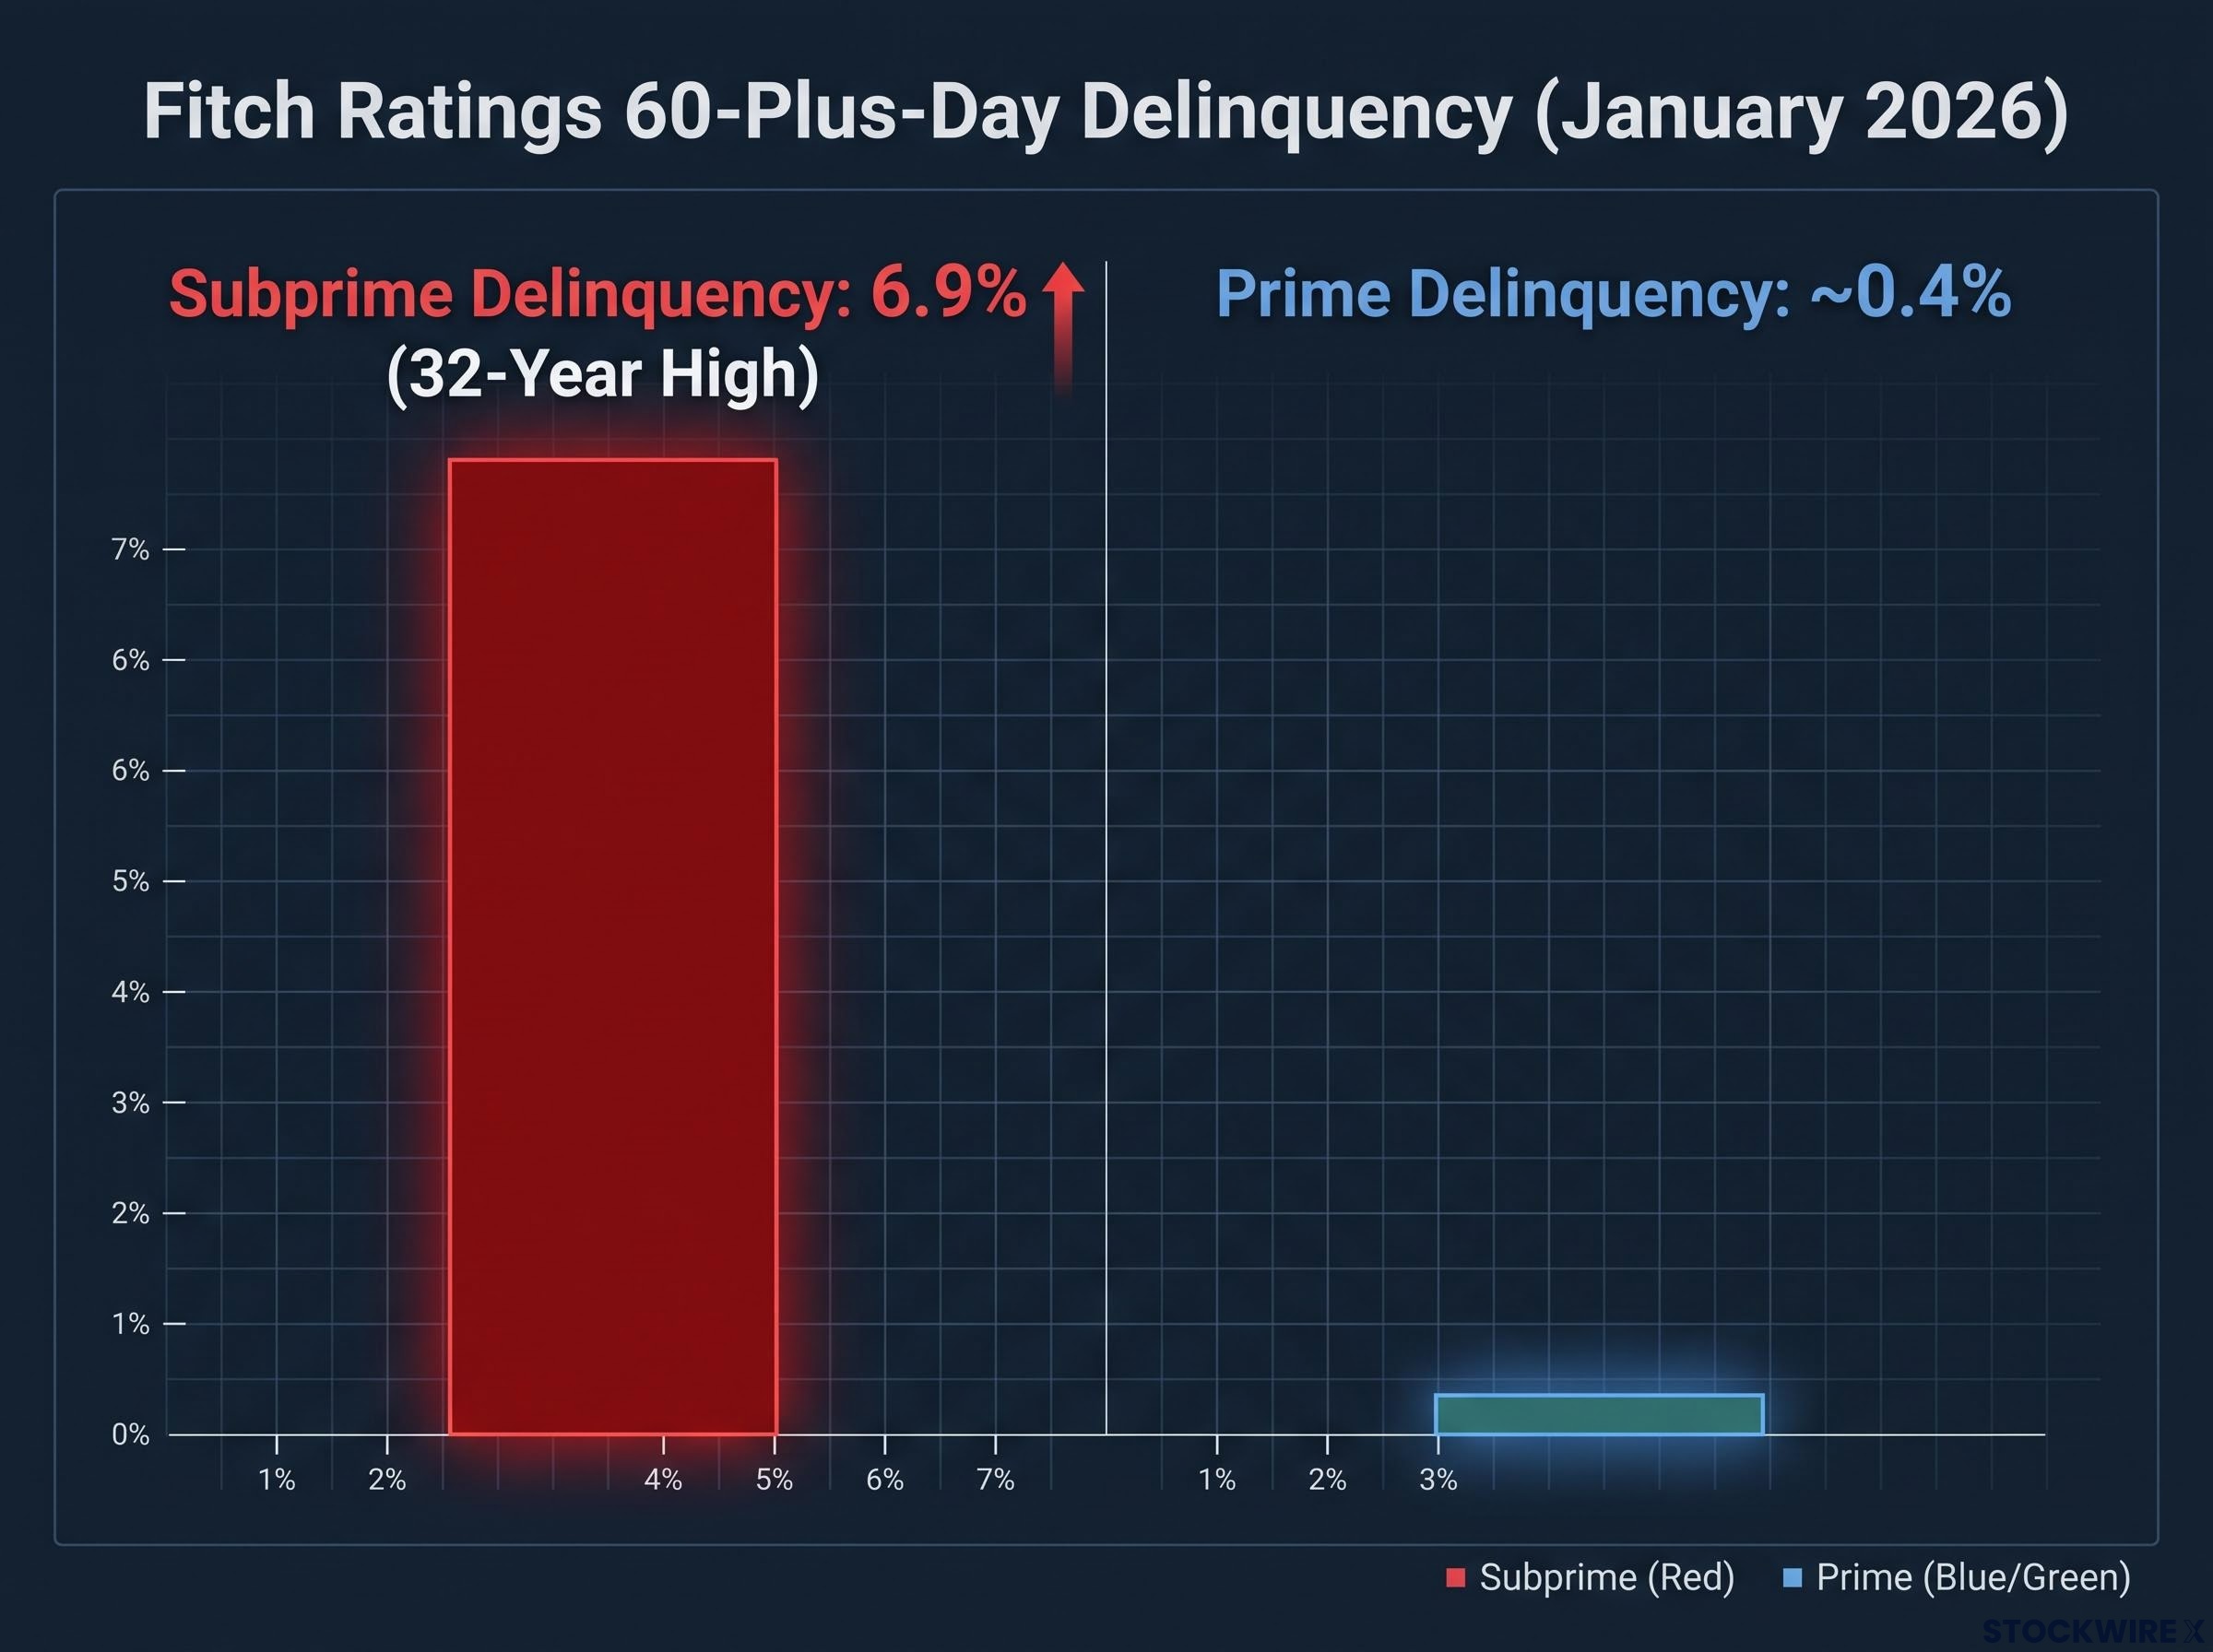
- Subprime 60-plus-day delinquency rate: 6.9%, a 32-year record
- Prime 60-plus-day delinquency rate: approximately 0.4%, broadly in line with historical norms
- Historical context: No prior reading in Fitch’s time series reached the current subprime level since the early 1990s
In a genuine recession-driven credit event, stress propagates across both tiers simultaneously. Prime borrowers start missing payments. Default curves steepen at every credit grade. That is not what the data shows. Prime borrowers are paying at rates consistent with a healthy economy. The distress is concentrated entirely at the subprime margin.
Credit tier divergence producing concentrated stress in one segment while leaving prime borrowers unaffected is a structural pattern visible across multiple consumer asset classes in 2026, with mortgage data showing near-historic-low delinquency rates for single-family borrowers even as higher-risk segments in multifamily commercial face mounting vulnerability.
According to Fitch, the drivers behind ongoing subprime stress include elevated cost of living pressures, high debt servicing costs, and a cooling labour market, with the agency projecting that subprime performance will continue to worsen through 2026. That combination of forces is not a recession signature. It is a credit structure signature, and the distinction changes everything about how you should read the data and what you should expect next.
When big ASX news breaks, our subscribers know first
How truck prices outgrew the borrowers financing them
The affordability math tells the story more clearly than any delinquency chart. Start with the vehicle, then work backward to the borrower who is financing it.
Kelley Blue Book and Cox Automotive report a full-size pickup average transaction price (ATP) of approximately $66,427 as of June 2026, up roughly 2.1% year-over-year. Recent monthly readings cluster tightly in the $66,000-$67,000 band. At the high end, a fully equipped Ford F-150 Raptor R carries a sticker above $113,000, while a Ford F-450 Platinum opens at $110,000 before a single option is added. Neither vehicle is a limited-run specialty item. Both sit in standard dealer stock nationwide and are being financed by real buyers across every state each week.
Now consider who is financing them. Bureau of Labor Statistics figures for Q2 2026 show median weekly earnings for a full-time male worker at $1,380, which works out to roughly $71,760 gross per year. Once standard taxes and payroll deductions are applied, the resulting take-home pay comes to approximately $4,833 per month.
The broader K-shaped consumer economy context matters here: top-income households are carrying debt loads with comfortable buffers, while lower and middle-income households have seen savings rates compress toward 4% even as vehicle prices and cost-of-living pressures have climbed, leaving subprime borrowers with the thinnest cushion at exactly the moment lending terms demanded the most from them.
Conventional lender debt-to-income guidelines, the underwriting rules auto lenders use to assess whether a borrower can sustainably carry a payment, treat 10-15% of gross income as the prudent ceiling for a vehicle payment. At current interest rates, that threshold supports a vehicle purchase of approximately $50,000-$55,000. The segment average sits well above it. The high-end trims sit dramatically beyond it.
| Scenario | Monthly Payment (est.) | Share of Median Gross Monthly Income |
|---|---|---|
| Average pickup at $66,427 (72-month term) | ~$1,100-$1,200 | ~18-20% |
| High-end truck at $100,000 (84-month term) | ~$1,400-$1,600 | ~23-27% |
| Conventional affordability ceiling ($50,000-$55,000) | ~$850-$950 | ~14-16% |
The gap between the affordability ceiling and the segment average did not appear overnight. It was papered over by lending structures designed to minimise the visible monthly cost while maximising total borrower exposure:
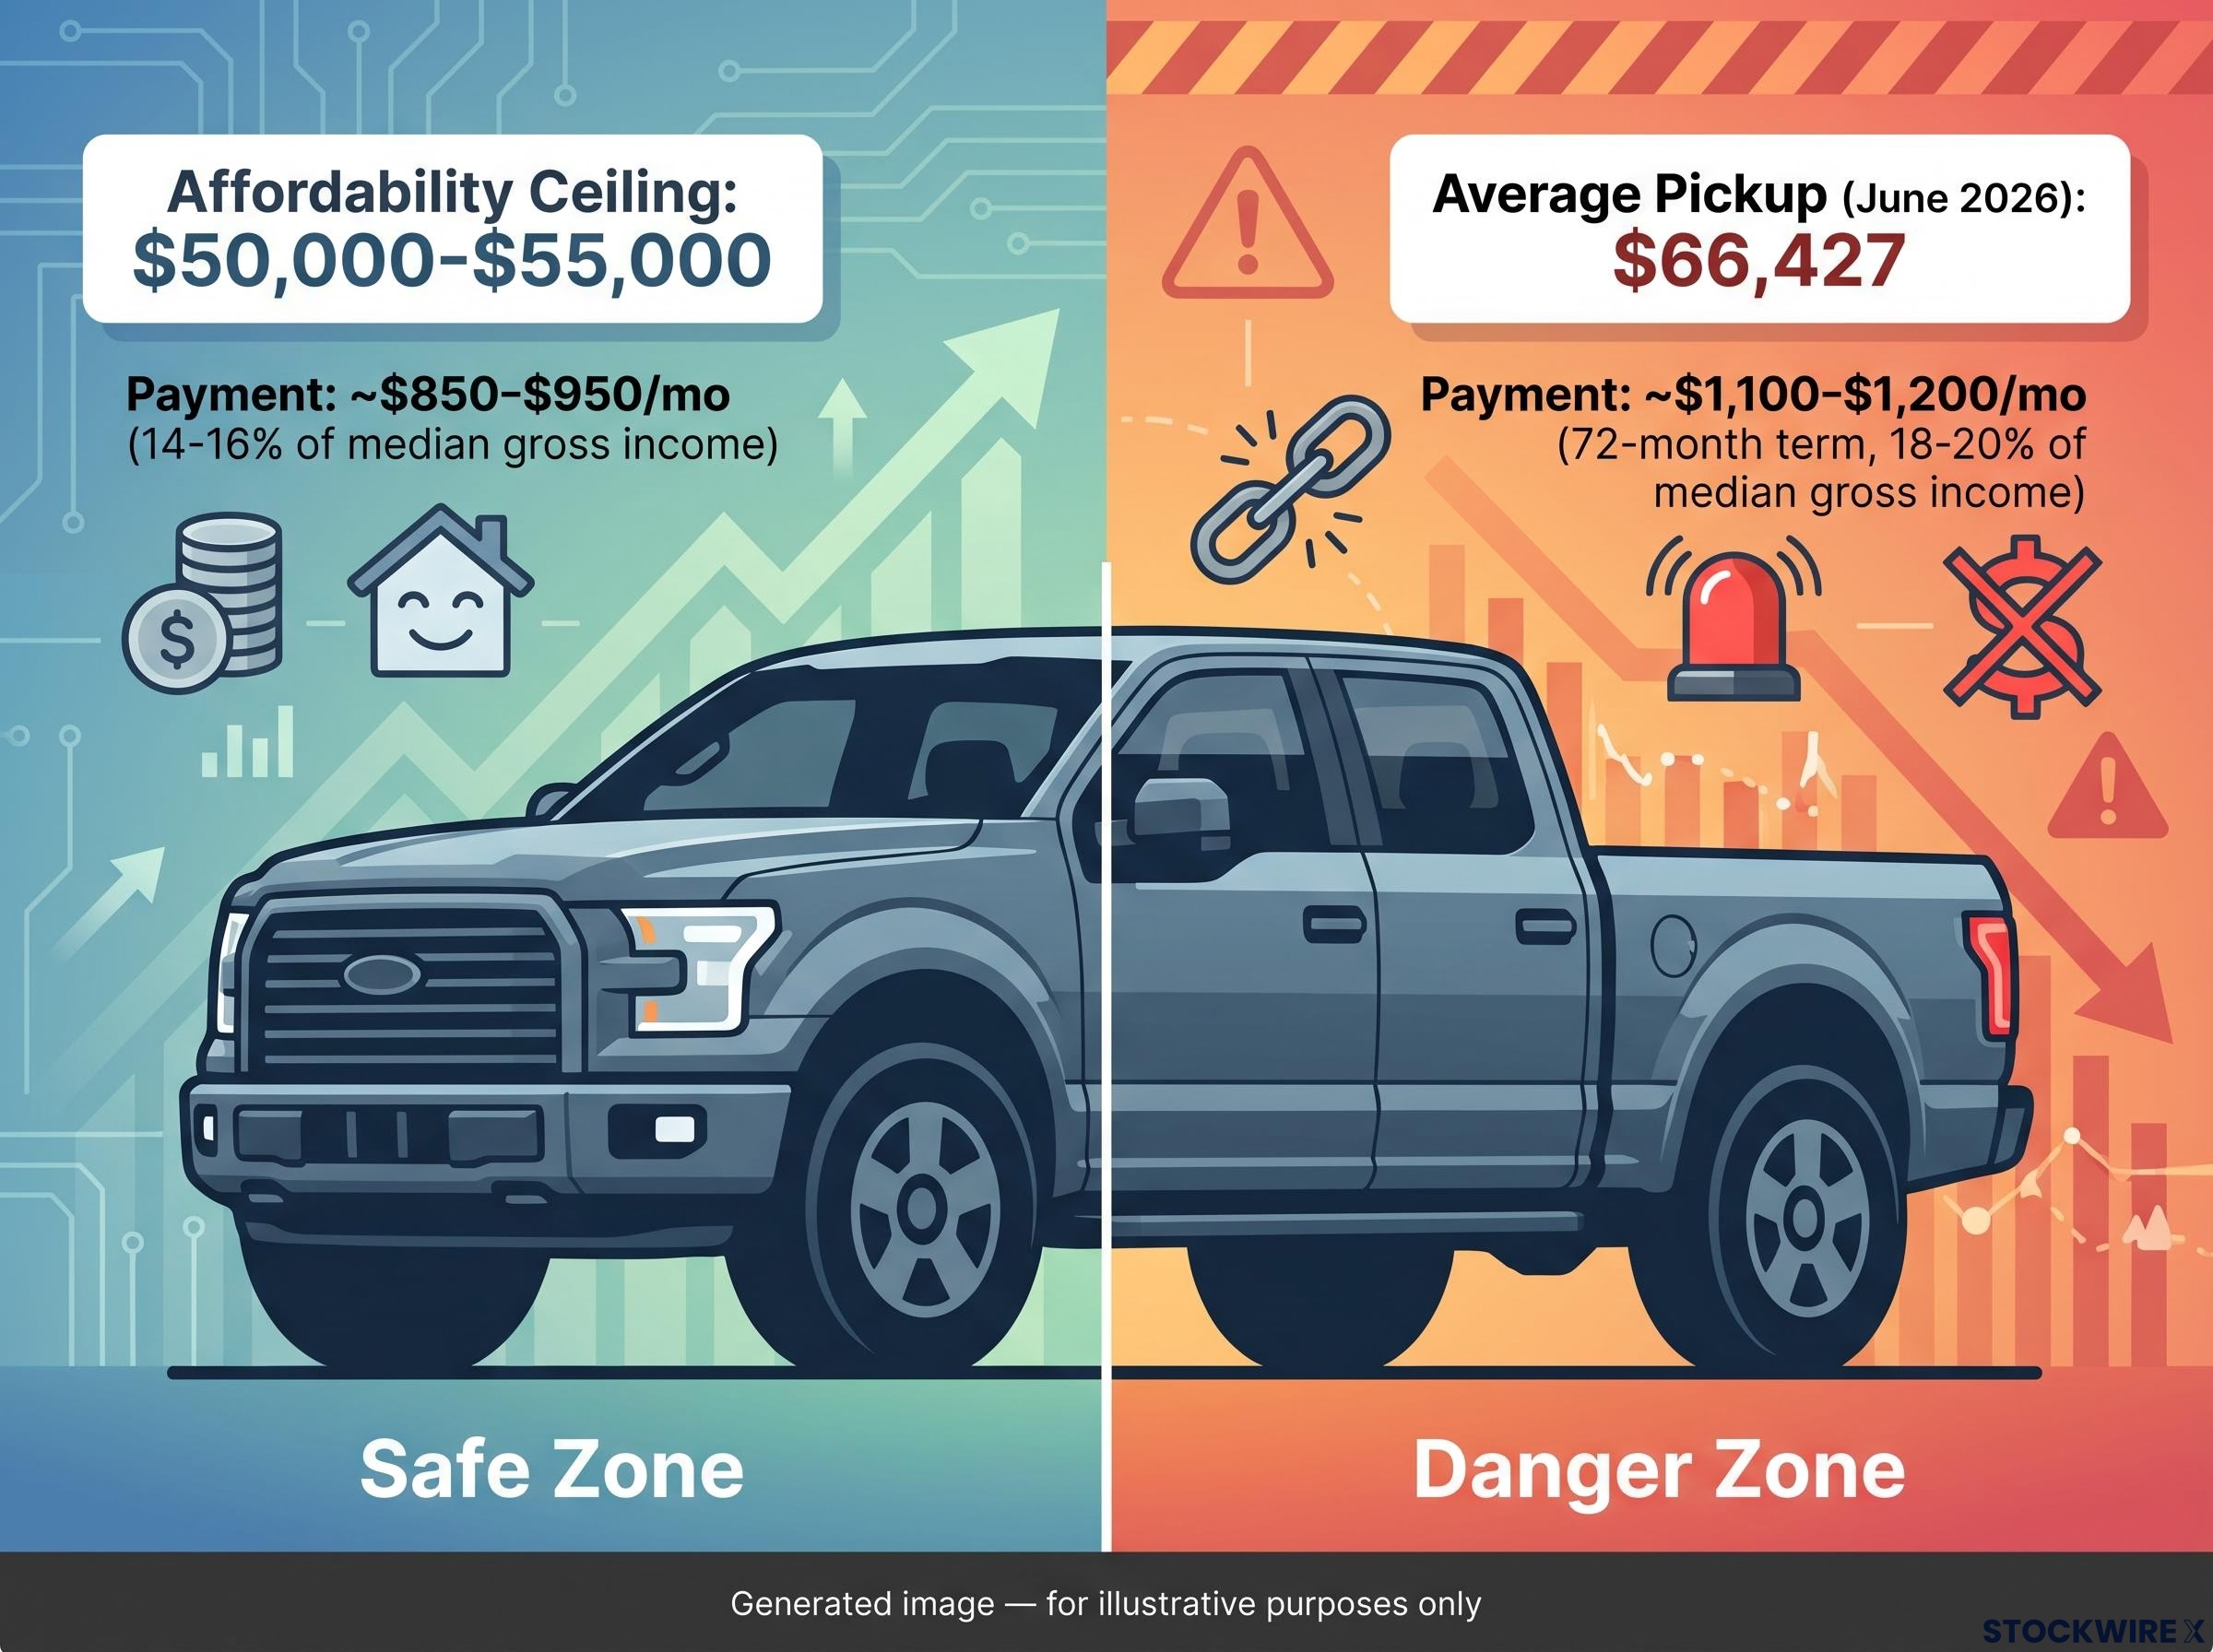
- 72- and 84-month loan terms that stretch payments across six or seven years, reducing monthly cost but dramatically increasing total interest paid
- Minimal down payments that leave borrowers underwater on the loan from the moment they drive off the lot
- A sales environment emphasising monthly payment over total obligation, where the question is “what can you afford per month?” rather than “should you be financing this vehicle at all?”
The delinquency wave is, in significant part, the predictable outcome of these lending terms. Many subprime borrowers were not in a position to successfully carry these loans when they were written. The monthly payment looked manageable. The total obligation was not.
What the prime/subprime divergence actually diagnoses
The data is clear. What it means requires a framework.
The acute distress in subprime alongside stable prime conditions is the structural signature of a credit overextension cycle. Subprime borrowers, by definition, entered these loans with weaker credit histories, thinner savings, and less capacity to absorb cost of living increases or income disruptions. When vehicle prices climbed and lending terms stretched to accommodate them, these borrowers absorbed the most risk with the least cushion.
The pattern distinguishes itself from a recession in a specific way: in a downturn, stress propagates broadly across all credit tiers as job losses and income declines affect the full borrower population. The current pattern is concentrated and identifiable. The corrective pressure is already feeding back through lending standards at the subprime margin.
The same concentration pattern appears across other consumer credit categories: consumer debt stress in 2026 is consistently located at the subprime and lower-income cohort level, not distributed broadly across the borrower population, which is why aggregate household net worth figures and individual-level delinquency data tell materially different stories simultaneously.
- Stress is concentrated in subprime only. Prime delinquencies remain at approximately 0.4%, within historical norms.
- The mechanism is credit overextension, not macroeconomic shock. The affordability gap between vehicle prices and borrower income existed at origination.
- Corrective pressure is already underway through tighter lending standards at the subprime tier, a process that constrains future exposure but does not relieve existing borrowers.
Fitch Ratings outlook: Fitch expects renewed subprime performance deterioration through 2026, citing elevated cost of living pressures, high debt servicing costs, and a cooling labour market.
What the repossession data adds
Cox Automotive data shows roughly 1.73 million vehicles were repossessed in 2024, the highest annual figure since 2009. For many of the borrowers affected, that same vehicle was their primary way of getting to work each day. When the vehicle goes, the financial damage compounds: lost mobility often leads directly to lost income, while the repossession sits on the borrower’s credit file and can take years to work through.
Seasonal data patterns are worth bearing in mind here. Fitch notes that 60-plus-day delinquency rates tend to ease in March as tax refunds land, before the deterioration trend picks back up. A short-lived improvement in spring readings does not signal that the underlying problem has been resolved. The affordability gap between what borrowers earn and what they are financing remains in place regardless of a temporary cash infusion.
Stress concentrated at the subprime margin points to a lending discipline failure with defined edges, rather than a warning sign of a systemic economy-wide credit breakdown. Keeping that distinction clear matters for how you assess the reporting around this data.
The feedback loop tightening around borrowers and lenders
The delinquency data does not exist in isolation. It feeds back into the market conditions that determine who can borrow, at what cost, and for which vehicles.
Credit tightening at the subprime margin is already underway across three channels:
- Higher credit score cutoffs that exclude borrowers who would have qualified 18-24 months ago
- Stricter income verification requirements that close the gap between stated and verified borrower capacity
- More conservative loan structures, including shorter maximum terms and higher required down payments
For prospective borrowers in the subprime tier, the practical consequence is fewer financing options, higher upfront costs, and less flexibility on terms. The window for accessing vehicle financing on the arrangements that prevailed in 2023-2024 is narrowing.
The market consequences compound from there:
- Dampened vehicle demand as tighter credit removes marginal buyers from the market
- Rising used vehicle inventory as repossessed vehicles return to dealer lots and auction houses
- Pressure on residual values as the buyers most likely to purchase repossessed and used vehicles are the same borrowers now facing tighter credit access
The result is a self-reinforcing dynamic. Repossessed stock flows back into the market, but the borrowers best placed to absorb it can no longer secure financing. Values weaken as a result. Lender recovery rates on that collateral fall. Worse loss figures then push lenders toward even tighter credit criteria.
Credit market bifurcation across rating tiers is not unique to auto lending: the same dynamic appears in leveraged loan markets, where CCC-rated obligations face severe pricing penalties while higher-rated debt retains support, a pattern consistent with lenders concentrating their exit from risk at the margin rather than pulling back across the board.
When delinquency figures ease around March or April, that seasonal relief needs to be read in context. Tax refund payments reduce pressure on individual borrowers for a period, but they leave the underlying mismatch between vehicle prices and borrower income entirely intact.
Borrowers in or near the subprime tier face a material shift in the current environment: the total cost of a vehicle over the full loan term now deserves far more scrutiny than the monthly payment figure alone. It was precisely the culture of focusing on that monthly number, rather than the total obligation, that drove the lending conditions now behind the 32-year delinquency record.
What the delinquency wave resolves, and what it leaves open
The analytical conclusion is clear. The 32-year delinquency high is the visible consequence of a structural affordability mismatch papered over by lending terms engineered to minimise monthly cost: 6.9% subprime delinquency (Fitch, the highest since the early 1990s), 1.73 million repossessions (Cox Automotive, the highest since 2009), and an average full-size pickup ATP of $66,427 (KBB/Cox, June 2026) that sits well above the $50,000-$55,000 a median earner can comfortably finance under conventional guidelines.
The data points to a credit structure problem, not a recession in the making. That distinction carries real weight for how the situation should be interpreted.
Two variables will determine the trajectory through the remainder of 2026. First, whether credit tightening at the subprime margin proves sufficient to contain further deterioration or whether existing loan portfolios continue to season into higher losses. Second, whether the labour market softening Fitch cites accelerates into broader job losses, which would widen the stress beyond the subprime tier, or stabilises at current levels.
The takeaways differ depending on where you sit:
- Current subprime borrowers: Understand total remaining obligation, not just monthly payment. Refinancing options are narrowing, and proactive engagement with lenders before a missed payment is materially better than engagement after one.
- Prospective buyers evaluating affordability: The conventional guideline (10-15% of gross income for a vehicle payment) exists for a reason. If the vehicle you are considering requires terms longer than 60 months or a down payment below 10%, the math is telling you something.
- Those assessing auto lending market risk: Monitor subprime ABS delinquency data and used vehicle price indices. The variables to watch are credit access at the subprime tier and labour market conditions, not aggregate GDP.
Fitch’s outlook points to ongoing deterioration in subprime performance continuing through 2026. The correction is structural and correctable, through lending standards, vehicle pricing, and loan term norms, but it will take time and arrive unevenly. Subprime borrowers bear the near-term cost while lenders and manufacturers adjust.
This article is for informational purposes only and should not be considered financial advice. Investors should conduct their own research and consult with financial professionals before making investment decisions. Past performance does not guarantee future results. Financial projections are subject to market conditions and various risk factors.