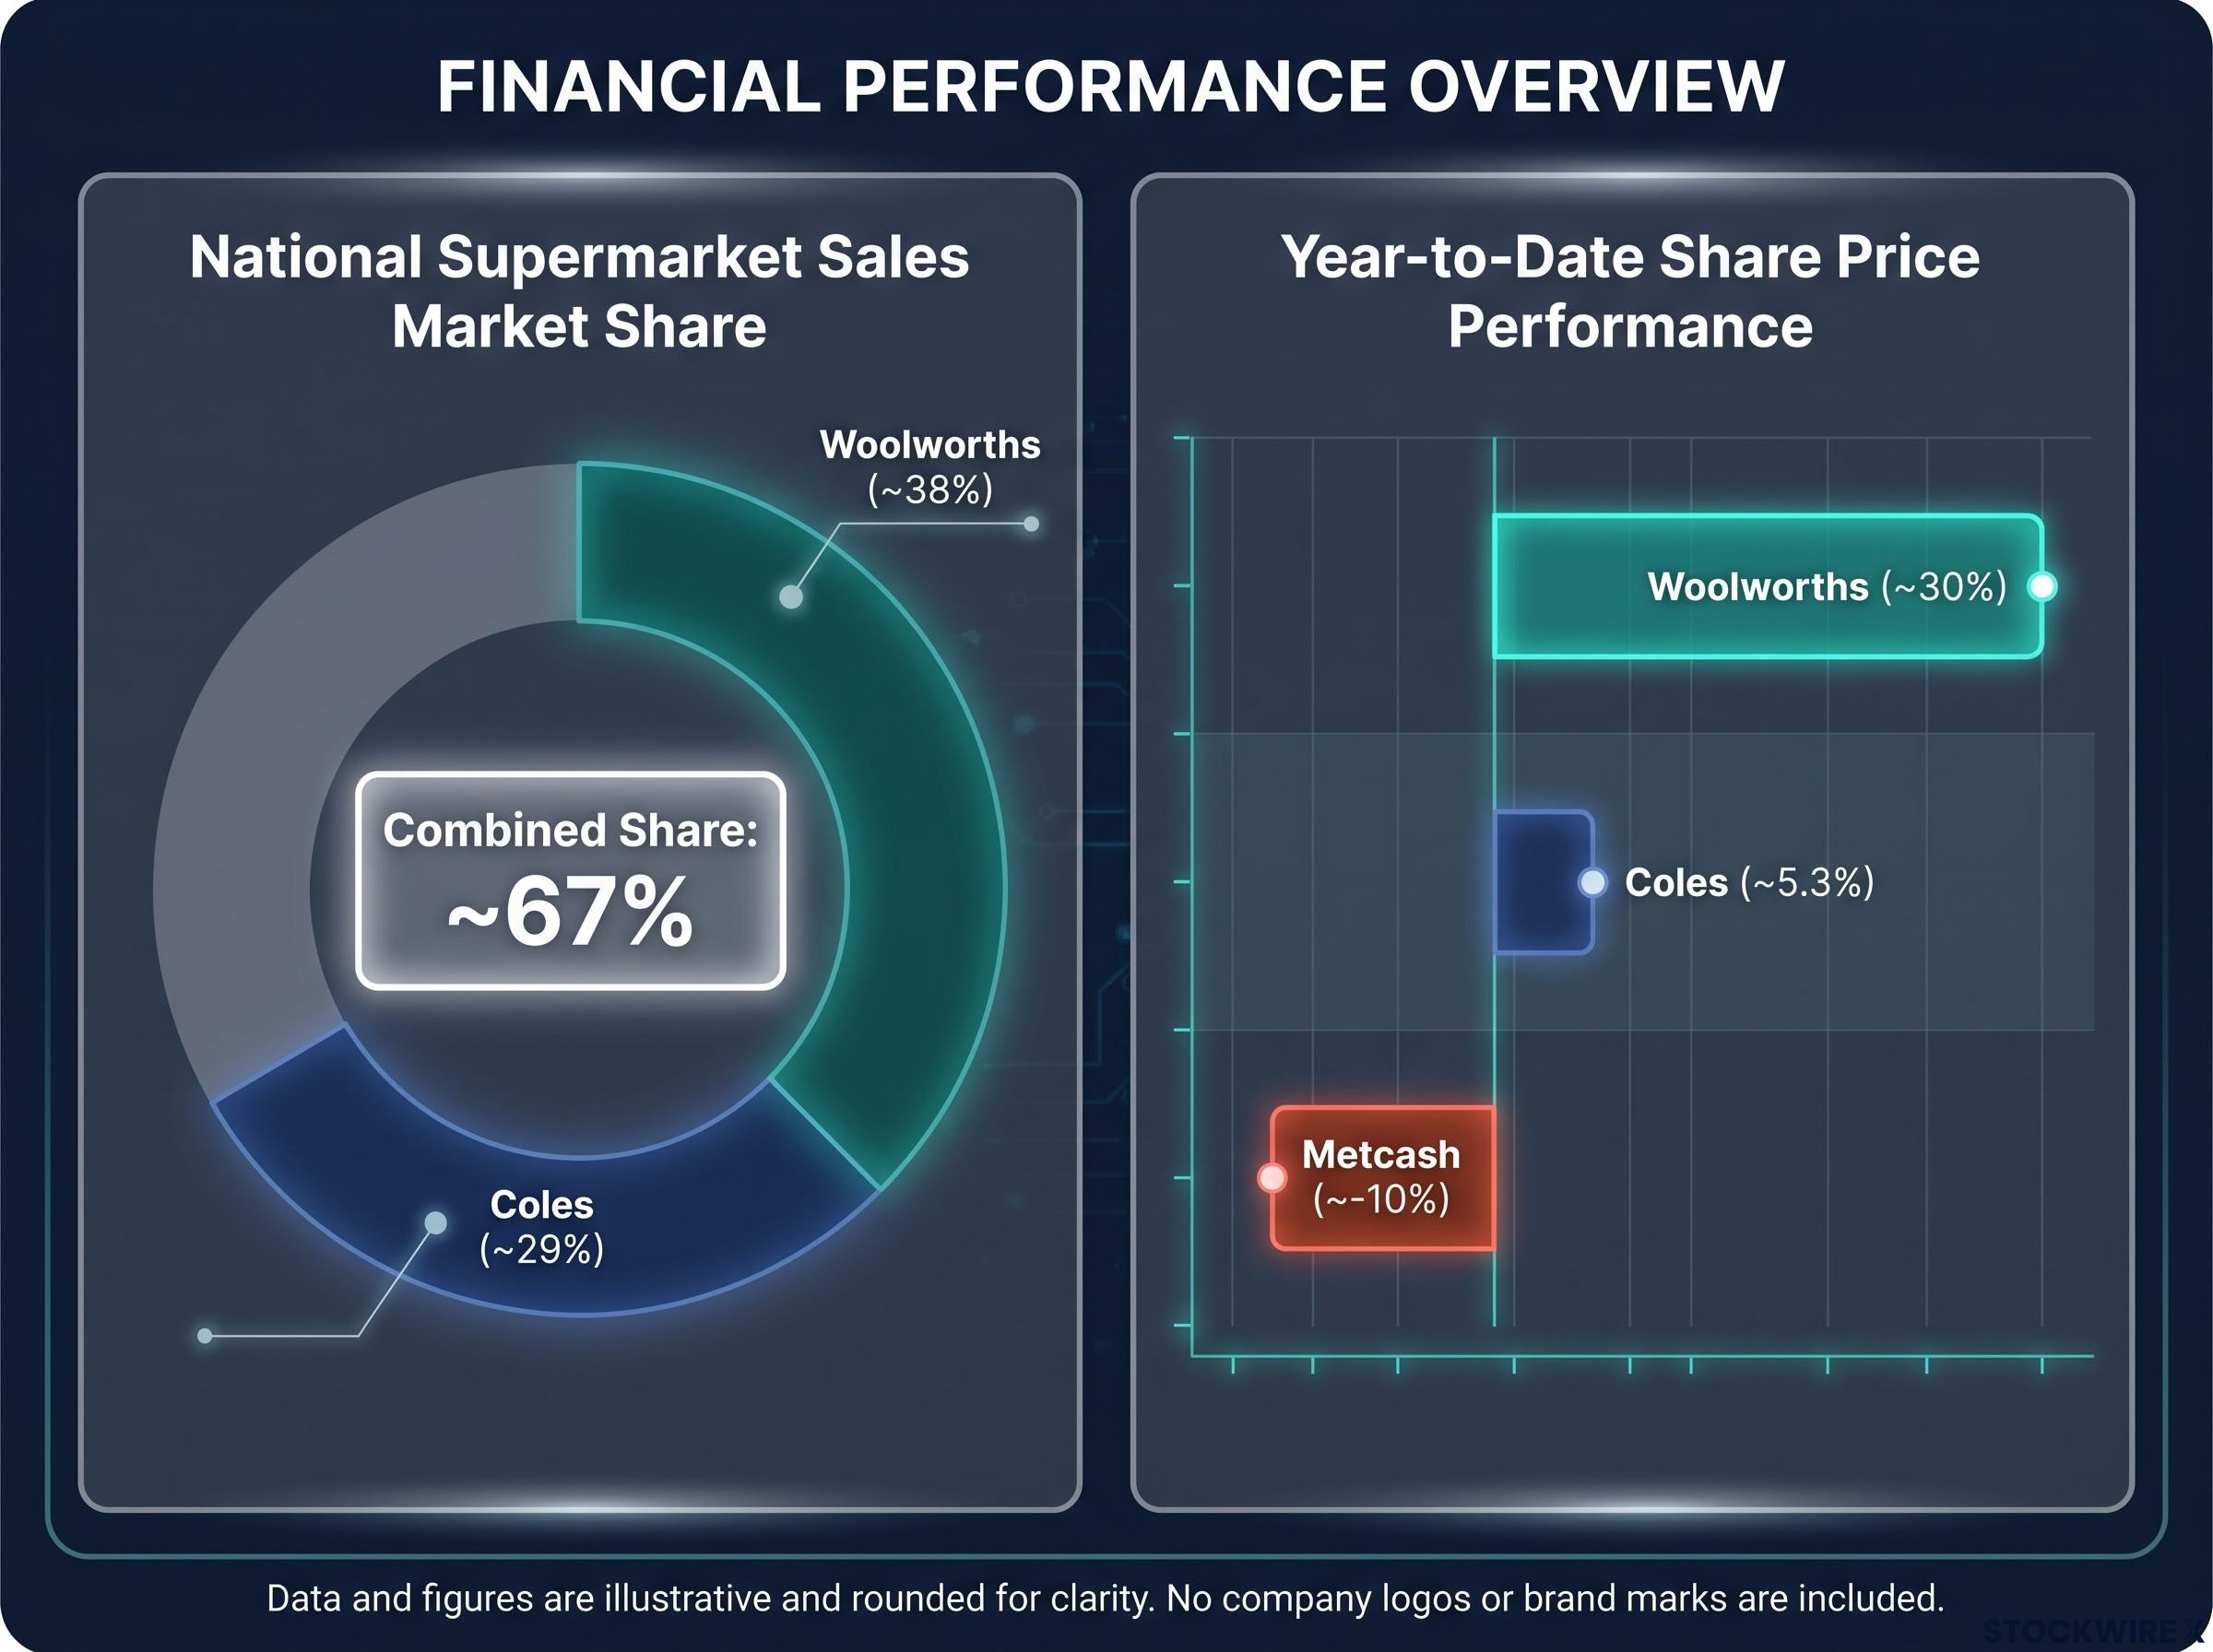
Woolworths shares are up roughly 30% year to date. Coles has posted high single-digit gains. Metcash fell approximately 10% over an earlier reporting window. Three companies in the same sector, three sharply different outcomes, and the divergence is not a coincidence.
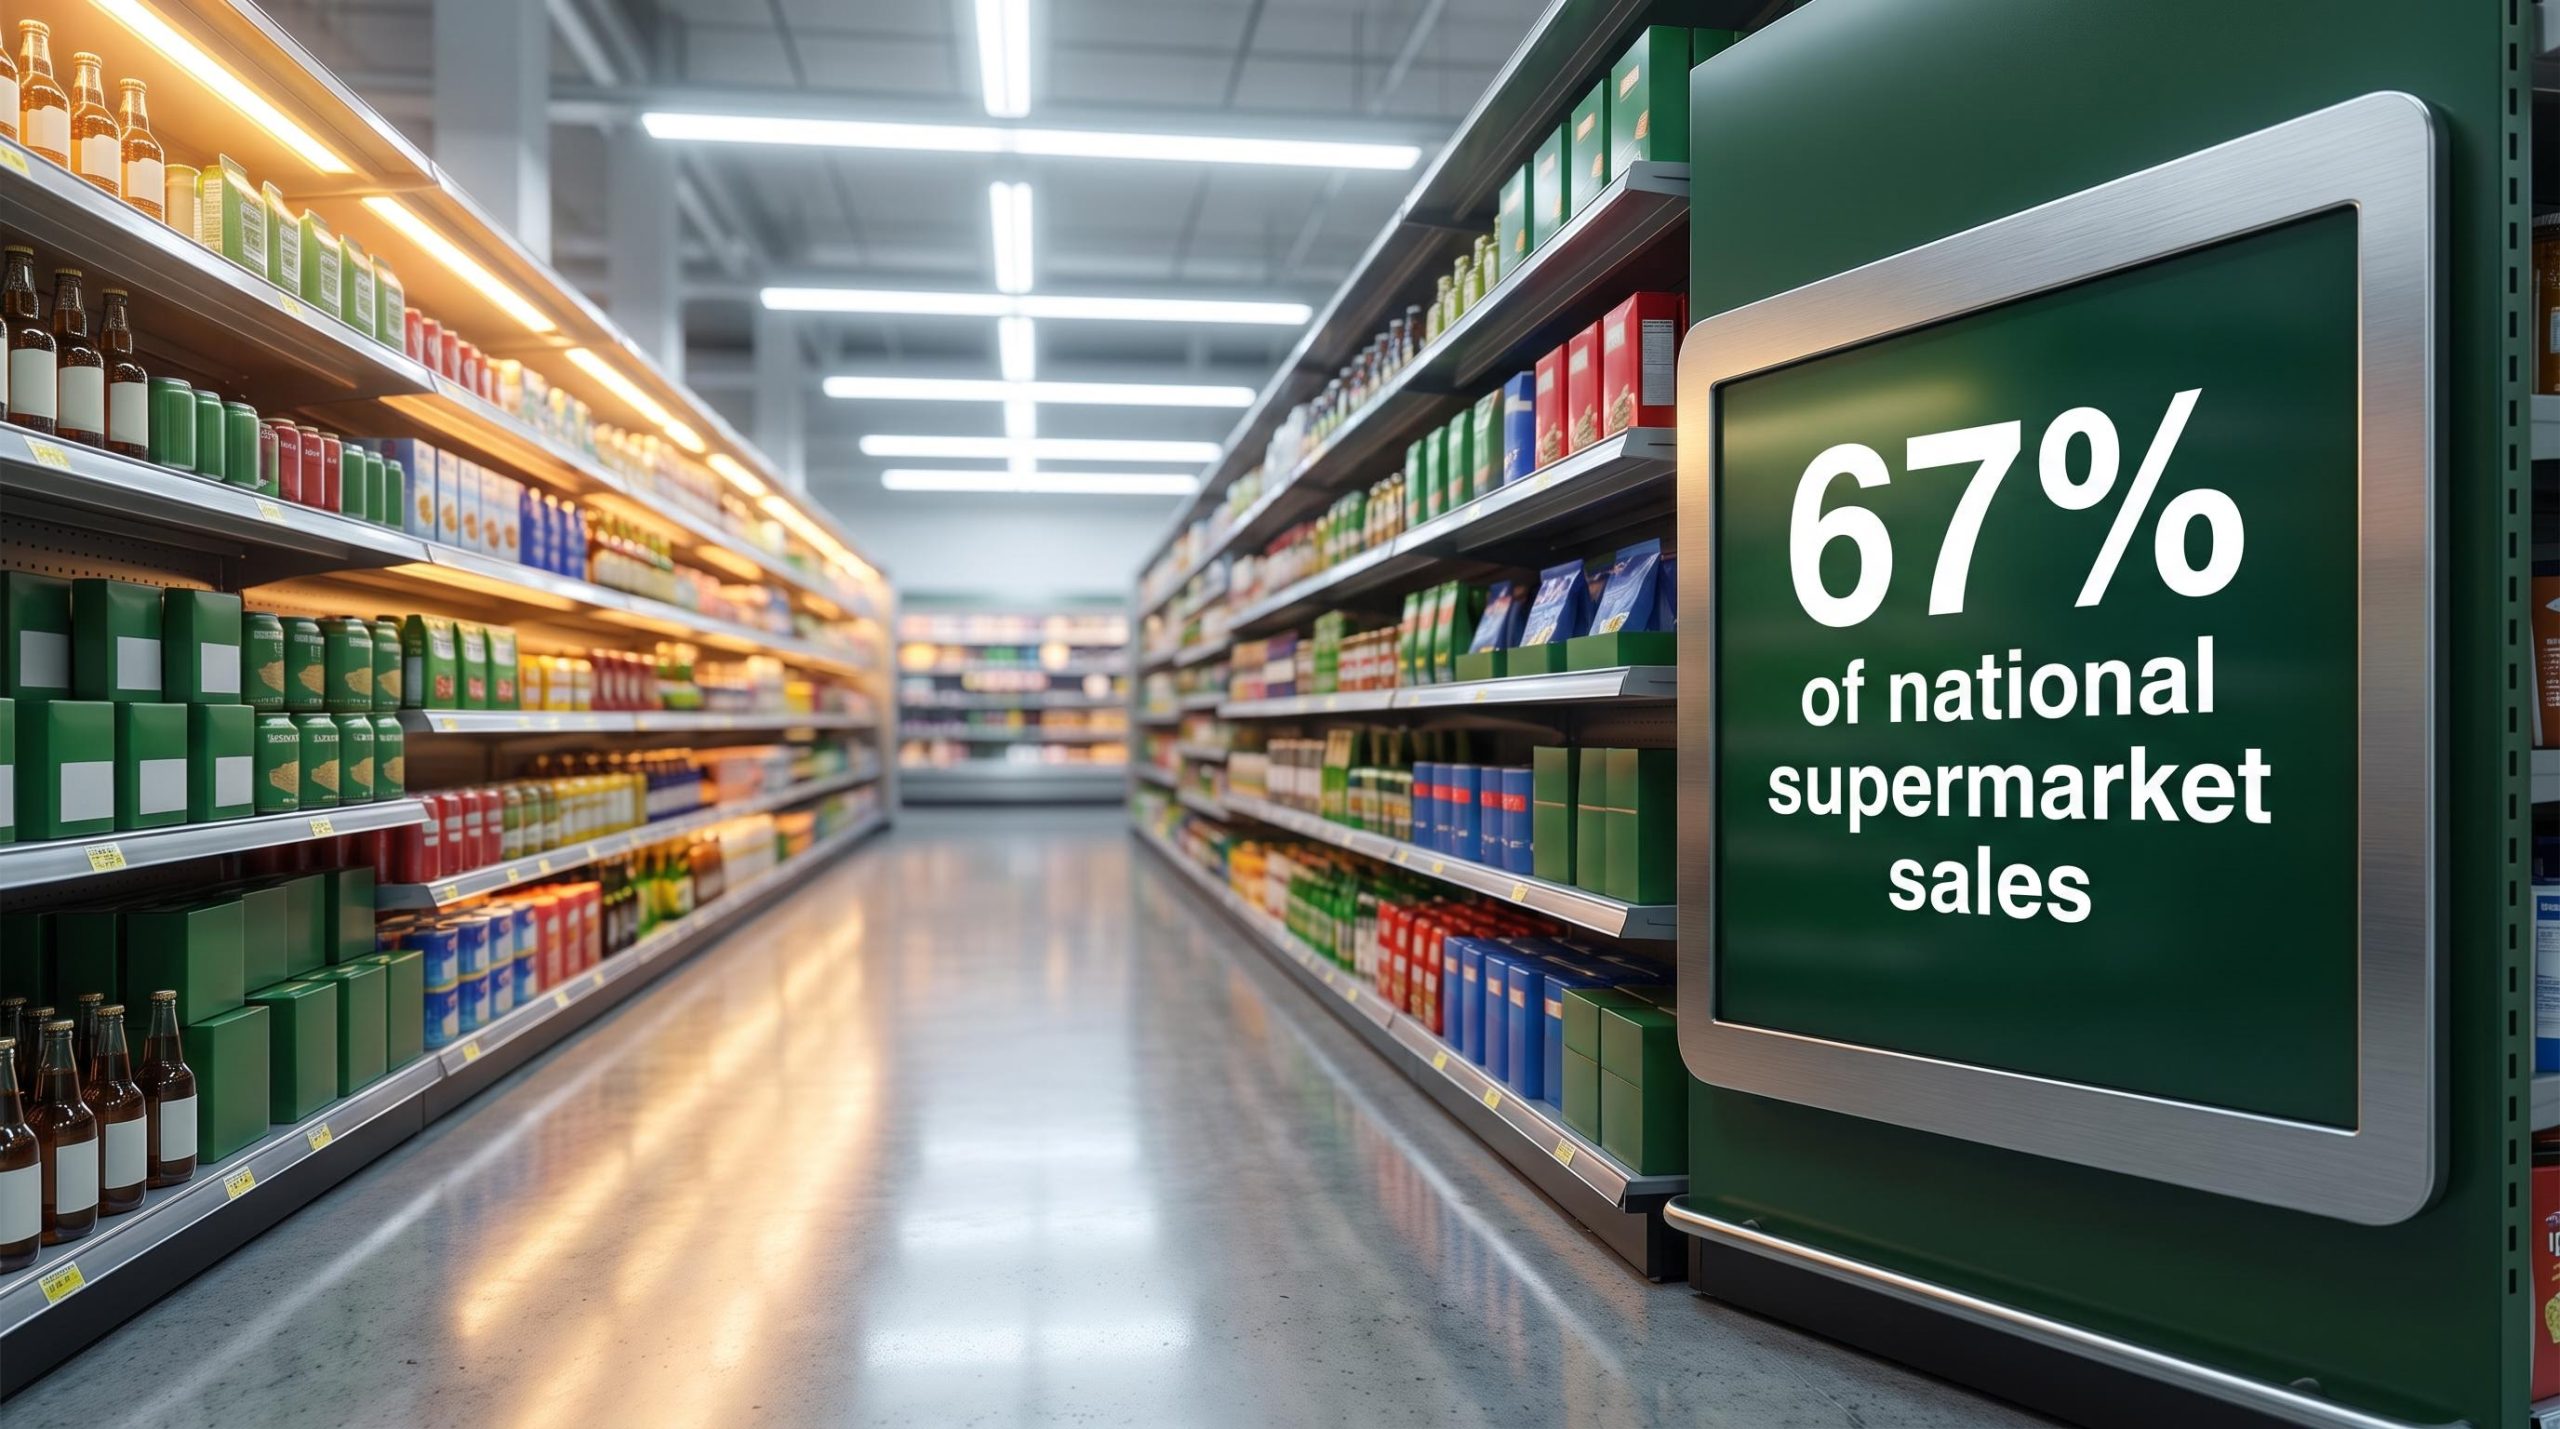
The Australian supermarket sector gained approximately 17.5% year to date during the original reporting period, but the concentration of those returns tells a story the headline number obscures. Woolworths and Coles together hold roughly 67% of national supermarket sales, according to the Australian Competition and Consumer Commission (ACCC), with Woolworths at approximately 38% and Coles at approximately 29%. That concentration is not a static snapshot of size. It is a compounding asset, and the market is pricing it accordingly.
Here is the framework for deciding whether the duopoly’s structural advantages justify current valuations, or whether regulatory and competitive risks represent an underpriced threat. The analysis covers how scale compounds in grocery specifically, why the margin gap is widening rather than narrowing, and the five metrics that matter most when reading the next earnings update.
Why Australia’s grocery market rewards scale above almost anything else
Grocery spending is non-discretionary. When higher interest rates and cost-of-living pressures compress household budgets, consumers cut discretionary retail first. They do not stop buying food. That gives Woolworths and Coles a base layer of earnings resilience that most listed sectors cannot claim, and it is the starting condition for everything that follows.
The non-discretionary floor that protects earnings
Food demand holds even when consumer confidence falls. Population growth adds a volume tailwind on top of that stability, giving the two majors incremental revenue without requiring them to take share from each other or from independents. Both chains delivered approximately 3.6% top-line growth in H1 2026, a steady result in a market where discretionary retailers were reporting flat or negative comparable sales.
ASX consumer staples returns tell a more complicated story than the defensive label implies: the S&P/ASX 200 Consumer Staples Index returned -1.57% per year over five years to May 2026, against 3.91% annually for the broader ASX 200, a gap that separates the sector’s earnings resilience from its capital return record.
What transforms that defensive base into a structural advantage is concentration. The ACCC’s market share data makes the mechanism visible:
Woolworths and Coles together account for roughly 67% of national supermarket sales, giving them procurement leverage, pricing influence, and fixed-cost economics that no independent competitor can replicate.
That concentration translates into three self-reinforcing scale advantages:
- Supplier bargaining power: The two majors negotiate buying terms across a combined volume base that dwarfs any competitor, securing lower input costs on thousands of product lines
- Pricing influence: With control over more than two-thirds of shelf space nationally, both chains shape consumer price expectations across the basket
- Fixed-cost spreading: Distribution networks, technology platforms, and head-office functions are spread across far greater revenue, lowering the per-unit cost of operations with each incremental dollar of sales
Both majors rank among the most profitable supermarket operators globally on key margin metrics. That is not an accident of pricing alone. It is scale doing what scale does in a non-discretionary category: compounding.
When big ASX news breaks, our subscribers know first
The private-label and digital flywheel: how the margin gap compounds
The margin story in Australian supermarkets is often reduced to a pricing-power argument. The actual mechanism is more specific, and more durable.
As household budgets tighten, price-sensitive shoppers shift away from branded products toward lower-cost options. Because Woolworths and Coles own extensive ranges of private-label goods across every tier of the basket, that migration stays within the supermarket’s own portfolio, and private-label lines typically generate stronger gross margins than the branded products they replace. The consumer trades down in price; the retailer trades up in margin.
The compounding logic runs in three stages:
- Cost pressure pushes shoppers toward private-label products
- Private-label carries higher gross margins than branded equivalents, expanding profitability even as basket sizes compress
- Digital data from loyalty programmes deepens targeting and promotional effectiveness, reinforcing the next cycle of purchase behaviour
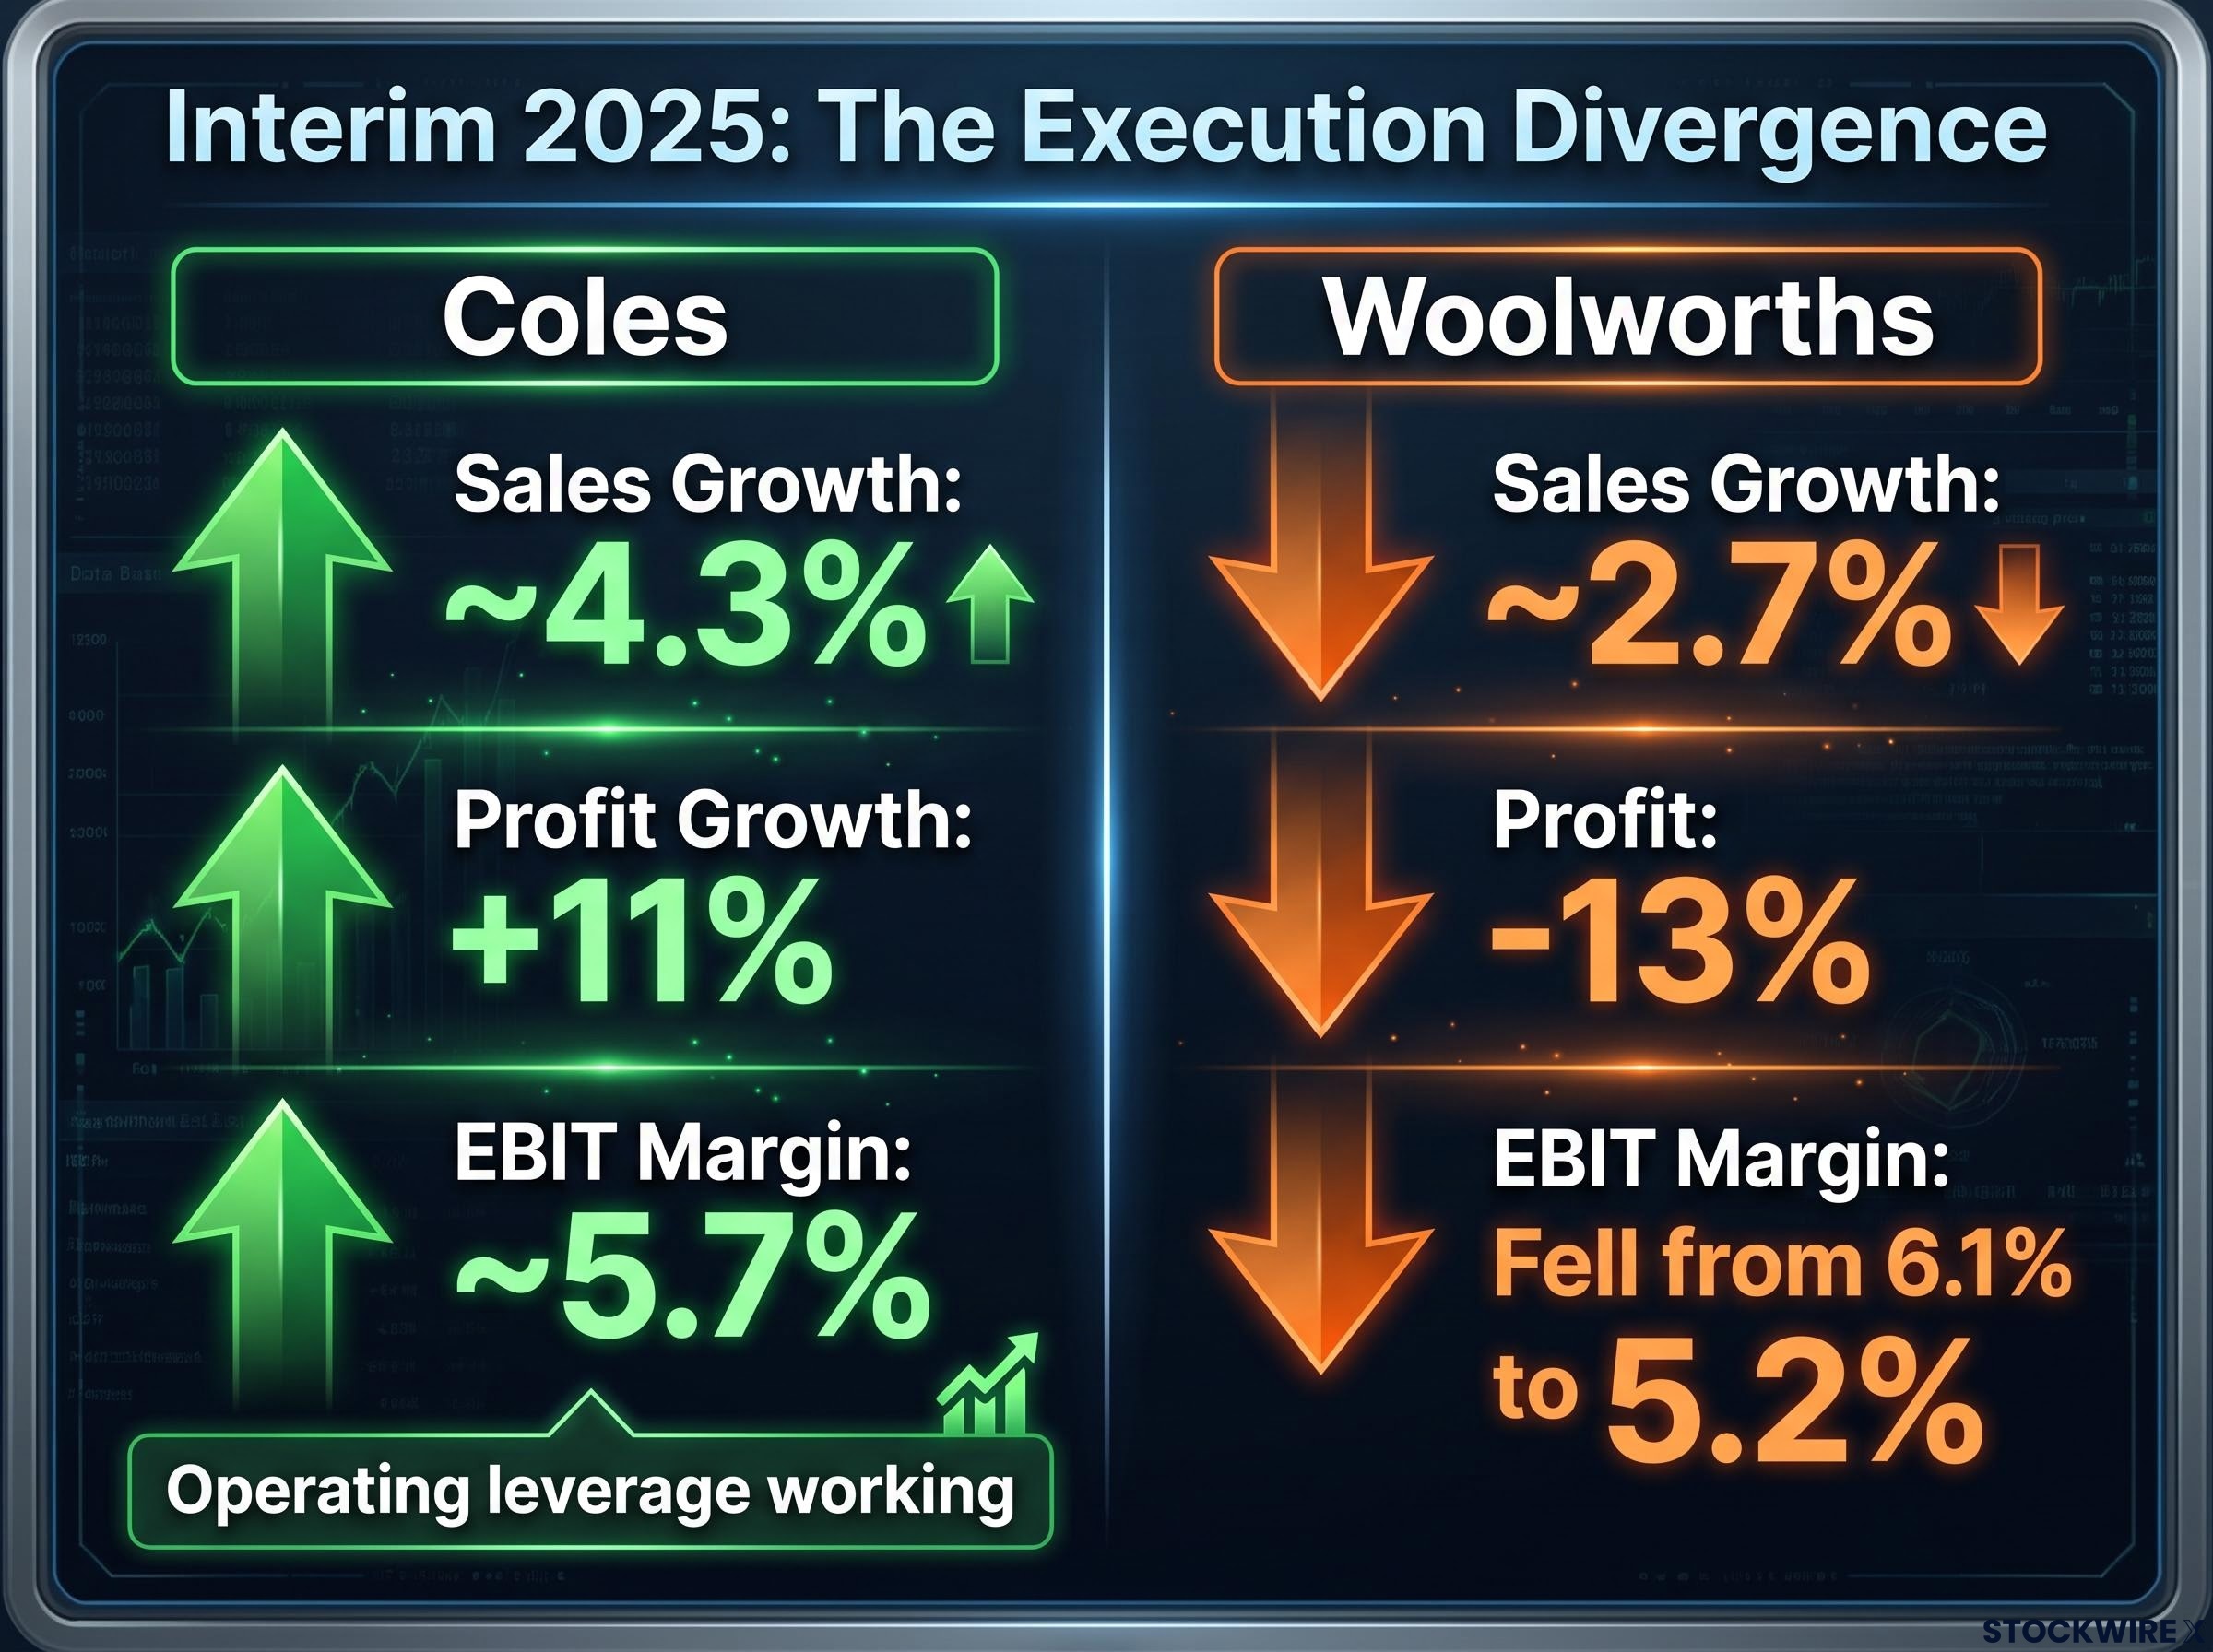
Coles’ interim 2025 result illustrates what this looks like in financial terms: 4.3% sales growth produced 11% profit growth and EBIT margin expansion to approximately 5.7%. That operating leverage, profit growing at more than double the rate of revenue, is the clearest available signal that the private-label and mix strategy is working.
Coles online sales grew approximately 27% in H1 2026, reaching approximately $2.8 billion, while the broader supermarket business grew approximately 3.6%.
That digital growth is not simply an add-on channel. Coles’ Flybuys loyalty programme exceeded 10 million active members, growing approximately 6.2%. Each transaction generates behavioural data that feeds back into assortment, pricing, and promotional decisions, creating switching costs that independents cannot replicate.
| Metric | Coles Interim 2025 | Coles H1 2026 | Woolworths Interim 2025 |
|---|---|---|---|
| Sales growth | ~4.3% | ~3.6% | ~2.7% |
| Profit growth / EBIT margin | +11% profit growth; margin ~5.7% | Improving profitability | -13% profit; margin fell from 6.1% to 5.2% |
| Online growth | N/A (earlier period) | ~27% to ~$2.8B | N/A |
The cost of building and maintaining digital platforms, last-mile logistics, and data science capability is capital-intensive. That is the point. It creates a barrier that smaller competitors cannot cross by simply matching the spend, because they lack the volume base to spread those fixed costs efficiently.
Woolworths’ interim 2025 result offers an instructive contrast: operating profit fell 13% and margins declined from 6.1% to 5.2%, a reminder that execution and mix can produce divergent outcomes even within the same duopoly. The structural advantage is real, but it does not run on autopilot.
The COL versus WOW valuation divergence reached a striking extreme in September 2025, with Coles at record highs and Woolworths near a six-year low, and the subsequent half-year results confirmed that the gap reflected genuine earnings differences rather than sentiment drift.
What the Metcash divergence tells investors about structural moat depth
Metcash shares declined approximately 10% year to date during the original reporting period. Over the same window, Woolworths gained roughly 31% and Coles added approximately 5.3%. The market is not making a judgment about Metcash’s management. It is pricing the structural gap between wholesale-dependent networks and vertically integrated scale operators.
The mechanisms are specific. Independent grocers supplied by wholesalers like Metcash face higher unit costs because their aggregate buying power is weaker. Their private-label programmes lack the breadth and marketing investment to capture the trade-down dynamic the way the majors do. Their digital and loyalty infrastructure generates less customer data, which limits their ability to personalise pricing and promotions. And they cannot spread automation capital expenditure across comparable volume.
| Duopoly structural advantages | Structural constraints on independents |
|---|---|
| Deep private-label portfolios across value, core, and premium tiers | Narrow own-brand ranges with limited marketing support |
| Scaled digital platforms with loyalty data exceeding 10 million active members | Limited online capability and fragmented customer data |
| Automated distribution spreading fixed costs across national volume | Higher per-unit fulfilment costs on smaller throughput |
| Procurement leverage across ~67% of national sales | Weaker supplier terms on lower aggregate volume |
Automation as structural moat, not just cost management
Both Woolworths and Coles have invested heavily in automated distribution and picking systems. These investments reduce labour intensity, improve inventory accuracy, and lower the cost-to-serve per unit across both store replenishment and online fulfilment.
The fixed costs of automation are significant. But spread across the majors’ national volume, the per-unit savings compound with each additional transaction. An independent network attempting to close that gap through catch-up investment faces a structural problem: the same capital expenditure buys less efficiency at lower volume. The gap is not closing. ACCC documents confirm that the duopoly’s margins rank among the highest globally on international benchmarks, and automation is a meaningful contributor.
Metcash’s share price decline is not a verdict on one company. It is the market pricing in that the barriers facing any challenger to Woolworths and Coles are rising each year, not falling, as automation and digital investment compound.
Five metrics that matter when evaluating Australian supermarket stocks
The structural thesis above gives investors a framework for understanding why the duopoly commands a premium. Translating that into a repeatable evaluation process for future earnings updates requires knowing which lines to read first.
Coles delivered 4.3% sales growth and 11% profit growth in its interim 2025 result. That ratio, profit growing at more than double the rate of revenue, is the benchmark for what operating leverage looks like in Australian grocery.
Here are the five metrics in priority order:
- Operating leverage ratio: In a mature grocery market where top-line growth sits in the low-to-mid single digits, profit growing faster than revenue is the primary signal that mix, private-label penetration, and efficiency gains are translating into margin expansion. Track the ratio, not just the headline sales number.
- Private-label mix and value-range commentary: Detailed private-label penetration data is not always disclosed, but margin trends and management commentary on value ranges provide the signal. Rising margins without aggressive price inflation confirm that basket migration toward higher-margin formats is working.
- Online growth versus store growth: Coles’ approximately 27% online growth in H1 2026 against approximately 3.6% store growth illustrates the digital divergence. Track not only the revenue split but also commentary on fulfilment efficiency, last-mile costs, and loyalty membership growth (Flybuys exceeded 10 million active members, up approximately 6.2%).
- Automation and capital allocation: Sustained investment in automated distribution, store technology, and data infrastructure maintains cost advantages as wage and logistics cost inflation persists. Commentary on the balance between shareholder returns and structural investment signals management’s time horizon.
- Regulatory backdrop: The ACCC inquiry into pricing practices, supplier relationships, and market transparency is an active variable, not a resolved one. Developments belong in valuation multiple scenario analysis.
The ACCC pricing conduct ruling on Coles’ Down Down program in May 2026 illustrated the distinction between theoretical regulatory risk and active legal exposure: the Federal Court found price increases were commercially justifiable but identified a promotional timing breach, leaving civil penalty risk unresolved and the regulatory backdrop more specific than a general inquiry threat.
Investors who track only headline sales growth when reading Woolworths or Coles results are watching the wrong line. The operating leverage ratio and private-label commentary are where the structural thesis is either being confirmed or tested.
Regulatory risk: how to size it without overstating it
The ACCC’s supermarket inquiry has placed the duopoly’s combined market share, profitability, and pricing practices under active scrutiny. The commission’s findings point to concerns about price transparency, the relationship between retail prices and input costs, and the potential for incumbents to exploit bargaining power over suppliers.
Woolworths’ submissions to the ACCC argue that the company has seen no material increase in its EBIT margin over five years, a position that sits in tension with international margin comparisons and the political perception that Australian supermarket margins are elevated by global standards.
For valuation purposes, regulatory risk is best sized as a range of outcomes. At the mild end, transparency requirements and strengthened codes of conduct increase compliance costs without materially compressing margins. At the tail, structural remedies could constrain pricing practices more aggressively, though such measures remain low probability. The scenario belongs in your multiple analysis, not as a binary bet.
Where the duopoly thesis holds and where it could break
The compounding moat argument rests on four reinforcing pillars: scale-driven procurement, private-label margin capture, automation economics, and digital capability. Each strengthens the others, and the gap versus independents is measurably wider today than five years ago. No structural mechanism currently in place is reversing it.
Both Woolworths and Coles delivered approximately 3.6% Australian Food growth in H1 2026. Near-identical top-line performance means future share price divergence between the two will be driven by execution on margins, digital returns, and capital allocation, not by revenue competition.
Two specific conditions would weaken the thesis:
- Material regulatory compression: If ACCC-driven intervention constrains pricing practices enough to push EBIT margins sustainably below the current 5-6% range, the structural premium in both stocks’ valuations would need to be re-rated
- Credible new entrant disruption: If an international discount grocer or alternative format scales aggressively enough to undercut the duopoly’s pricing floor across a meaningful portion of the national basket, the concentration advantage loses a degree of pricing power
The forward variable investors should monitor most closely is whether margin expansion continues alongside digital and automation investment, or whether the capital intensity of those programmes begins to compress near-term profitability. Woolworths’ interim 2025 margin decline from 6.1% to 5.2% is a reminder that execution risk is real even when structural positioning is strong.
The duopoly’s advantages are durable. They are also priced with conviction. Knowing the specific conditions that would challenge the thesis is what separates a held position from an unexamined one.
Institutional investors have been building a contrarian case for ASX supermarkets precisely because cost-of-living headwinds and regulatory overhang have pushed consumer staples price-to-earnings multiples toward multi-year lows, with Franklin Templeton and Morningstar Investment Management treating the depressed valuations as a structural entry signal rather than a warning.
This article is for informational purposes only and should not be considered financial advice. Investors should conduct their own research and consult with financial professionals before making investment decisions. Past performance does not guarantee future results, and financial projections are subject to market conditions and various risk factors.