
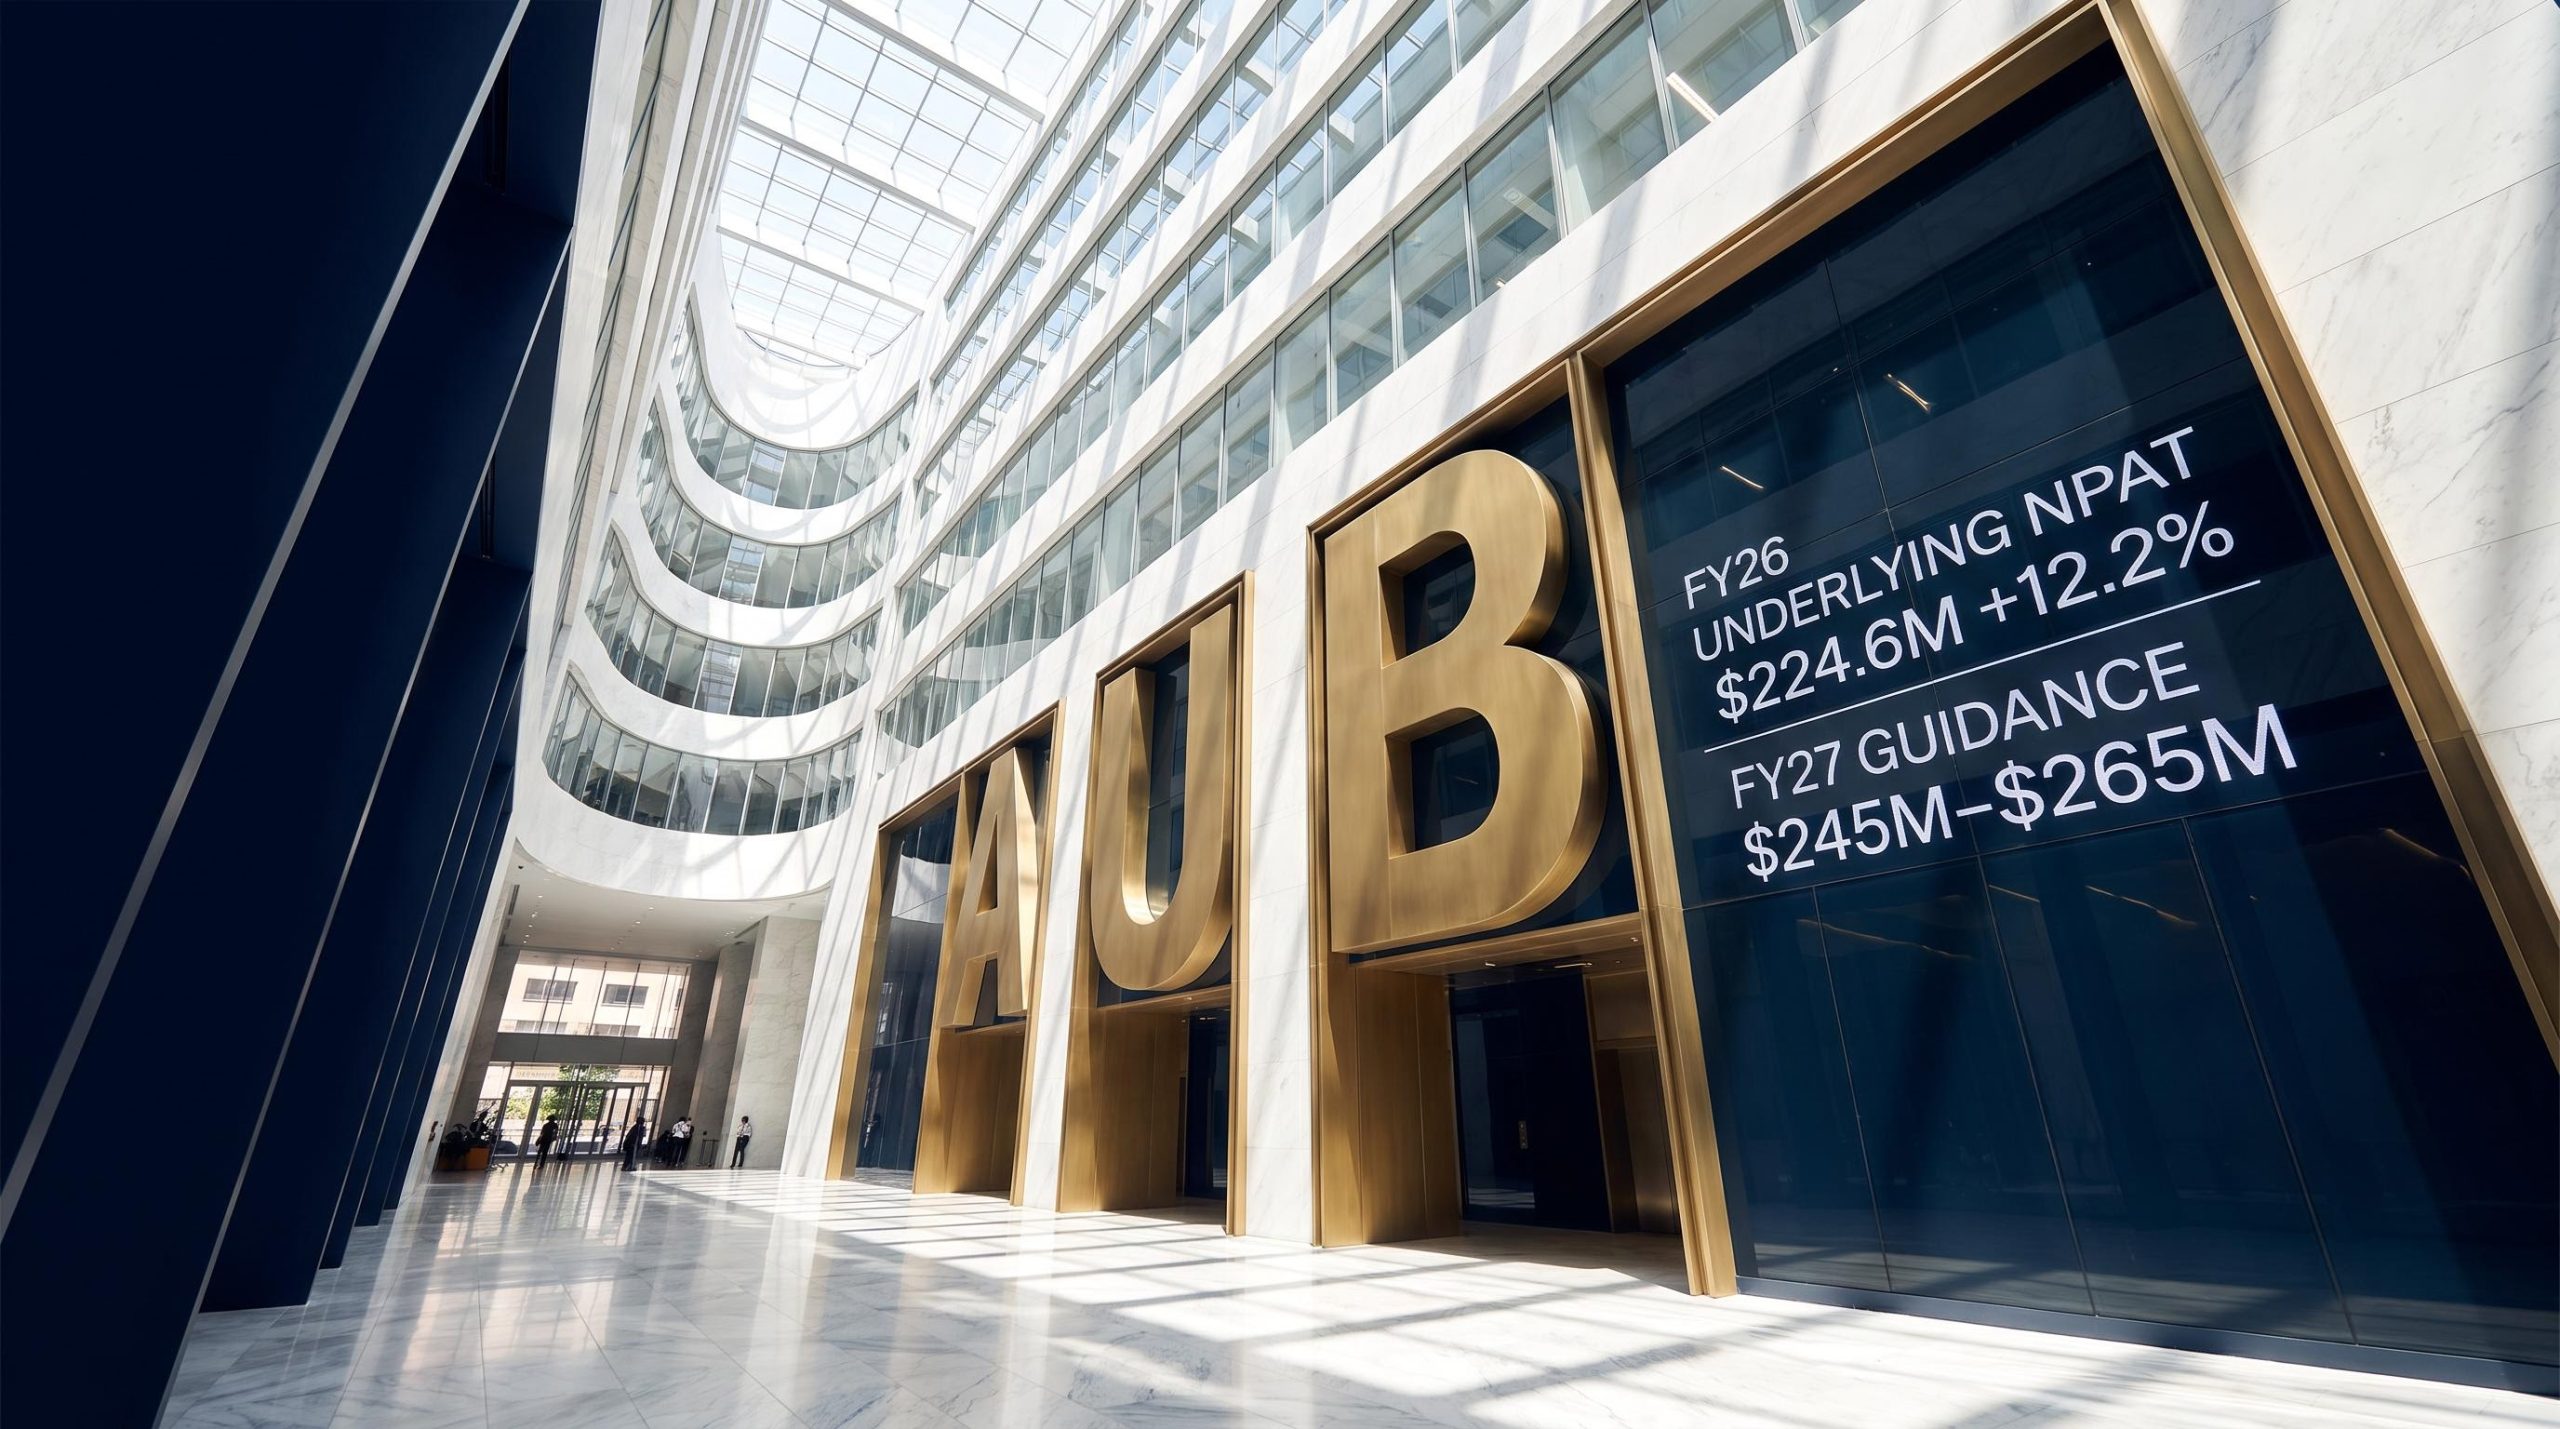
AUB Group delivers 12.2% underlying profit lift in FY26 results presentation
In its FY26 investor presentation delivered on 25 August 2026 by CEO and Managing Director Mike Emmett and CFO Nick Dryden, AUB Group (ASX: AUB) reported a 12.2% rise in underlying net profit after tax (NPAT) to $224.6m, with EBIT margin expanding 140bps to 36.1%.
The insurance broking and underwriting group now operates a global distribution platform across 17 countries and ~640 locations, with ~7,000 insurance professionals placing more than $11bn in premiums for ~1.6m clients.
Management also outlined FY27 guidance for underlying NPAT of $245m–$265m, signalling continued earnings growth for the year ahead.
When big ASX news breaks, our subscribers know first
FY26 financial highlights at a glance
AUB delivered growth across each headline metric, driven by operating leverage and acquisition contributions. Underlying earnings per share (EPS) grew 7.0%, a figure partially diluted by the additional shares issued to fund the Prestige acquisition.
| Metric | FY26 | FY25 | Change | Note |
|---|---|---|---|---|
| Revenue | $1,596.6m | $1,501.3m | +6.4% | Growth across all divisions (ex-FX) |
| EBIT Margin | 36.1% | 34.7% | +140bps | Up across most divisions |
| Underlying NPAT | $224.6m | $200.2m | +12.2% | Operating leverage plus acquisitions |
| Underlying EPS | 183.69c | 171.75c | +7.0% | Partly diluted by Prestige shares |
| Dividend per Share | 98.0c | 91.0c | +7.7% | Within 50–70% payout policy |
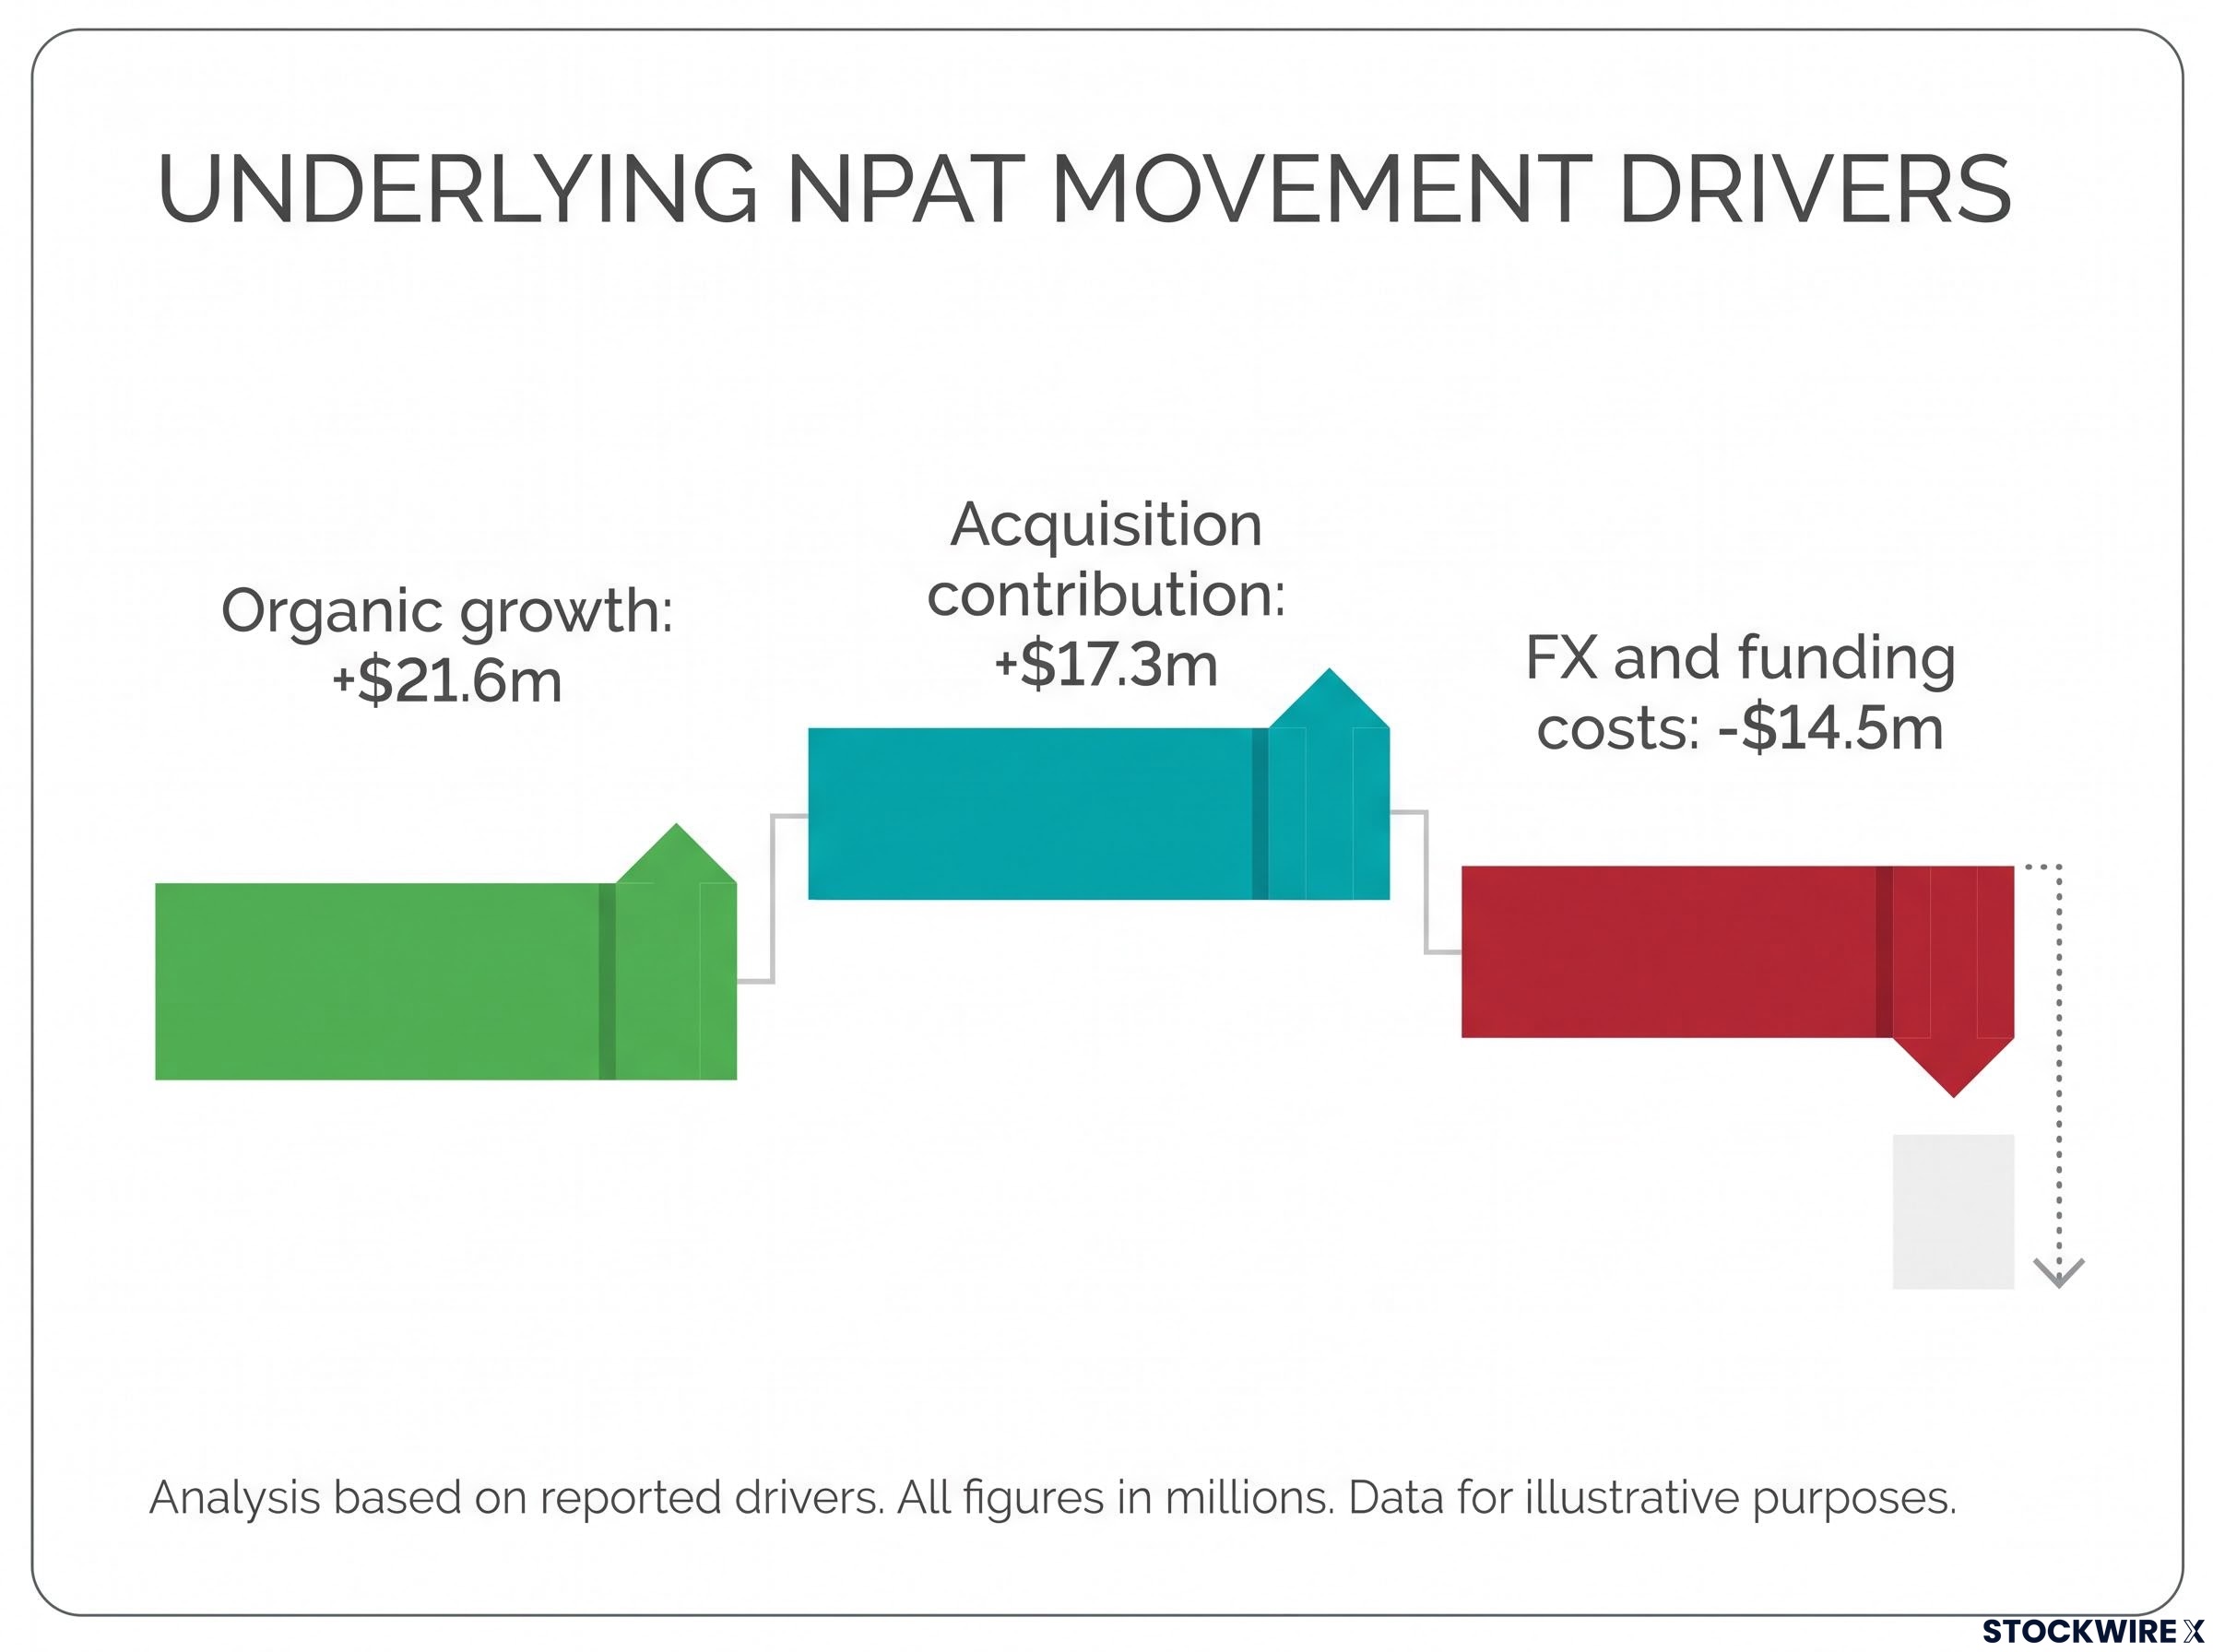
The company presented the movement in underlying NPAT across three drivers:
-
Organic growth: +$21.6m (+10.8%)
-
Acquisition contribution: +$17.3m (+8.6%)
-
FX and funding costs: –$14.5m (–7.2%) (FX –$9.5m; funding –$5.0m)
Organic performance generated most of the earnings uplift, with acquisitions adding further growth before FX and funding headwinds partly offset the result.
How AUB’s four divisions performed
The divisional review showed strong profit growth in International, BizCover, Australian Broking and Agencies, muted by continued weakness in New Zealand. The following table summarises the reported divisional results.
| Division | Revenue | EBIT Margin | PBT Growth | Note |
|---|---|---|---|---|
| Australian Broking | $647.8m (+6.0%) | 38.1% (+30bps) | +10.0% | Revenue outpaced expenses |
| BizCover | $120.7m (+14.0%) | 47.8% (+200bps) | +19.9% | Client scale + offshore margin |
| Agencies | $240.9m (+9.2%) | 43.7% (–50bps) | +8.4% | 46.5% ex-Strata (+80bps) |
| International | $494.9m (+6.2%) | 27.6% (+410bps) | +19.6% | Marine/aviation strength |
| New Zealand | $92.3m (–5.7%) | 33.1% (–130bps) | –3.9% (AUD) | +2.7% in NZD |
International the standout
The International division was the standout performer, with EBIT rising 24.5% and margin expanding 410bps to 27.6%. Management attributed the result to robust growth at Tysers across the marine and aviation segments, supported by elevated war rates.
The division also completed the Prestige acquisition in March 2026, significantly scaling UK Retail, alongside the Ronesans investment strengthening Tysers capability in Turkey.
The Prestige acquisition completion in March 2026 established AUB’s first operational foothold in the United Kingdom, adding a diversified broking and underwriting platform that closely mirrors the group’s existing Australian business model and is expected to ease integration and synergy realisation across the International division.
New Zealand the work-in-progress
New Zealand remained the work-in-progress. Reported profit before tax fell 3.9% in AUD terms following adverse FX movements, though in local currency PBT actually rose 2.7% to NZD 26.1m against a challenging corporate market.
Management outlined a three-part FY27 improvement plan: reset NZbrokers by restructuring the network and strengthening alignment with Australian Broking, restore cost discipline, and optimise the portfolio by concentrating investment behind higher-return businesses.
Understanding AUB’s owner-driver model
For readers less familiar with the sector, AUB sits within the insurance distribution part of the value chain. The group sources, designs and distributes insurance products on behalf of underwriters without taking on underwriting, prudential capital requirements or claims risk.
Central to the business is its “owner-driver model”, in which AUB holds equity in entrepreneur-led businesses while local operators retain their leadership and client relationships. The group comprises 89 businesses, made up of 45 partner brokers and 44 agencies and MGAs.
Why does this matter to investors? This capital-light, fee-and-commission structure supports resilient, high-margin earnings, reflected in the group’s 36.1% EBIT margin. The presentation set out the illustrative economics retained across the chain:
-
~15% retained by retail brokers
-
~15% retained by agencies
-
~10% retained by Tysers
A seven-year transformation and the margin runway ahead
Management framed the current results within a seven-year transformation from FY19 to FY26, spanning a portfolio refocus, the BizCover and 360 acquisitions, the Tysers wholesale platform, and the scaling of UK Retail via Momentum, Movo and Prestige.
Over that period, group EBIT margin expanded 920bps, from 26.9% in FY19 to 36.1% in FY26, with revenue and profit compounding strongly.
| Metric | FY19 | FY26 | Growth |
|---|---|---|---|
| Revenue | $541.6m | $1,596.6m | 16.7% CAGR |
| Underlying NPAT | $46.7m | $224.6m | 25.1% CAGR |
| EBIT Margin | 26.9% | 36.1% | +920bps |
| EPS | 65.74c | 183.69c | 15.8% CAGR |
| Dividend | 46.0c | 98.0c | 11.4% CAGR |
The presentation also set out the medium-term segment margin targets management aims to close:
-
Australian Broking: 40%
-
BizCover: 50%
-
New Zealand: 42%
-
Agencies: 47%
-
International: 32%
AI moving from foundation to impact
Management outlined progress on the group’s AI strategy, positioning it as moving from foundations towards operational impact rather than a standalone product launch. The presentation cited several measures of adoption:
-
92% Copilot utilisation
-
43 active AI agents
-
40+ solutions in the pipeline
-
710 hours of capacity released in the last 30 days
Delivery is anchored on the Microsoft 365 Copilot platform as the enterprise AI interface, the Nexus data platform building AI-ready data across Australia, the UK and New Zealand, and CoverNet, acquired with Prestige, supporting complex models and integrations.
Balance sheet strength and shareholder returns
AUB detailed a funding position designed to preserve capacity for future growth. The group held $330.5m of corporate liquidity at 30 June 2026, with a leverage ratio of 2.30x.
Its $1,097m syndicated facility was refinanced in June 2026, attracting more than $1.5b of lender commitments during syndication, while a $200m Macquarie bilateral facility was established to support the Prestige acquisition.
Shareholder returns rose in step with earnings. The full-year dividend reached 98.0 cents (interim 27.0c, final 71.0c), aligned with the group’s payout policy of 50–70% of underlying NPAT.
What AUB has guided for FY27
Looking ahead, management guided to FY27 underlying NPAT of $245m–$265m, with a midpoint of $255m, representing growth of 9.1%–18.0% over FY26 (13.5% at the midpoint).
The guidance bridge assumes organic growth of +6.8%–14.8%, acquisition growth of +7.8%–8.7%, and a –5.5% drag from FX and funding costs. FY27 underlying EPS guidance of 187.54c–202.85c reflects the dilution impact of the March 2026 Prestige equity funding.
Management summarised three execution priorities for FY27:
-
Integrate and scale International, completing UK Retail integration and expanding Tysers
-
Improve portfolio performance by accelerating Agencies and restoring New Zealand
-
Compound value through disciplined capital deployment and technology
AUB backs exceptional owner-led businesses with the capital, market access and group-wide capabilities to grow and compound value over the long term.
Stay Ahead on ASX Finance and Insurance News
Breaking ASX announcements hit inboxes within minutes via Big News Blast, complete with in-depth analysis so the work is already done. Join 20,000+ subscribers receiving FREE real-time alerts the moment market-moving financial news drops. Click the “Free Alerts” button to get ahead of the market before the next major ASX finance announcement lands.