Between March 2022 and March 2023, the Federal Reserve raised interest rates at the fastest pace in four decades. The federal funds rate climbed from near zero to above 4.5% in under a year. Gold, the asset that supposedly falls when rates rise, finished that stretch higher than where it started.
If your mental model for gold begins and ends with “rates up, gold down,” that period should have broken it. It did not break the model. It revealed the model most people use is incomplete.
The relationship between interest rates, the US dollar, and gold is one of the most discussed connections in investing, and one of the most commonly oversimplified. Most explanations stop at the surface: the Fed raises rates, the dollar strengthens, gold falls. That framework is not wrong, but it misses the conditions under which it breaks, the variable that actually drives gold’s opportunity cost, and the free tool that lets you see where rate expectations sit before the Fed even speaks.
Here is the complete version. After working through this, you will have a functional mental model for understanding why gold moves when the Fed acts, what to watch beyond the headline rate number, and how to track where rate expectations are heading in real time using a publicly available tool.
What the Fed funds rate actually is (and what it is not)
Most people picture the federal funds rate as a single number the Federal Reserve hands down from a podium. The reality is more precise, and that precision matters.
At its core, the federal funds rate is the rate governing overnight lending of reserve balances between US depository institutions. Rather than fixing a single number, the Federal Open Market Committee (FOMC) establishes a target range, for example 4.75%-5.00%, within which the actual market rate is expected to operate. The effective federal funds rate, the actual market rate emerging from overnight lending transactions between banks, floats within that range based on real supply and demand for reserves.
Media coverage typically references the upper bound of that range as if it were the whole story, so a headline reading “the Fed funds rate is 5.00%” is citing just one edge of the band. That is a shorthand journalists use, not the complete picture. Understanding the distinction between the target range and the effective rate is what helps you see why markets move before any actual rate change occurs: it is the expected future range that drives positioning, not the current number alone.
The FOMC meets eight times per year, with the ability to call emergency sessions. Its stated inflation target is 2%, consistent with most major central banks globally. The rate it sets functions as the baseline cost of money across the US economy, transmitting outward through:
- Treasury yields: Government bond rates adjust to reflect the current and expected path of the Fed funds rate
- Mortgage rates: Home borrowing costs move in response to longer-term yield expectations shaped by Fed policy
- Corporate borrowing costs: Companies pay more or less to issue debt depending on the rate environment the Fed creates
When big ASX news breaks, our subscribers know first
How rate changes move the US dollar
The chain from a rate change to a currency move follows a logic you can trace step by step.
When US interest rates rise (or are expected to rise), investors around the world have an incentive to move capital into dollar-denominated assets because those assets now offer better returns. That inflow of international capital increases demand for dollars, pushing the dollar’s exchange rate higher. The reverse operates when rates fall or are expected to fall: capital flows out of dollar assets toward currencies offering comparatively better returns, and the dollar weakens.
Here is the sequence:
- Markets form expectations that US rates will rise (or the Fed signals as much)
- International capital flows toward dollar-denominated assets seeking higher yields
- Demand for dollars increases as investors convert local currencies to buy those assets
- The dollar strengthens against major currencies like the euro (EUR/USD) and yen (USD/JPY)
That sequence seems straightforward, but most popular commentary misses the variable that actually matters most.
The dollar moves based on US rates relative to eurozone, UK, and Japanese rates, not US rates in isolation. It is the rate differential across economies that drives currency flows.
This means watching only the Fed’s rate announcement misses half the picture. What the European Central Bank or the Bank of Japan is doing simultaneously is equally important to understanding where the dollar is heading. If the Fed holds rates steady but the ECB cuts, the rate differential widens in favour of the dollar, and the dollar can strengthen without the Fed doing anything at all.
Currency markets frequently price these differentials in advance. By the time a rate decision is announced, the move may already be reflected in exchange rates. The expectation, not the event, is what drives the repricing.
Why gold responds to the dollar and to rates
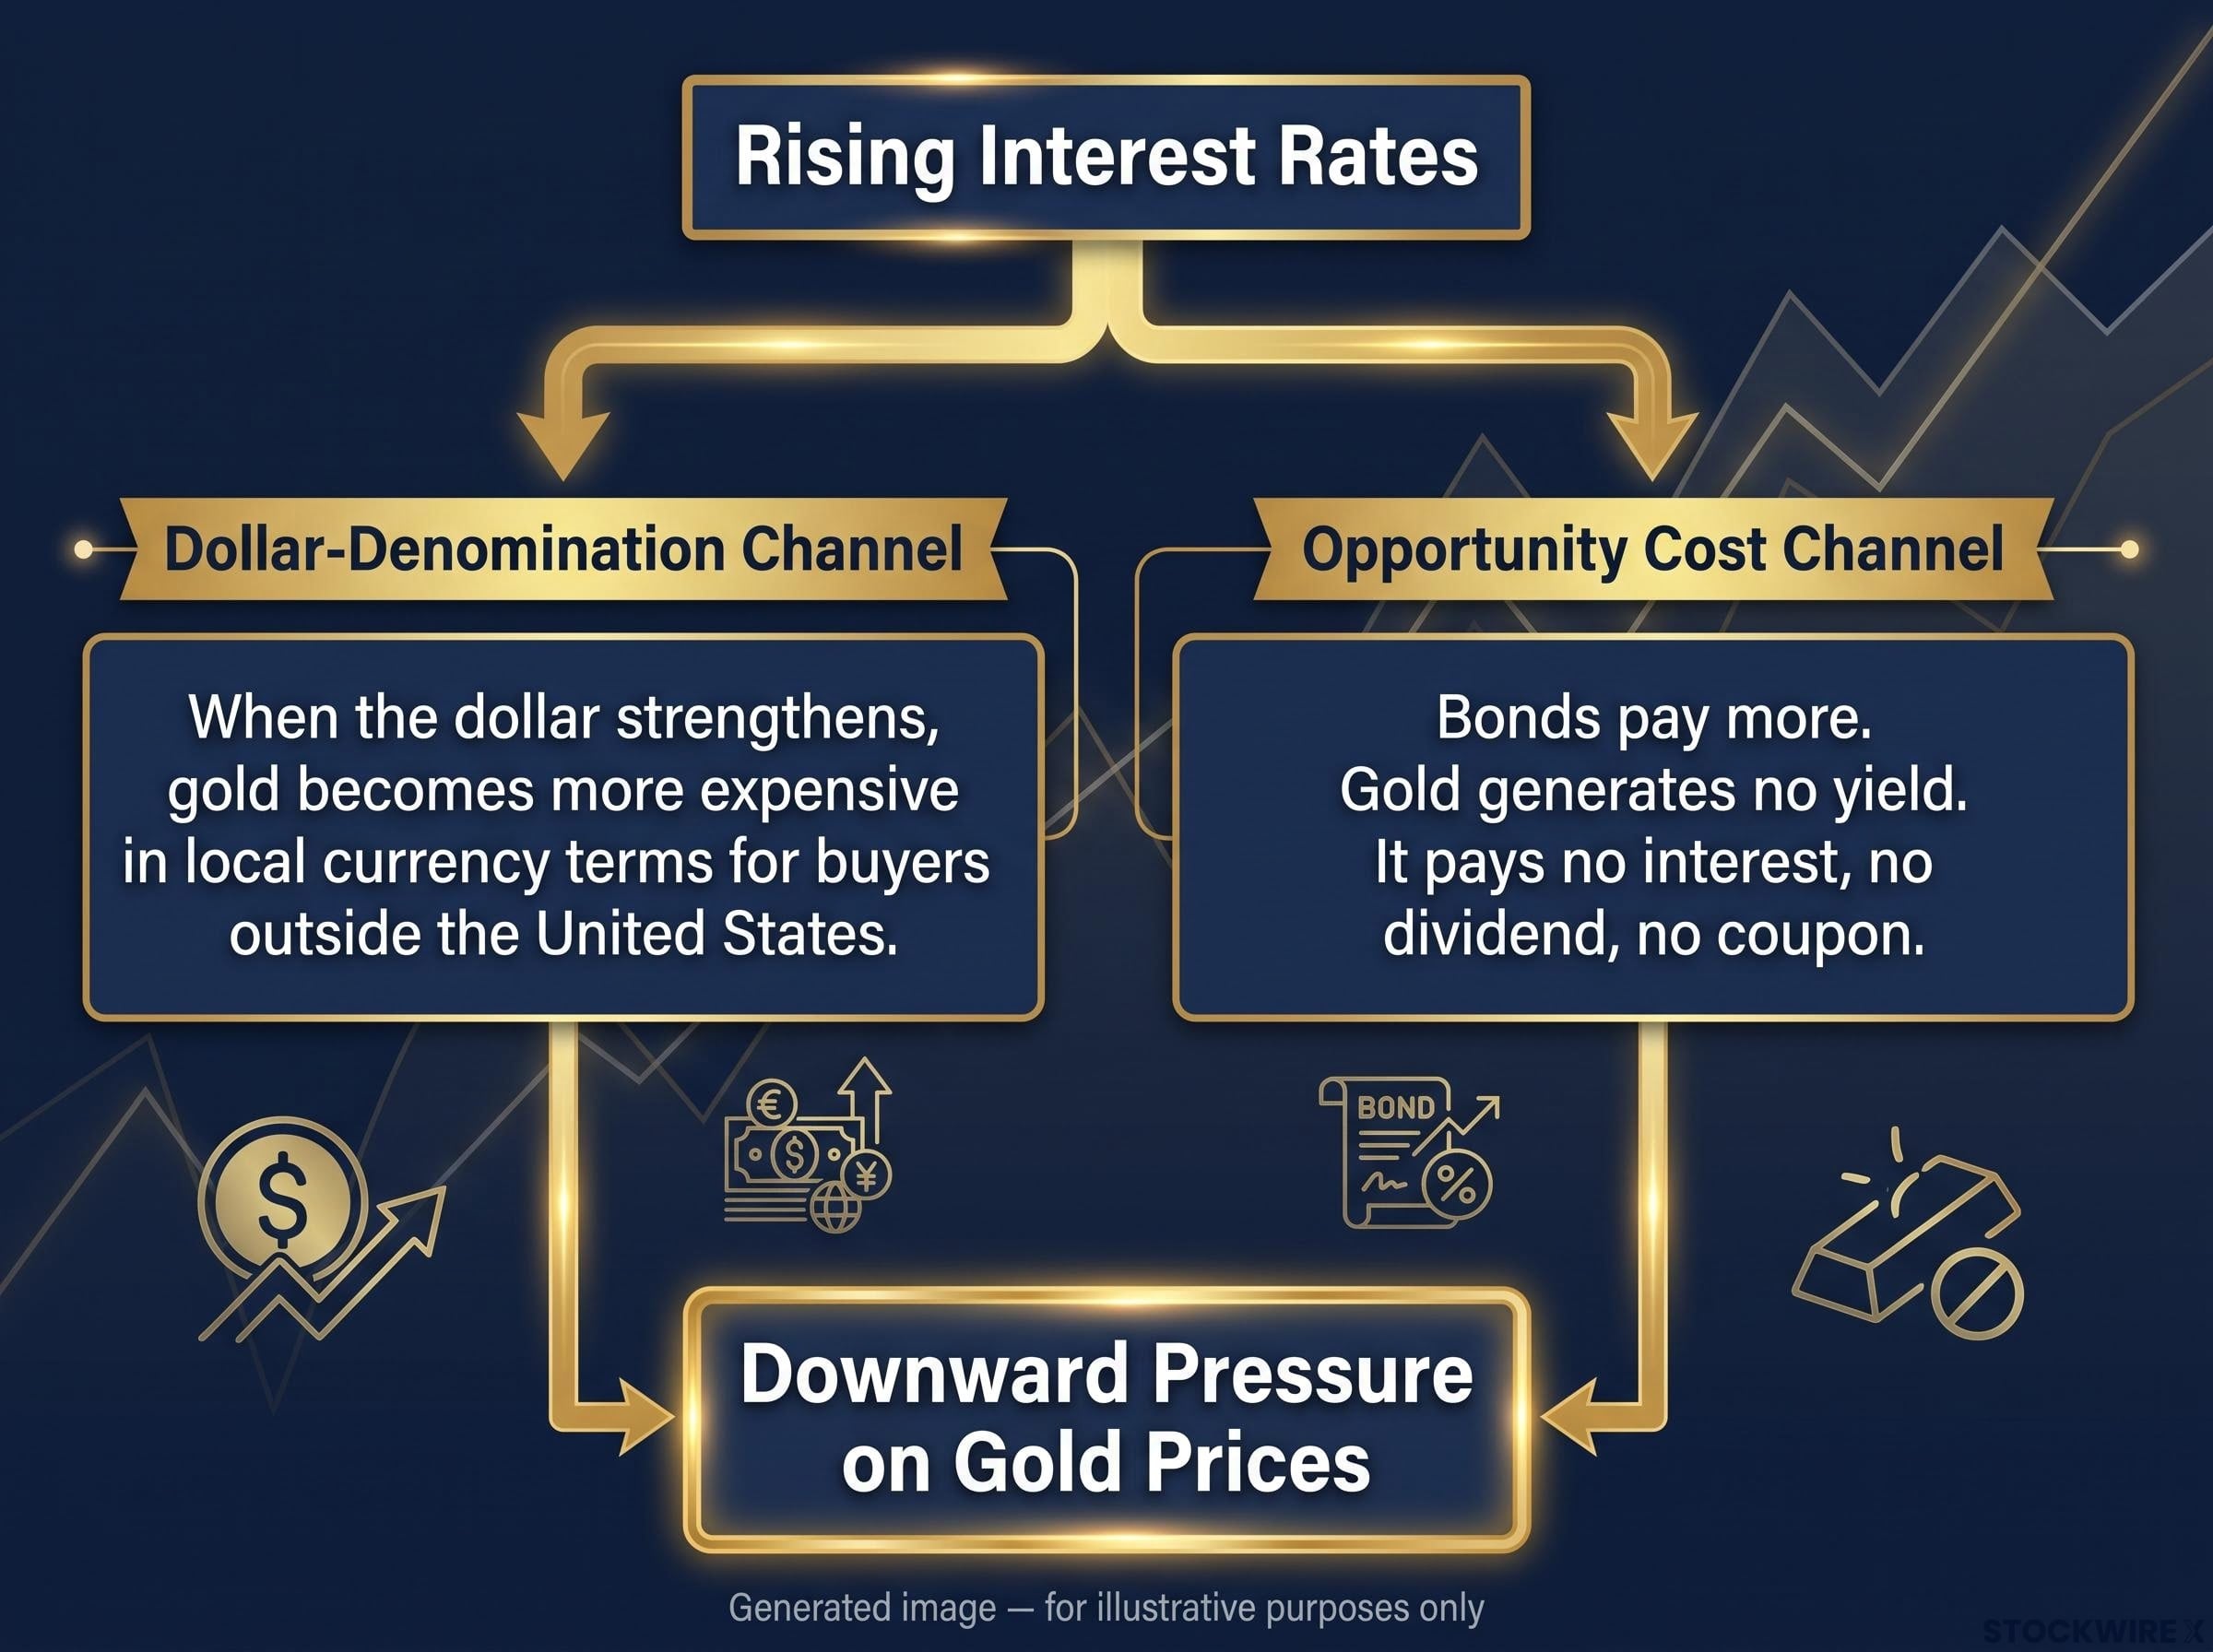
Two separate mechanisms press on gold prices when interest rates change. They work through different channels, but in a rising-rate environment they reinforce each other, and understanding both is what turns the “rates up, gold down” shorthand from a slogan into something you can actually reason with.
The dollar-denomination channel
Gold is priced in US dollars globally. When the dollar strengthens, gold becomes more expensive in local currency terms for buyers outside the United States. A Japanese investor buying gold when the yen is weakening against the dollar faces a higher effective price, which reduces demand and presses gold prices lower. When the dollar weakens, the reverse holds: gold becomes cheaper for non-US buyers, supporting demand and prices.
The opportunity cost channel
Gold generates no yield. It pays no interest, no dividend, no coupon. When risk-free assets like US Treasury bonds are paying attractive returns, you have a concrete reason to hold bonds instead of gold: you earn a return simply by parking capital in a safe asset. That foregone return is the opportunity cost of holding gold. When rates fall and Treasuries pay less, the opportunity cost shrinks and gold becomes relatively more attractive.
Both channels operate simultaneously. In a rising-rate environment, the dollar tends to strengthen (pressing gold lower through the denomination channel) while the opportunity cost of holding gold rises (pressing gold lower through the yield comparison). The two forces compound. When rates fall, both mechanisms reverse, supporting gold from two directions at once.
| Rate environment | Dollar direction | Opportunity cost | Likely gold pressure |
|---|---|---|---|
| Rising rates | Strengthening | Increasing (bonds pay more) | Downward |
| Falling rates | Weakening | Decreasing (bonds pay less) | Upward |
Understanding these two channels together means you can reason about gold price moves from first principles rather than waiting for a headline to tell you what just happened.
The real yields distinction that most investors miss
The framework above is accurate as far as it goes. But there is a sharper version, and it is the version that professional gold traders actually use. It does not replace what you have just learned. It refines it.
The opportunity cost of holding gold is not driven by the headline interest rate alone. It is driven by the real yield, the return you earn on safe assets after adjusting for inflation.
Real yield = Nominal yield minus inflation expectations
If the 10-year Treasury is yielding 4.5% but inflation expectations are running at 3.5%, the real yield is only 1.0%. The actual purchasing-power return on holding that bond is far lower than the headline number suggests, which makes gold relatively more attractive than the nominal rate alone would imply.
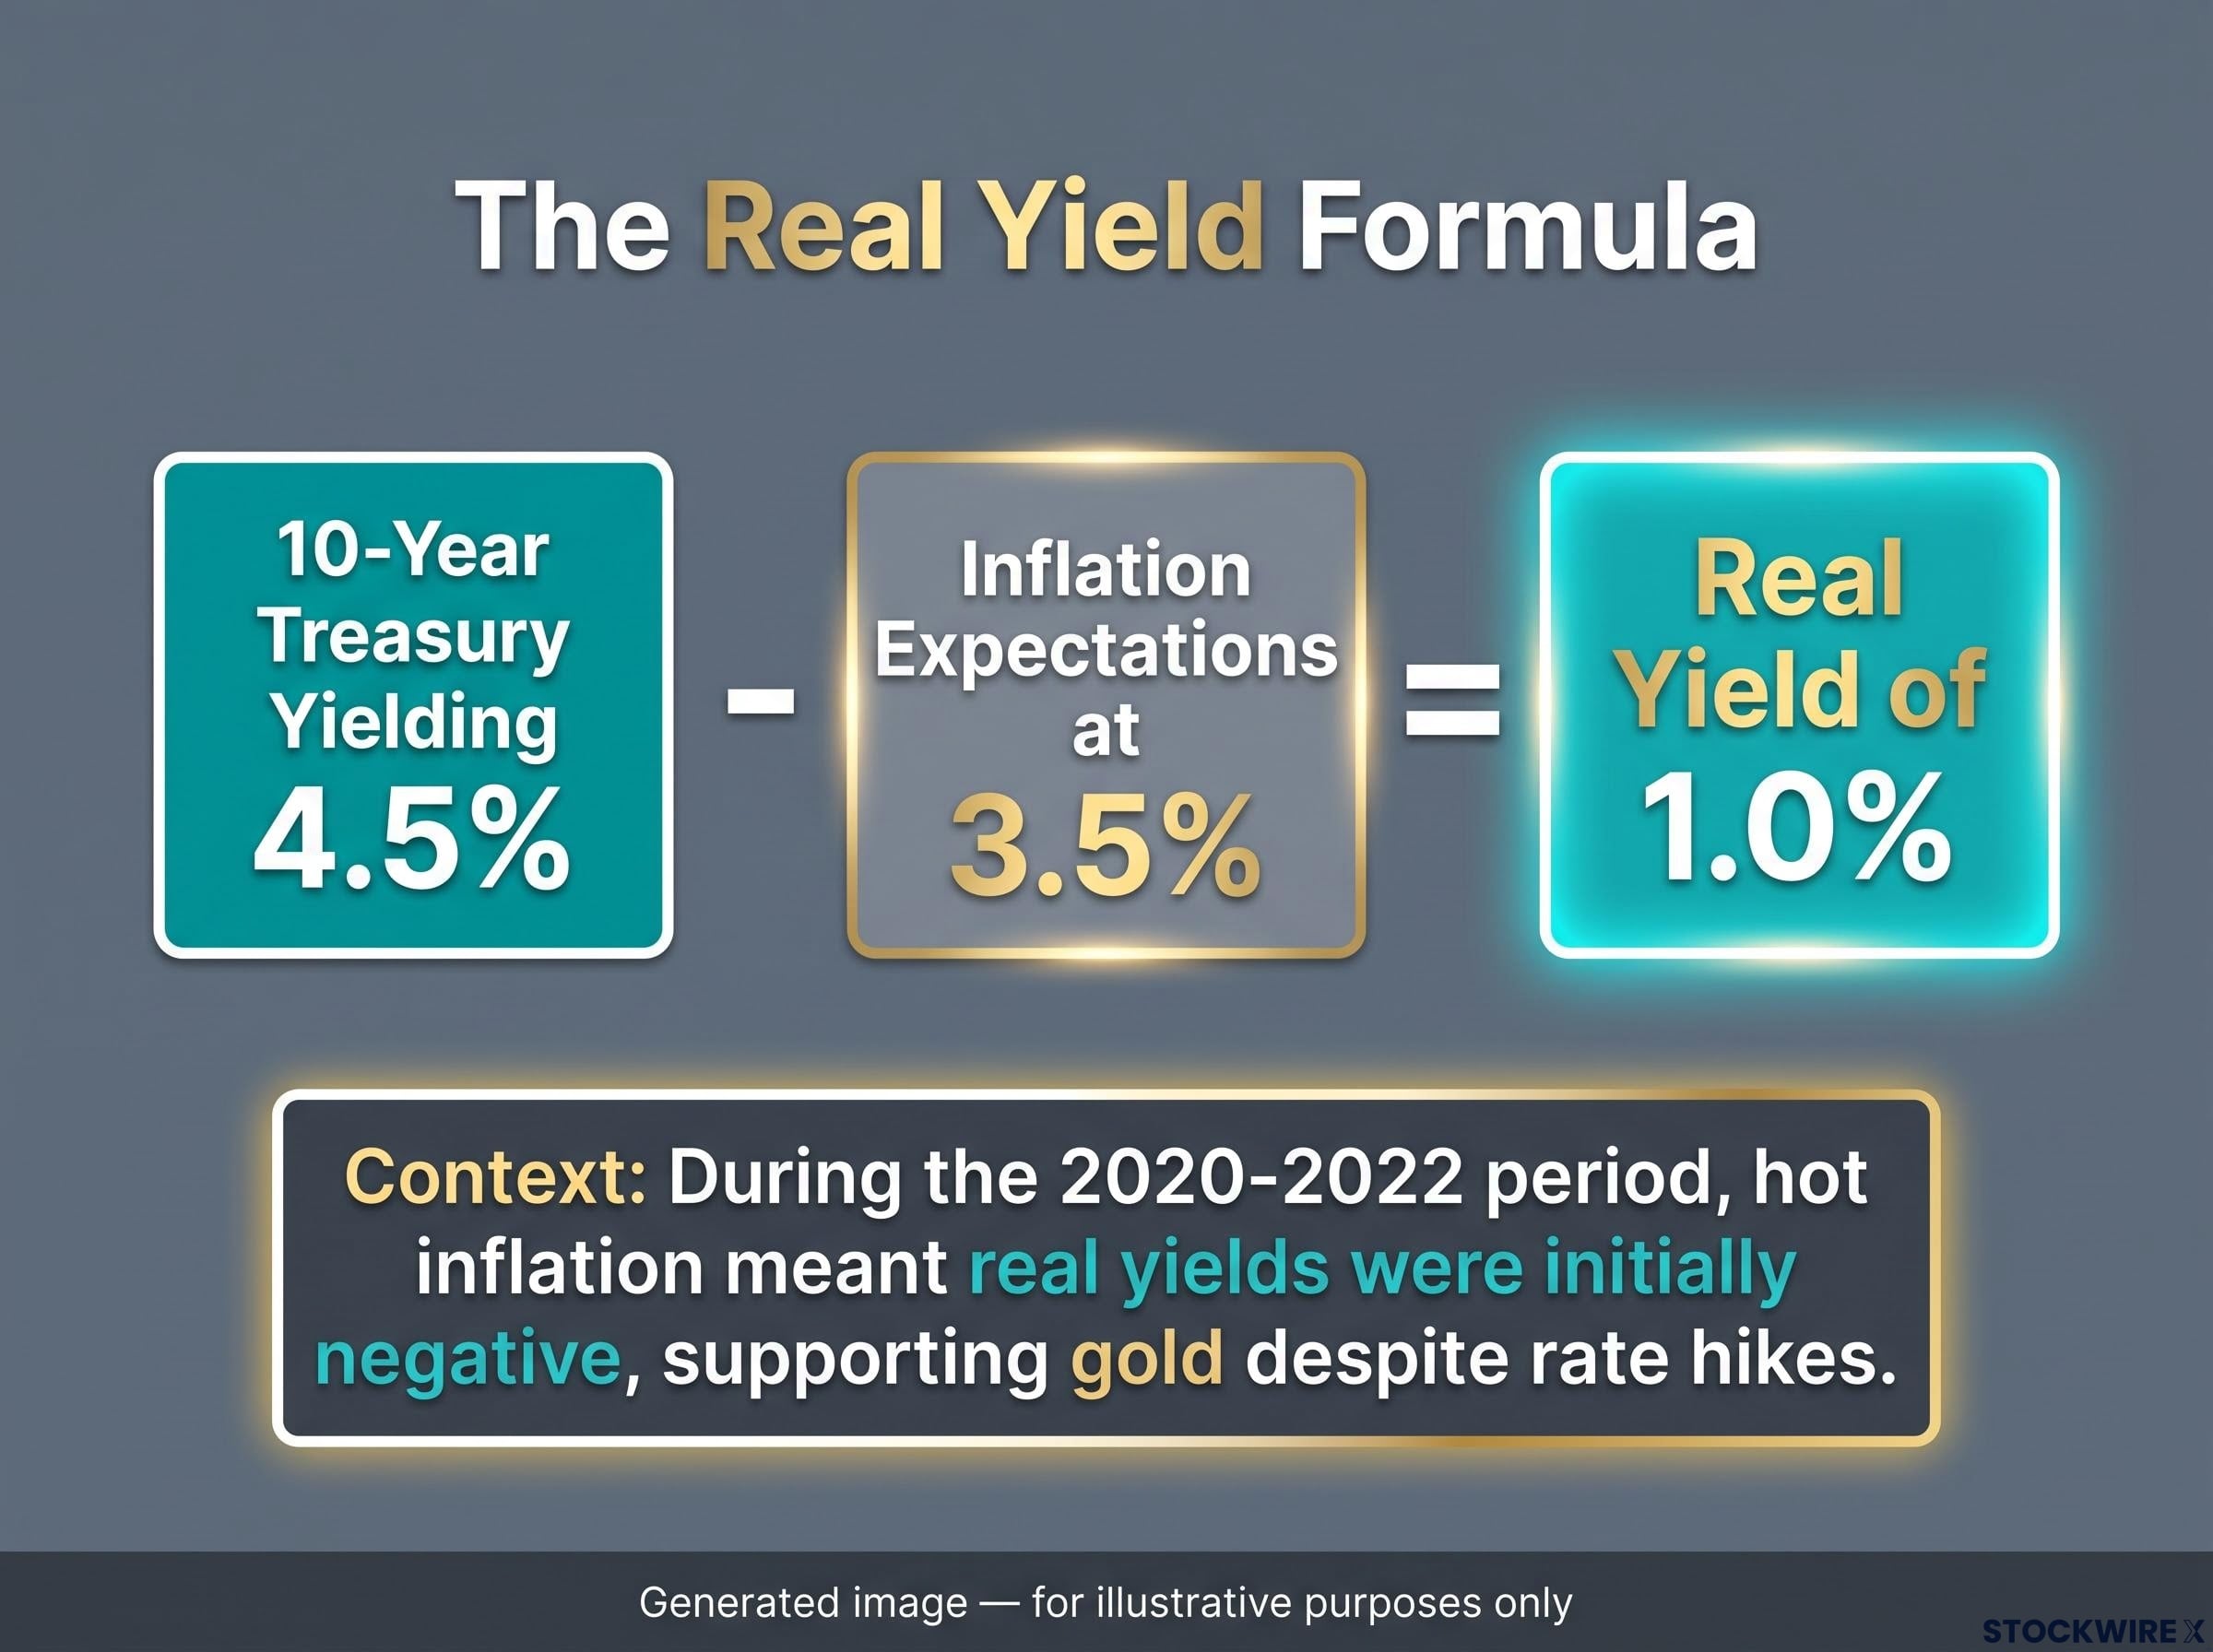
This is the distinction that explains the apparent contradiction from the opening of this article. During the 2020-2022 period, nominal rates rose aggressively from near zero as the Fed launched one of the most intense hiking cycles in modern history. But inflation expectations were running hot at the same time. Real yields were initially negative, meaning bondholders were earning returns that did not keep pace with expected inflation. In that environment, gold’s opportunity cost was actually low despite the headline rate climbing, which supported gold prices well into the hiking cycle before real yields eventually turned positive.
Gold traders watch three specific data points to track this:
- 10-year nominal Treasury yield: The headline rate on the benchmark US government bond
- 10-year TIPS yield: The yield on Treasury Inflation-Protected Securities (TIPS), which adjusts for inflation and reveals the real yield directly
- Breakeven inflation rate: The difference between the two, representing the market’s implied expectation for average inflation over the next decade
For you, this distinction is the key that resolves the puzzles. When you see gold rising during a rate-hiking cycle, check real yields before concluding the framework has failed. The odds are strong that inflation expectations are keeping real yields compressed, which is exactly what supports gold even when the Fed is tightening.
Using the CME FedWatch tool to track rate expectations before they become policy
You now have the conceptual framework: rates move the dollar, the dollar and opportunity costs move gold, and real yields are the more precise driver. The practical question is how to track where rate expectations sit right now, before the Fed actually acts.
The CME FedWatch Tool is a free, publicly available tool from CME Group that does exactly this. It derives market-implied probabilities of future Fed rate decisions from 30-Day Fed Funds futures prices. These are contracts through which market participants effectively place bets on where the federal funds rate will sit at specific future dates.
Here is how to read it:
- Find the next FOMC meeting date. The tool organises probabilities around the eight scheduled FOMC meetings per year. Identify which meeting is next on the calendar.
- Read the probability distribution. For each meeting, FedWatch shows the market-implied probability of each possible rate outcome (hold, cut, hike, and by how much). A 78% probability of a 25 basis point cut tells you that is what the market has priced in as most likely.
- Note whether probabilities have shifted recently. A probability that moved from 40% to 78% in two weeks tells you the market’s conviction is building. A stable reading tells you consensus is settled.
- Connect the consensus path back to the dollar and gold. If FedWatch shows markets pricing in rate cuts over the next three meetings, that expectation is already putting downward pressure on the dollar and reducing gold’s opportunity cost right now, before any cut actually arrives.
The probabilities shown are market-implied expectations, not Federal Reserve commitments. They shift in real time as economic data, Fed communications, and global events change the picture.
Markets move on the gap between what was expected and what actually happened. FedWatch tells you what is already priced in.
A rate decision that matches FedWatch consensus may move gold very little because the information was already reflected in the price. A decision that diverges from expectations, even modestly, can trigger sharp moves in currencies and gold precisely because it forces a rapid repricing of the entire forward path.
When the framework breaks down: safe-haven demand and the limits of the model
The rate-dollar-gold framework you have built across this article is a powerful directional tool. Over medium and long horizons, the relationships hold reliably. But the opening puzzle, gold rising during an aggressive hiking cycle, points to something the framework alone cannot explain.
In periods of acute financial stress, severe market dislocations, or geopolitical crises, gold’s role as a crisis hedge can dominate its sensitivity to rates and the dollar entirely. In these environments, investors buy gold not because of what rates are doing but because they want a hard asset that sits outside the financial system. Gold and the dollar can rise simultaneously in these moments, because both are sought as safety assets through different channels.
The conditions that can override the baseline framework:
- Acute financial system stress: Banking crises or liquidity events that trigger flight to hard assets regardless of yield comparisons
- Geopolitical crisis: Military conflicts, trade breakdowns, or sovereign risk events that elevate demand for assets outside any single government’s control
- Elevated inflation expectations driving real-asset demand: When investors fear inflation will erode the purchasing power of all financial assets, gold attracts capital as a real-asset hedge
- Diverging central bank policy paths: When major central banks move in opposing directions simultaneously, the rate differential signals can overwhelm the simple “US rates up, gold down” framework
The 2020-2022 period illustrates the full spectrum. Emergency rate cuts in 2020 supported gold through the conventional channel. Near-zero rates through mid-cycle kept real yields negative, maintaining gold’s appeal. Then the most aggressive hiking sequence in modern Fed history began in 2022, and gold still held up because inflation expectations were simultaneously surging, compressing real yields even as nominal rates climbed.
Knowing when the model breaks down is not a footnote. It is what separates you from the investor who watches gold rise during a rate hike and assumes nothing makes sense. The framework works. It just has conditions, and understanding those conditions makes it more useful, not less.
This article is for informational purposes only and should not be considered financial advice. Investors should conduct their own research and consult with financial professionals before making investment decisions.
Building the complete picture before the Fed’s next move
The full transmission chain runs from FOMC signal to market repricing to rate differential adjustment to dollar movement to gold response, with the safe-haven override sitting above as the conditional layer that can reverse anything below it. The single most important refinement to carry forward: nominal rates are only half the picture. Real yields are where the gold signal lives.
Before the next FOMC meeting, here is what to monitor:
- Current FedWatch probabilities: What outcome has the market already priced in for the next decision?
- Recent shifts in those probabilities: Has conviction been building or deteriorating over the past two weeks?
- 10-year TIPS yield direction: Are real yields rising (gold headwind) or falling (gold tailwind)?
- Dollar index trend: Is the dollar strengthening or weakening heading into the meeting?
- Active geopolitical or financial stress factors: Is anything present that could trigger the safe-haven override regardless of what the Fed does?
—