

Cleanaway delivers 14.2% EBIT growth in FY26 as takeover interest circles
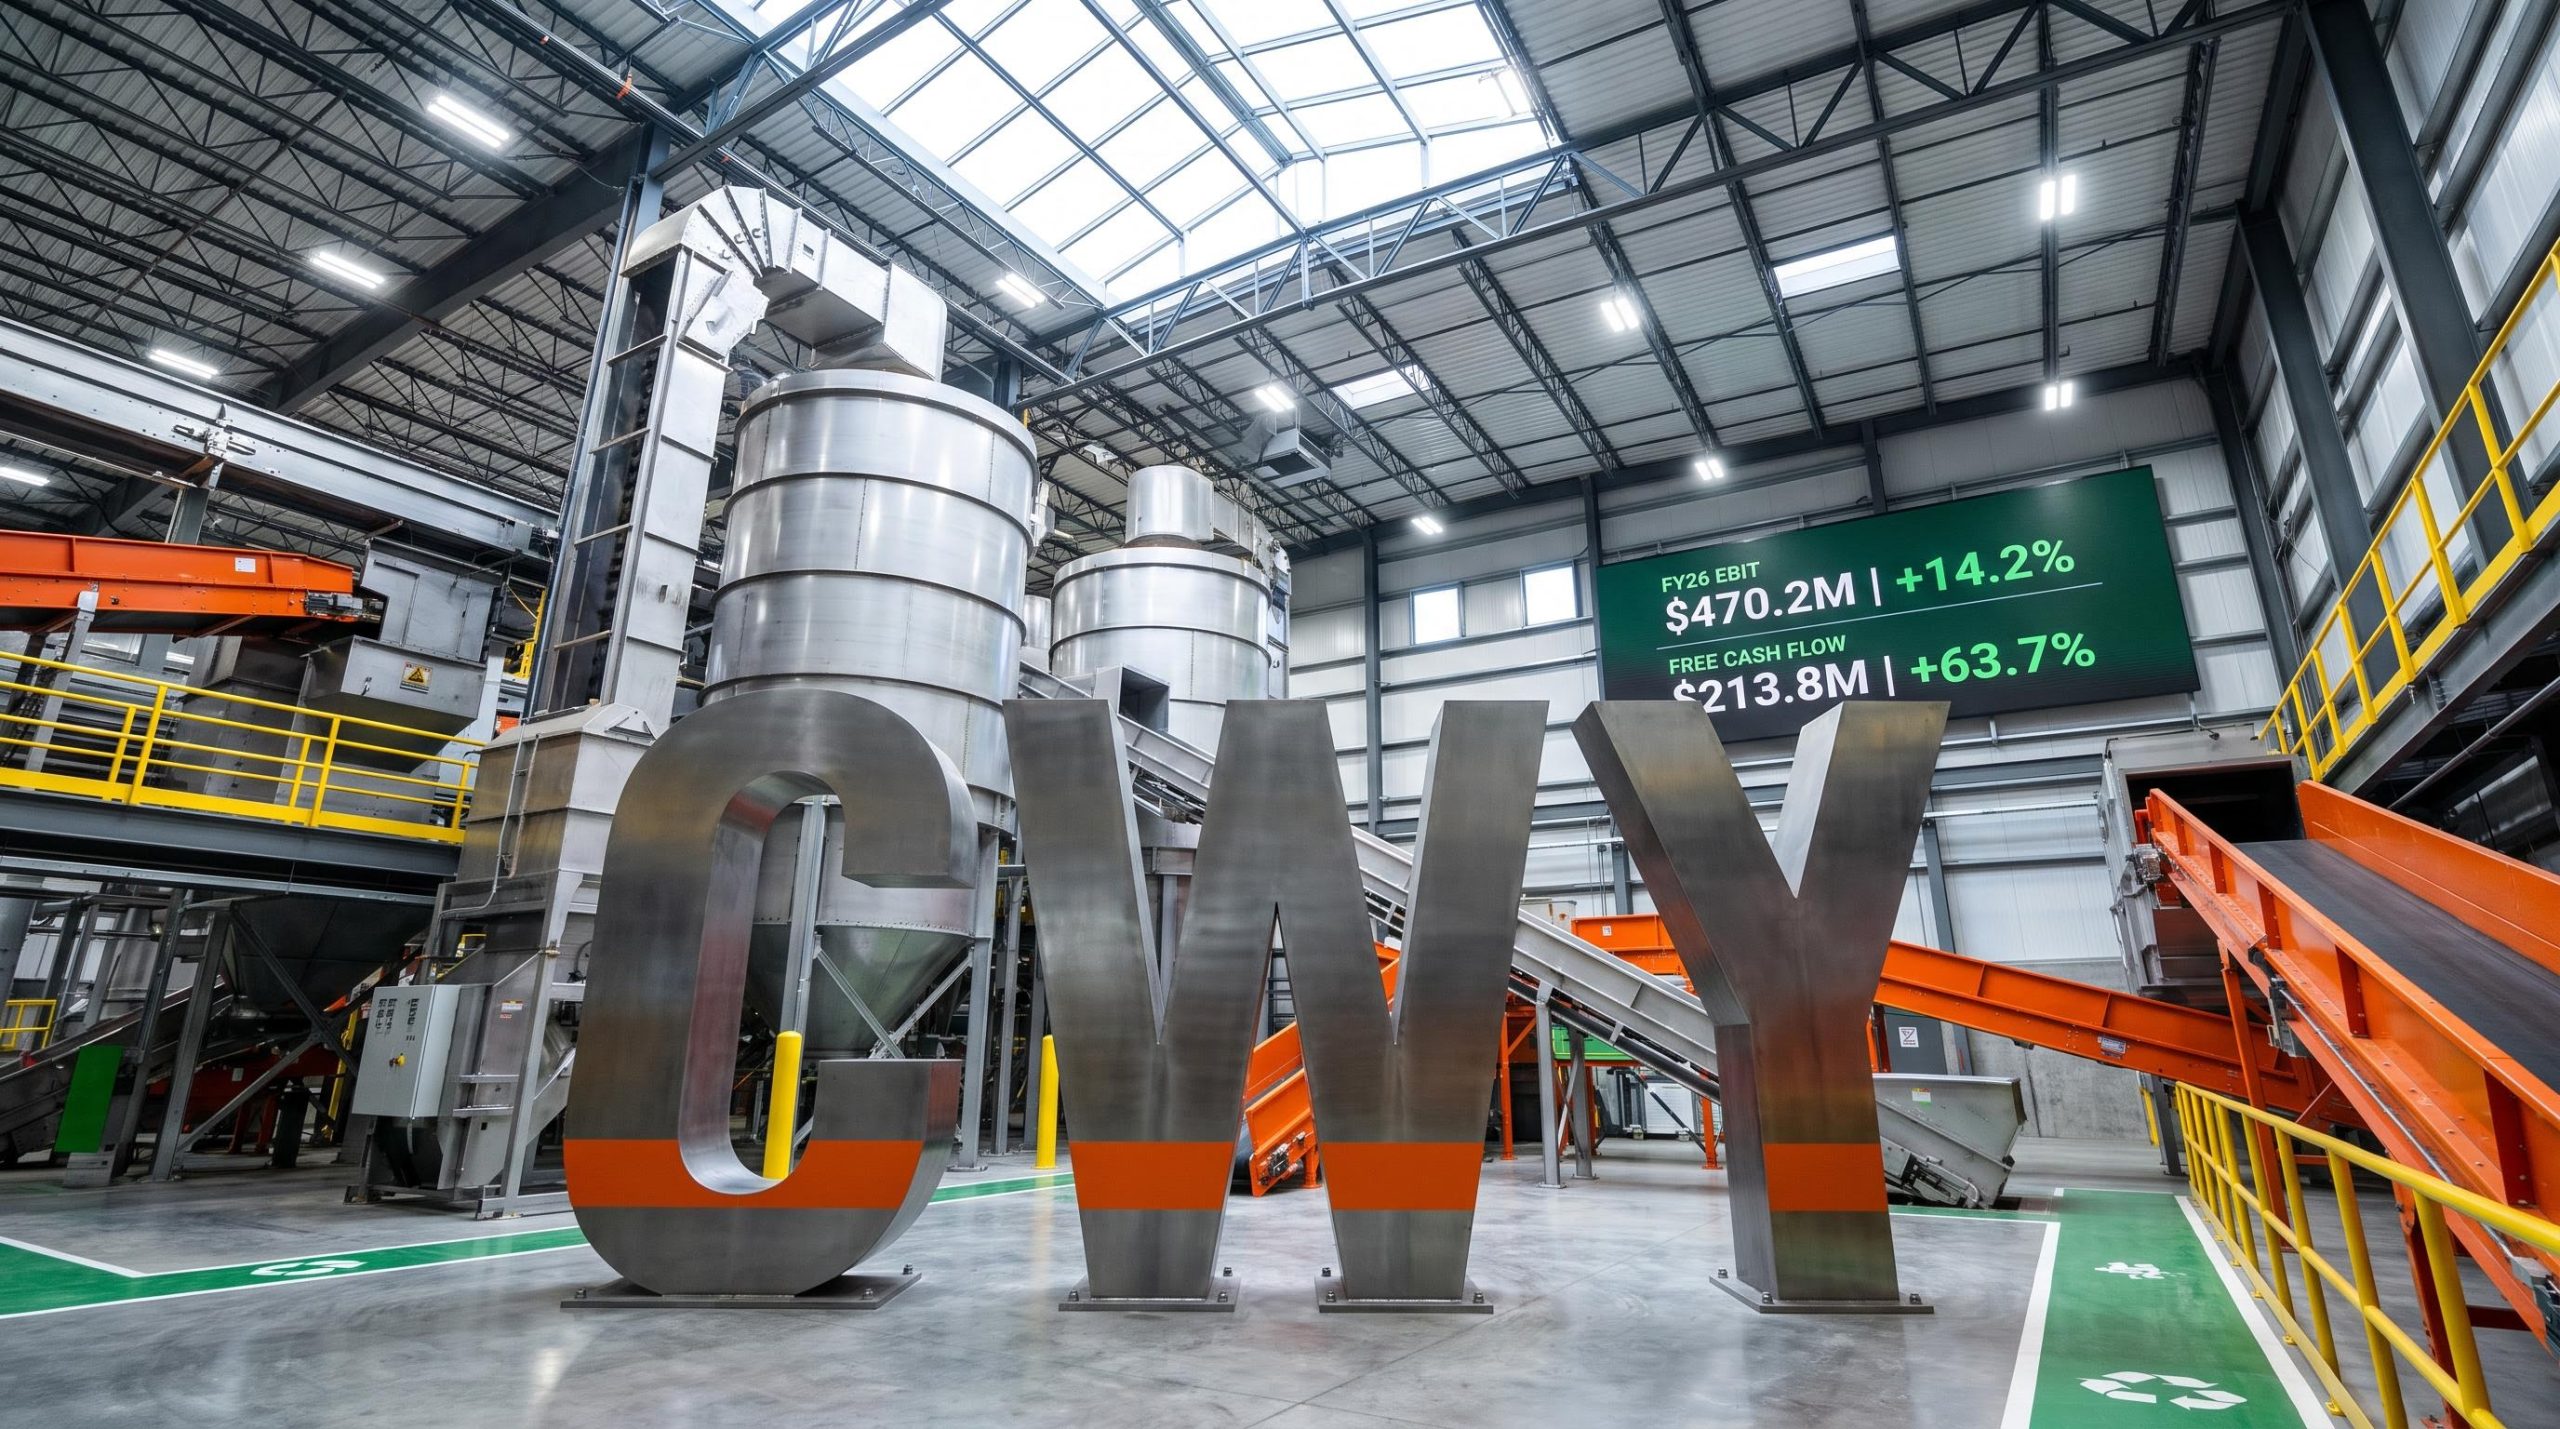
In its full-year FY26 results for the 12 months ended 30 June 2026, Cleanaway Waste Management delivered underlying EBIT growth of 14.2% to $470.2m, driven by its Solid Waste Services segment and the recently acquired Contract Resources business.
The result carried two central takeaways for investors. First, a resilient operational performance across the core portfolio. Second, a live and conditional $3.13 cash per share non-binding indicative proposal from EQT Infrastructure, announced on 13 August 2026, that places the company in the midst of a potential change of ownership.
Net revenue rose 13.1% to $3,736.7m, while underlying NPAT increased 13.6% to $223.1m. The total FY26 dividend lifted 14.2% to 6.85 cents per share.
Statutory NPAT fell 37.2% to $98.5m. This is a statutory figure impacted by $124.6m of significant and non-recurring items, not a reflection of operational weakness.
The landfill levy appeal also sits within the $124.6 million of significant and non-recurring items that separated the statutory result from underlying NPAT, with a $27.5 million provision booked covering FY18, FY19, and FY22 periods.
When big ASX news breaks, our subscribers know first
FY26 financial results at a glance
The scorecard below highlights the divergence between the group’s strong underlying performance and its statutory NPAT, the latter weighed down by one-off items.
| Metric | FY26 | FY25 | Variance |
|---|---|---|---|
| Net Revenue ($m) | 3,736.7 | 3,302.7 | +13.1% |
| Underlying EBIT ($m) | 470.2 | 411.8 | +14.2% |
| Underlying NPAT ($m) | 223.1 | 196.4 | +13.6% |
| Statutory NPAT ($m) | 98.5 | 156.9 | –37.2% |
| Free Cash Flow ($m) | 213.8 | 130.6 | +63.7% |
| Dividend (cps) | 6.85 | 6.00 | +14.2% |
| Underlying ROCE | 9.7% | 9.1% | +60 bps |
Beyond the headline metrics, several secondary highlights stood out:
-
Free cash flow rose 63.7% to $213.8m, including an approximate $40.2m benefit from improved fleet payment terms and delivery timing.
-
Underlying EBIT margin improved 10 basis points to 12.6%.
-
Underlying EPS reached 10.0 cents per share, up 13.6%.
Where the growth came from — segment performance
Solid Waste Services — the engine room
Solid Waste Services recorded net revenue of $2,506.4m, up 6.4%, with underlying EBIT rising 9.1% to $405.0m and margin expanding 40 basis points to 16.2%.
Growth was underpinned by Commercial and Industrial collections, the core landfill portfolio, the national Container Deposit Scheme (CDS) business, alongside pricing and improved labour and fleet efficiency. Through contractual pricing mechanisms, approximately 80% of direct fuel cost impacts were recovered in-year.
The segment secured a new 7.5-year Cairns Regional Council contract commencing December 2026, while the Citywide Waste integration remained on track, reporting $103.3m in revenue.
Contract Resources — acquisition outperforming
Sitting within the Contract Resources and Industrial Services (CRIS) segment, Contract Resources performed ahead of its acquisition business case in its first 11 months under Cleanaway.
The business delivered $319.8m of revenue and $36.1m of EBIT, excluding integration synergies, at an 11.3% EBIT margin. Higher project activity across Australia and New Zealand supported the result, partly offset by lower Middle East activity, with recovery expected in FY27.
Environmental & Technical Solutions — recovery focus
Within the Oils & Technical Services and Health Services (OTSHS) division, net revenue eased 1.2% to $676.0m and underlying EBIT fell 10.7% to $75.1m. Growth in Oils & Technical Services, driven by higher Re-Refined Base Oil prices and equipment cleaning services, was offset by weaker Health Services.
Health Services earnings reduced following the retention of a major customer (over 90% of volumes) at lower rates, an unexpected facility outage, and delays in commissioning a new product destruction facility.
Cleanaway Industrial Services saw lower utilisation from fewer shutdowns and project deferrals. An operating-model realignment is underway, with FY26 synergies of $6.4m achieved against a target of approximately $12m.
Cash flow, dividend and balance sheet strength
Free cash flow stood out as the standout metric, rising 63.7% to $213.8m. The improvement reflected earnings growth, disciplined working capital management, and an approximate $40.2m benefit from improved fleet payment terms.
The Board declared a final, fully franked dividend of 3.5 cents per share, bringing the total FY26 dividend to 6.85 cents per share, a payout ratio of 68.8% of underlying NPAT. The dividend is payable on 8 October 2026 to shareholders on the register on 14 September 2026.
Net debt rose to $2,288.7m from $1,736.6m, reflecting debt funding of the Citywide and Contract Resources acquisitions (approximately $470m). The leverage ratio was 2.27x, with $275m of headroom under committed facilities, remaining comfortably within covenants.
CEO Commentary
“FY26 was a demanding year for Cleanaway, but also one in which we delivered earnings growth, materially stronger free cash flow and improved returns,” said Mark Schubert, CEO & Managing Director.
What is Blueprint 2030 2.0?
Blueprint 2030 2.0 (BP 2.0) is the company’s strategy to make its existing platform work harder. Rather than relying on acquisitions, the approach centres on converting earnings growth into stronger, more sustainable free cash flow through pricing, productivity, technology and better asset utilisation.
For investors, the strategy sets clear targets: margin expansion of more than 260 basis points, EPS growth of 10–15%, growing free cash flow, and a dividend payout of 50–75% of underlying NPAT over the life of the plan.
The value creation framework rests on three levers:
-
High-value revenue growth through improved win rates, retention, share of wallet and smarter pricing.
-
Margin and cash improvement via greater asset utilisation, lower cost to serve, and reduced indirect and capital costs.
-
Technology enablement through CustomerConnect, data and analytics, and IT modernisation.
FY27 guidance and the EQT takeover proposal
FY27 outlook
Management described FY27 as a “transitional year” for Cleanaway. Underlying EBIT guidance was set at $500m – $530m.
The guidance is underpinned by collections-led growth across Solid Waste Services, expected recovery in OTS and Health Services, and continued growth from Contract Resources with a Middle East recovery anticipated. Near-term costs related to IT systems and BP 2.0 capability are expected to weigh on the result, with benefits anticipated over time.
EQT Infrastructure’s non-binding proposal
On 13 August 2026, Cleanaway announced it had received a conditional, non-binding indicative proposal (the Proposal) from EQT Infrastructure to acquire 100% of the shares in Cleanaway by way of a scheme of arrangement.
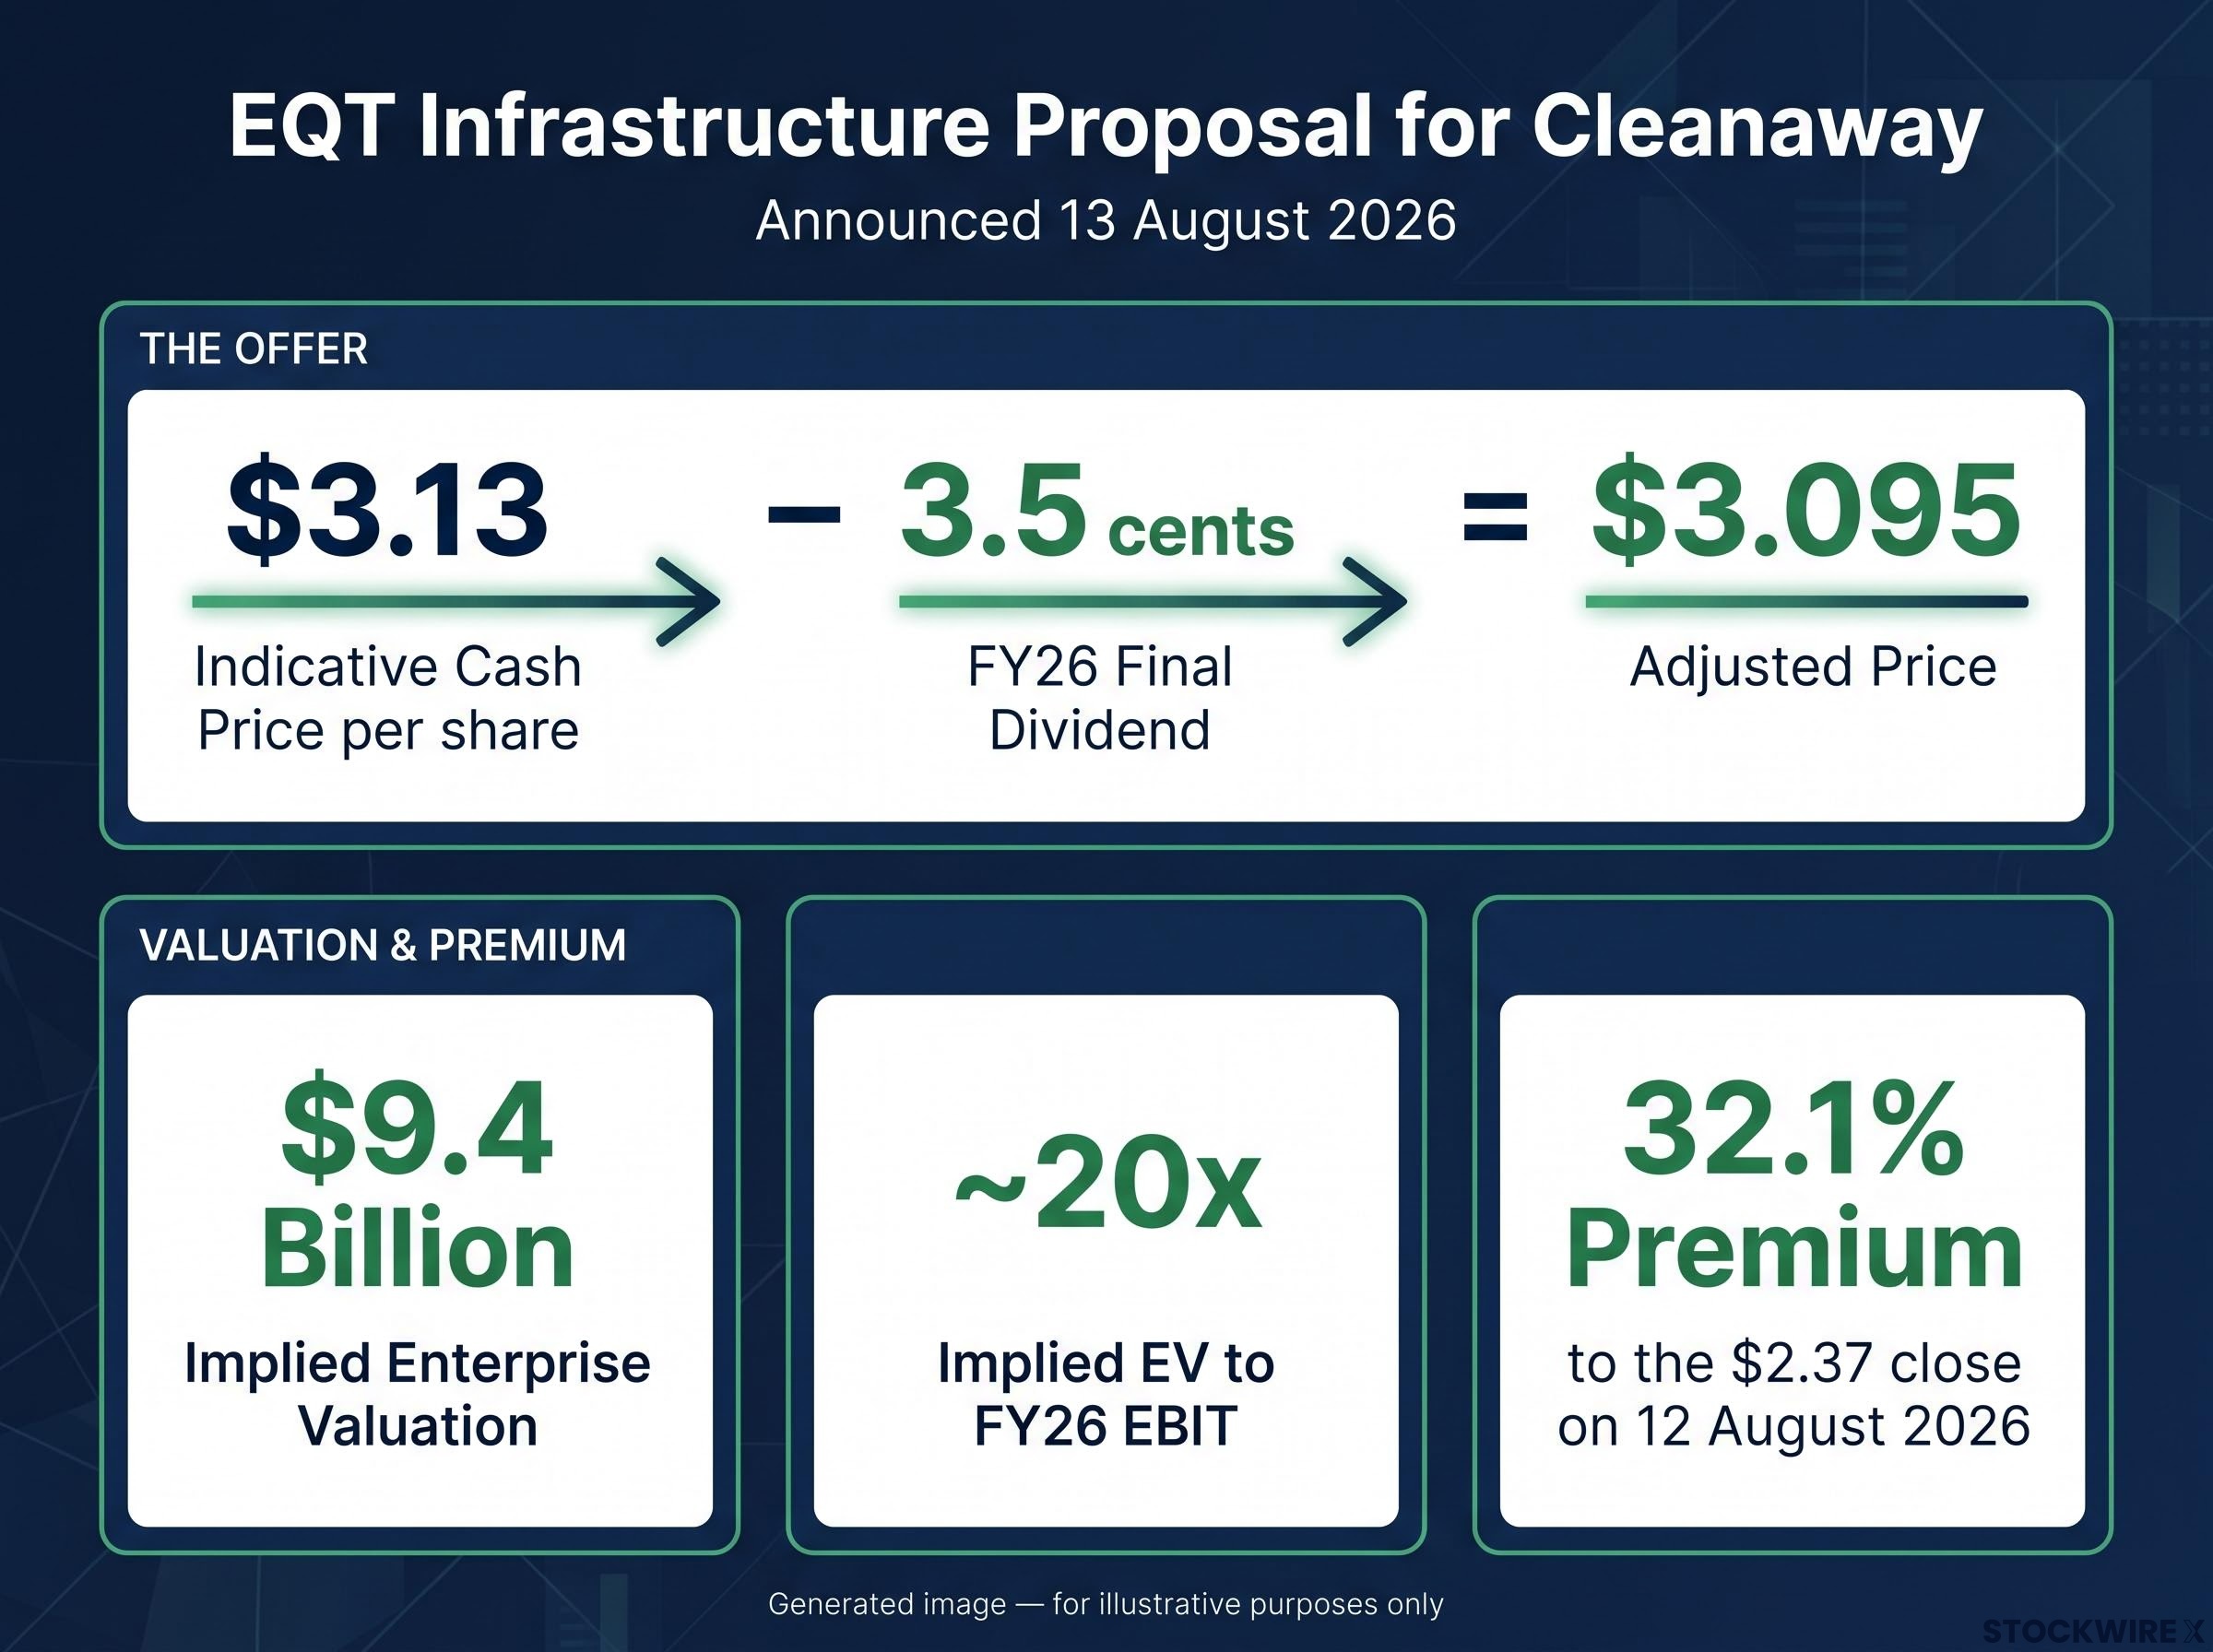
The indicative cash price is $3.13 per share, less the cash amount of the FY26 final dividend of 3.5 cents per share and other dividends (including any special dividend) or other distributions declared or paid from 13 August 2026, reducing the figure to $3.095.
The Proposal implies an enterprise valuation of approximately $9.4 billion and an implied Enterprise Value to FY26 EBIT multiple of approximately 20x. It represents a premium of 32.1% to the last closing price of $2.37 on 12 August 2026, and around 34% to the one, three and six-month volume weighted average prices.
The Proposal contemplates the potential for a fully franked special dividend that may deliver additional value to shareholders. Cleanaway and EQT Infrastructure have entered into a Transaction Process Deed providing for up to 9 weeks of exclusive due diligence to negotiate a scheme implementation deed (SID).
Cleanaway Directors confirmed that, subject to negotiation and execution of a SID at a price no less than $3.13 per share and an independent expert concluding the Proposal is in the best interests of shareholders, they intend to recommend shareholders vote in favour, in the absence of a superior proposal.
The EQT takeover proposal requires FIRB and ACCC regulatory approvals before any binding scheme implementation deed can be executed, introducing a further layer of conditionality beyond the Board recommendation threshold.
There is no certainty the Proposal will lead to a binding transaction or that any transaction will eventuate. Cleanaway shareholders do not need to take any action in relation to the Proposal.
What FY26 means for investors
FY26 combined resilient core earnings growth with a standout free cash flow result and disciplined execution under Blueprint 2030 2.0. Layered on top is a live takeover proposal at a meaningful premium to recent trading levels.
The period ahead sees investors weighing the operational recovery trajectory, particularly in the Environmental & Technical Solutions division, against the potential EQT transaction and its conditional pathway to a binding agreement.
Don’t Miss the Next ASX Industrials Move
Big News Blast delivers FREE breaking ASX announcements straight to your inbox within minutes of release, complete with in-depth analysis so the work is already done. Join 20,000+ subscribers who stay ahead of the market on deals, results, and corporate developments. Click the “Free Alerts” button at Big News Blast to start receiving alerts today.