
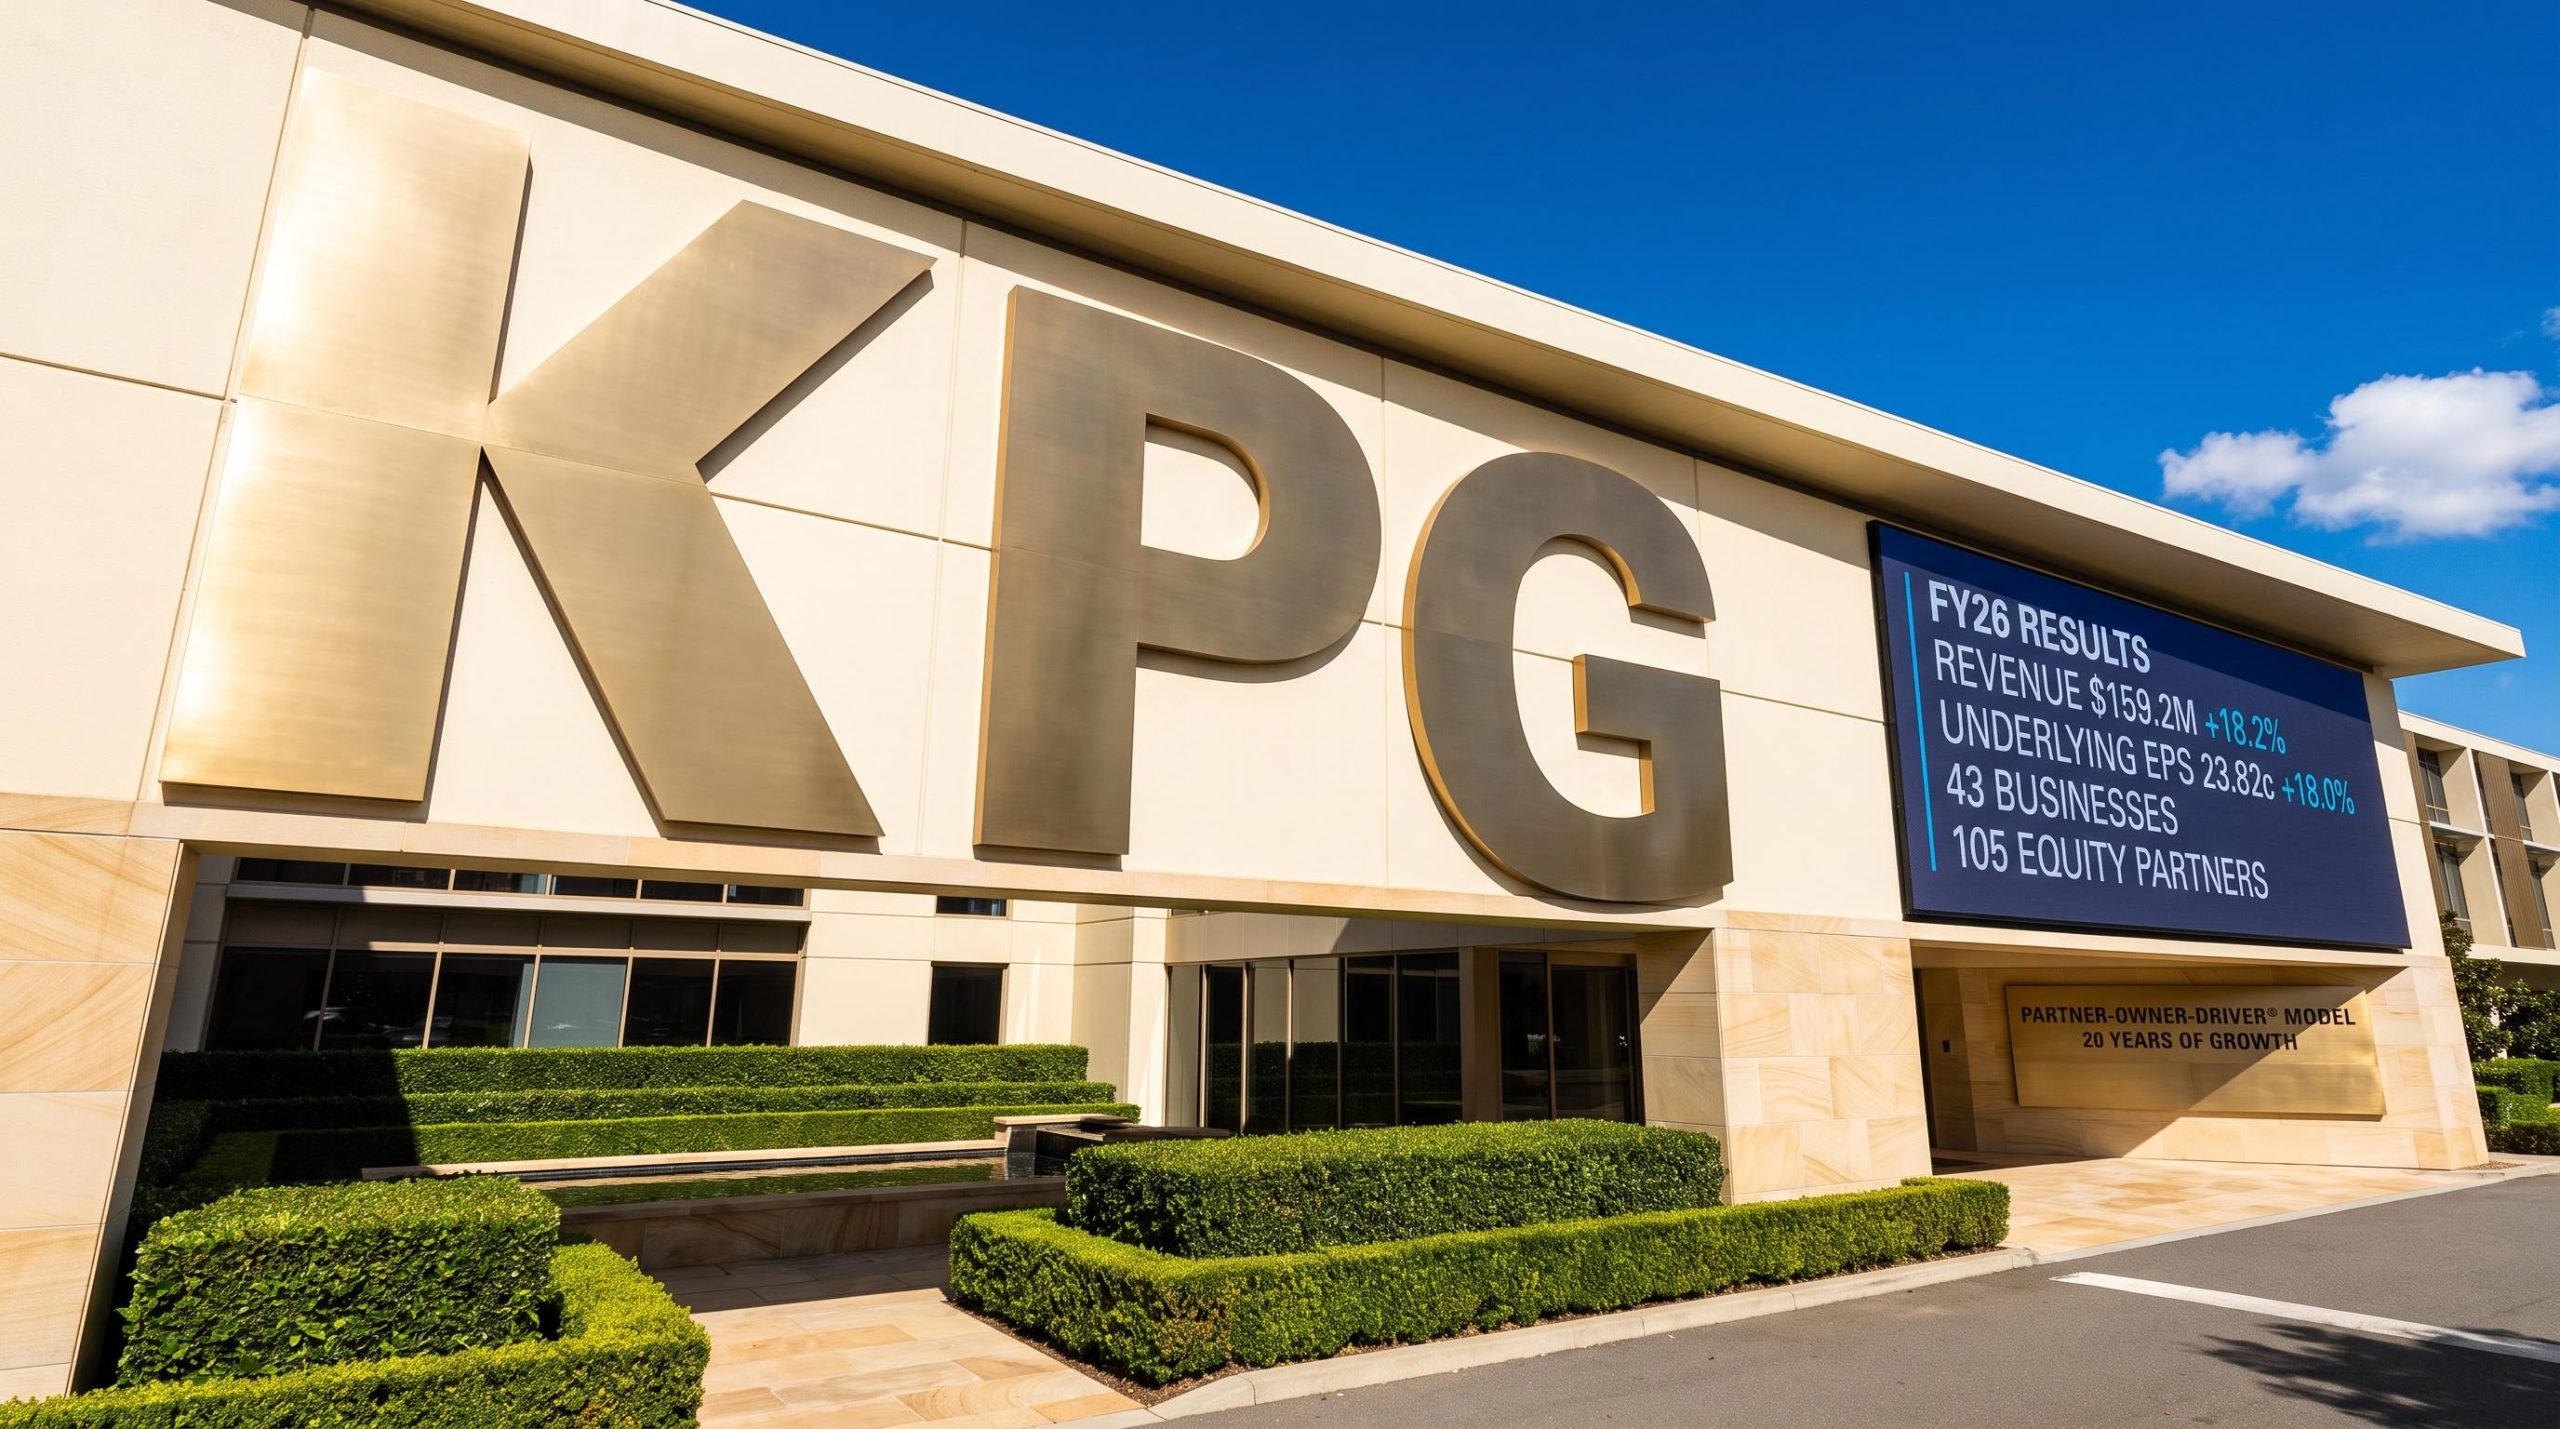
KPG delivers 18% revenue growth to $159.2m in FY26
In its FY26 full-year results presentation delivered by Founder & CEO Brett Kelly and CFO Kenneth Ko in August 2026, Kelly Partners Group Holdings outlined revenue growth of 18.2% to $159.2m for the year ended 30 June 2026.
Parent underlying NPATA rose 18.9% to $10.8m, with underlying earnings per share up 18.0% to 23.82c. The presentation framed FY26 as a continuation of a 20-year track record in which revenue has doubled six times, delivering a 29.2% revenue compound annual growth rate (CAGR) since 2007. The Group now spans 105 equity partners across 43 businesses.
When big ASX news breaks, our subscribers know first
FY26 headline results at a glance
Management presented a “KPG in 10 seconds” snapshot spanning profit and loss, balance sheet and cashflow. The quick-read highlights included:
-
Revenue: $159.2m (+18.2%)
-
Operating cashflow (pre-AASB 16): $32.4m (+30.1%)
-
Cash conversion: 104.9% (FY25: 99.8%)
-
Group ROE: 40.8%; Group ROIC: 23.2%
-
Owner earnings / free cashflow (parent): $10.0m (+18.4%), or 22.14c per share
The period-on-period comparison is set out below.
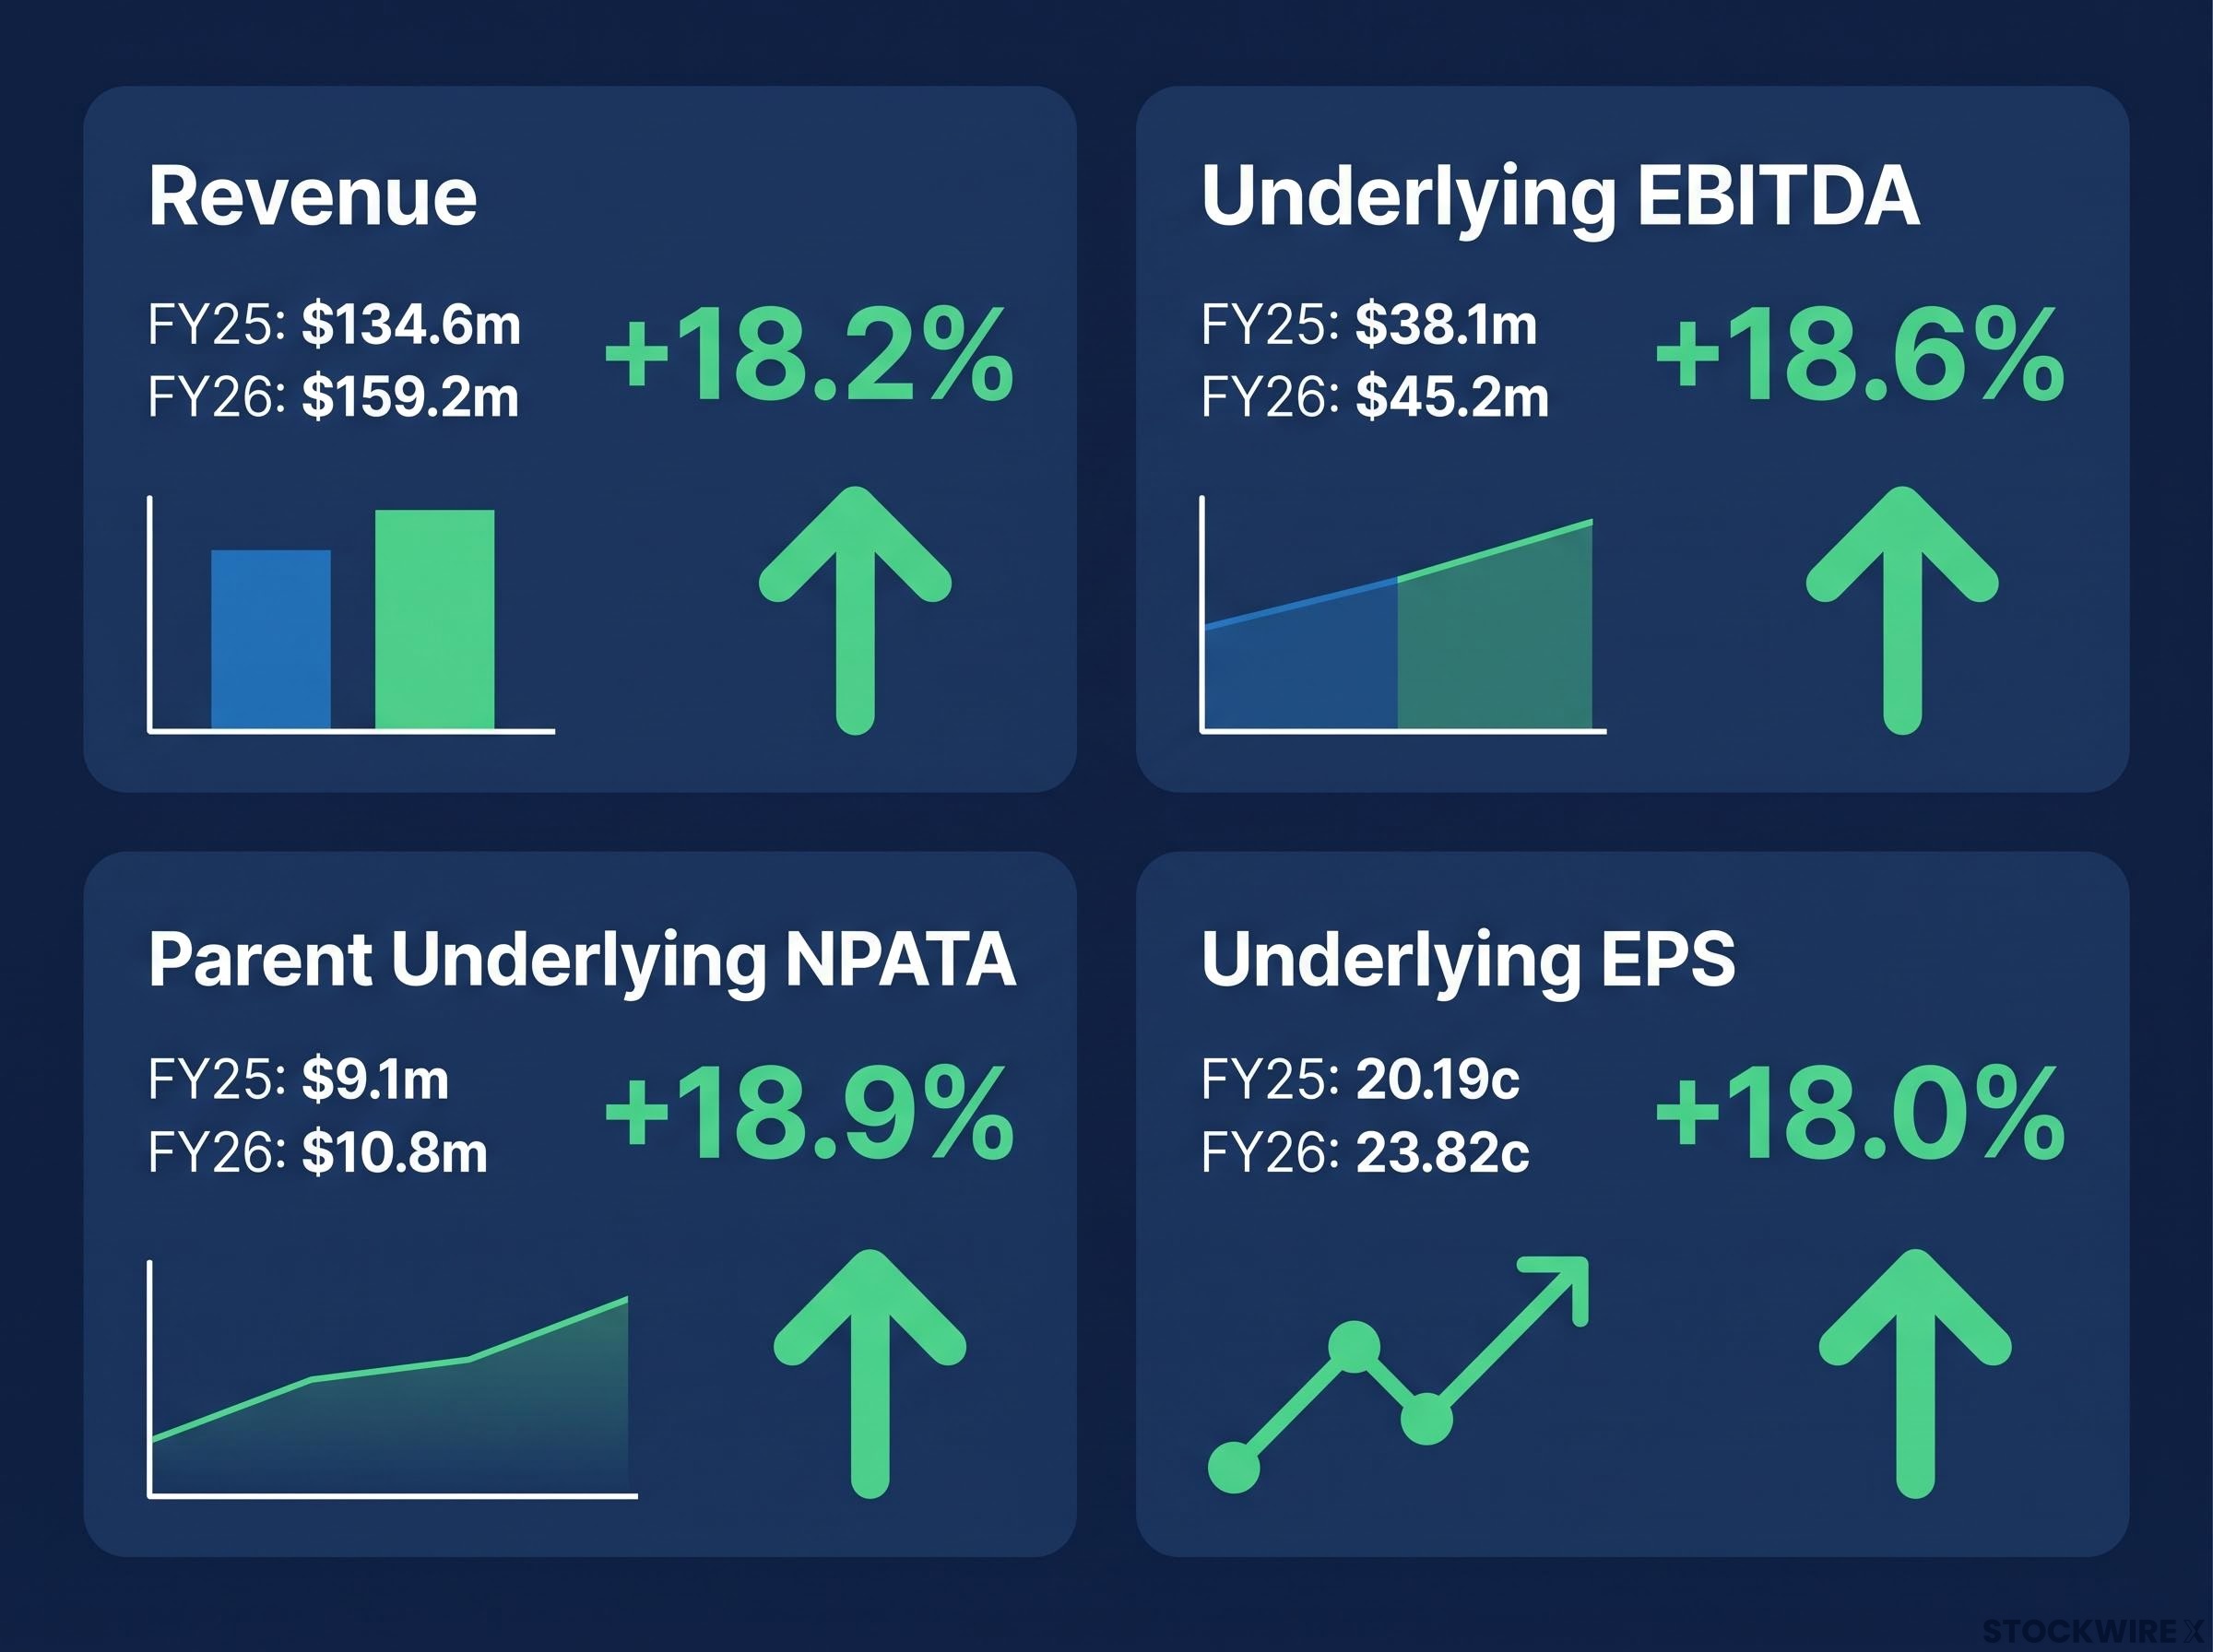
| Metric | FY25 | FY26 | % Change | Note |
|---|---|---|---|---|
| Revenue | $134.6m | $159.2m | +18.2% | Group |
| Underlying EBITDA – Operating Business | $38.1m | $45.2m | +18.6% | Pre-AASB 16 |
| Parent Underlying NPATA | $9.1m | $10.8m | +18.9% | Parent attributable |
| Owner Earnings – parent | $8.5m | $10.0m | +18.4% | Free cashflow |
| Underlying EPS | 20.19c | 23.82c | +18.0% | Parent |
| Group ROE | 38.8% | 40.8% | — | Group |
| Cash conversion | 99.8% | 104.9% | — | Group |
How the Partner-Owner-Driver model works
Kelly Partners operates as a consolidator of accounting firms. Under its Partner-Owner-Driver® model, operating partners retain roughly 49% of each business while KPG holds around 51%. The company’s view, referencing Charlie Munger’s incentive principle, is that partners owning a meaningful stake are motivated to grow their firms as genuine part-owners.
A recurring theme in the presentation was the distinction between consolidated (Group) figures and parent-attributable figures. This distinction matters for investors reading the numbers correctly, because the shareholder-level measure differs from the headline consolidated totals.
Management addressed several common misconceptions:
-
Attributable versus consolidated economics: parent underlying NPATA of $10.8m is the shareholder measure, published in every results pack since IPO.
-
Statutory parent NPAT of $3.5m is lower because it is reduced by $4.8m of non-cash amortisation of acquired client books and $2.4m of one-off growth costs borne 100% by the parent.
-
Distributions to non-controlling interests (NCI) of $15.6m reflect operating partners receiving their share of pre-tax profits, which is what makes the model work, rather than leakage.
-
On real leverage, parent debt to parent EBITDA sat at 1.96x, while consolidated net debt to underlying EBITDA was 1.52x.
Growth engine: acquisitions, organic growth and returns
Capital allocation remains central to KPG’s approach, described in the presentation as a “programmatic acquisition” strategy. The company completed 6 acquisitions in FY26. Acquired revenue growth contributed 15.3% of the total, while organic growth added 2.9%, or 4.5% excluding the effects of consolidating offices and exiting unprofitable clients.
Management presented ROIC plus organic growth as its proxy for the annual increase in shareholder value. This combined measure reached 26.1% in FY26, against a five-year average of 27%.
Return metrics that compound
The presentation highlighted Group ROIC of 23.2%, parent ROE of 35.7%, and a per-share book value CAGR of 34.0% since IPO. These figures underpin the compounding narrative that has characterised the business over its two decades.
Management commentary
Management attributed FY26’s result to the KPG Business System, noting that revenue has doubled six times over 20 years and framing continued growth as the natural extension of that system rather than a departure from it.
Financial position: balance sheet, debt and cash generation
Net debt increased to $70.7m (from $58.4m) to fund the six acquisitions completed during the year, lifting Group gearing to 1.52x. Management noted that gearing has never exceeded 2.0x across the company’s history.
Cash generation was a feature of the period. Operating cashflow (pre-AASB 16) rose 30.1% to $32.4m, cash conversion reached 104.9%, and the Group held $18.6m of cash and facility headroom, equivalent to 25% of gross debt drawn.
Total equity stood at $72.7m and total assets at $229.9m, with intangibles rising to $122.8m on increased acquisition activity. Lockup days improved to 52.8 (from 58.0).
| FY26 ($m) | Parent | Operating Business | Total |
|---|---|---|---|
| Gross Debt | $28.5m | $46.3m | $74.7m |
| Net Debt | $28.5m | $42.2m | $70.7m |
Global footprint and strategic direction
The presentation detailed KPG’s global platform of 711 team members across 43 businesses in the US, UK & Ireland, the Philippines and Australia. The company operates a 24/7 global team model serving approximately 25,000 active clients.
Two strategic objectives were reiterated: a “Top 10 in Australia” ambition, with KPG ranked 10th on the Australian Financial Review Top 100 accounting firms at FY25, and a “Go Global” objective to extend the Kelly+Partners Business System into international markets.
The Eurofast termination, announced in June 2026, illustrated that discipline directly: KPG walked away from a legally binding term sheet after the Cyprus-based vendor demanded a materially larger upfront payment, preserving acquisition criteria even at the cost of a late-stage deal already approved by shareholders.
What’s next for KPG
Management outlined three “Next Steps”:
-
International listing — progressing an international listing.
-
Long-dated debt raise — to provide additional flexible capital to the business.
-
Dual Class Share Structure — a loyalty share class structure.
The presentation also referenced an illustrative FY28 target under which revenue would double FY25’s $134.6m to approximately $270m by FY28, equivalent to around 26% per annum. Management stated explicitly that this figure is illustrative only and is not a forecast or guidance.
Why FY26 matters for investors
FY26 positions KPG as a 20-year compounder combining disciplined capital allocation, aligned partner incentives, high returns on capital and strong cash conversion, supported by a global growth runway. The company reported underlying EPS growth of 18.0% for the year and a per-share book value CAGR of 34.0% since IPO. For investors, the coverage centres on whether that compounding pattern can continue as the platform scales across international markets.
Don’t Miss the Next ASX Finance Compounder
Big News Blast delivers FREE breaking ASX finance and professional services news directly to your inbox within minutes of release, complete with in-depth analysis. Join 20,000+ investors already staying ahead of the market. Click the “Free Alerts” button to start receiving alerts the moment market-moving announcements hit the ASX.