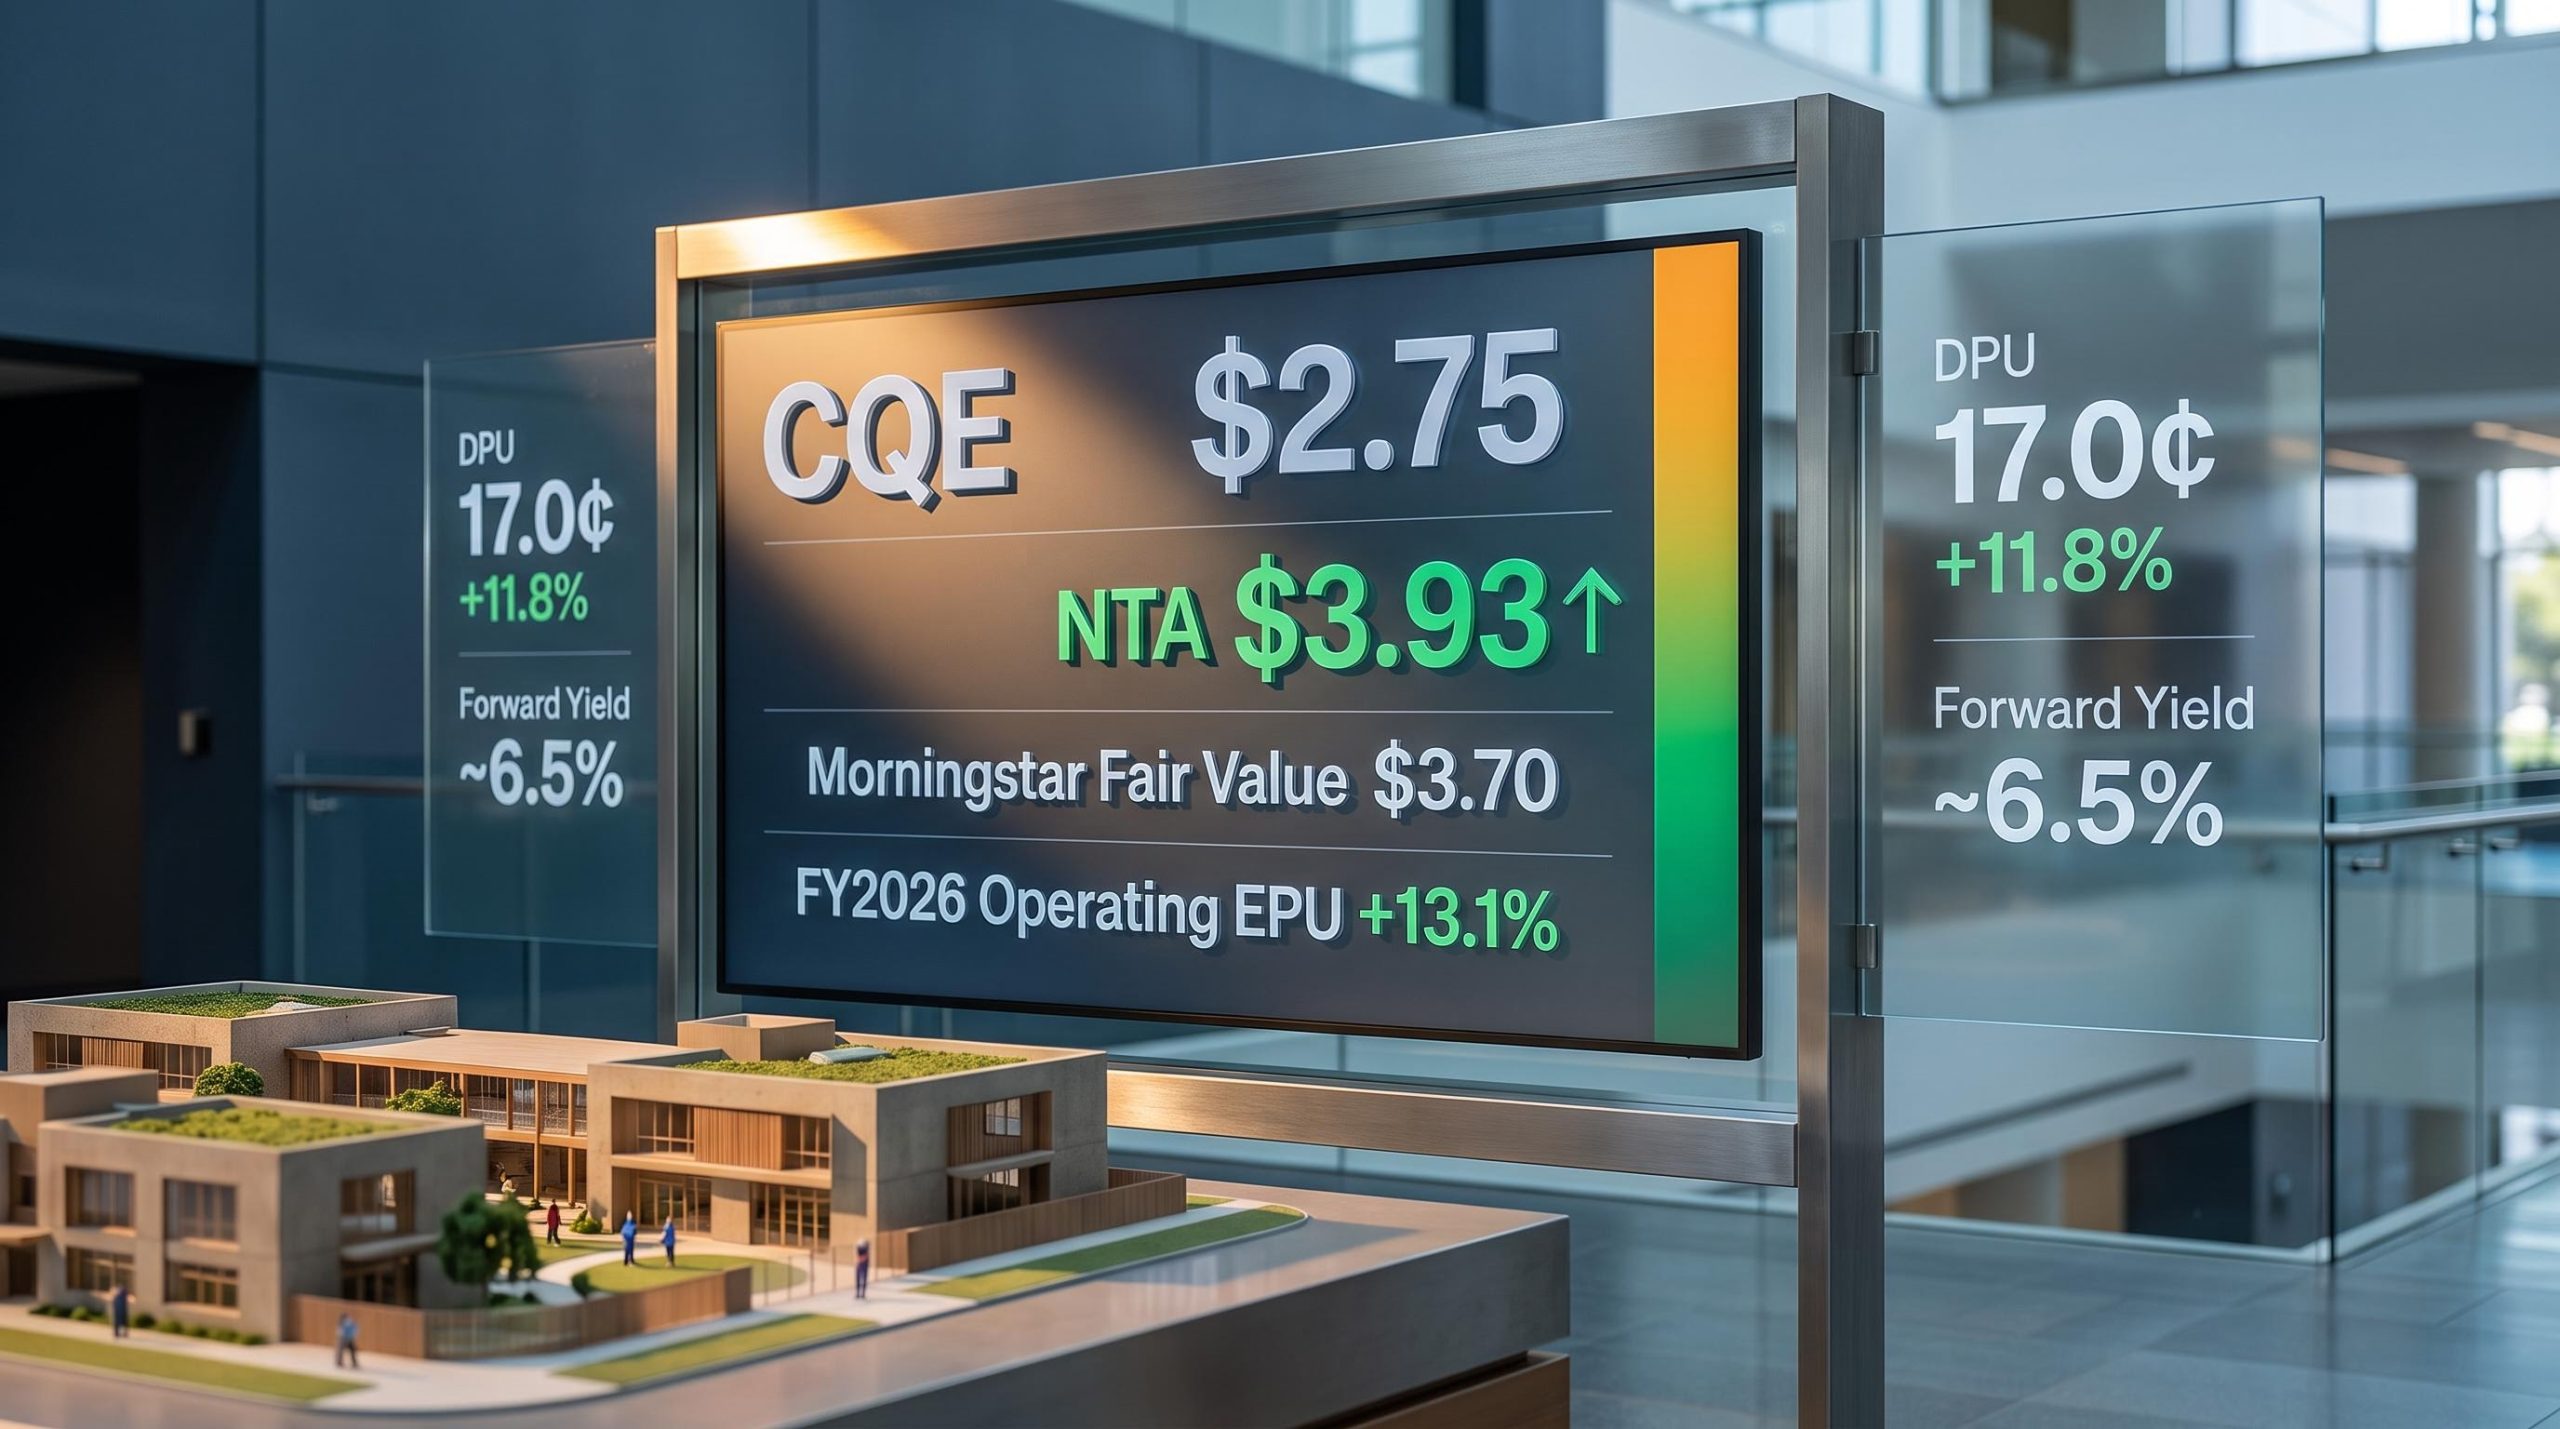
Charter Hall Social Infrastructure REIT just posted 13.1% earnings growth for FY2026. Its net tangible assets per unit rose to $3.93, up 1.8%, in an environment where the market had priced in further asset deterioration. The units still trade at roughly 26% below Morningstar’s fair value estimate of $3.70.
The FY2026 results, announced on 4 August 2026, triggered a near-9% unit price surge on the day. That reaction tells you the market was caught offside by the strength of the operating result. Yet even after the rally, the discount to both NTA and fair value remains material, which raises the question income-focused investors actually need answered: if the fundamentals are this strong, what exactly is the market still pricing in?
This piece unpacks what the FY2026 numbers show, what the persistent discount reflects, and what the forward yield and risk profile look like at current prices. The mispricing case is real, but so are the risks that sustain it. Here is the analytical framework for weighing both.
What the FY2026 numbers actually show
The earnings result builds from the ground up. Like-for-like net property income grew approximately 4.2%, driven by rent reviews averaging 3.8% across the portfolio, with market rent reviews delivering 6.4% average increases. That organic rental escalation flowed through to total net property income of $119.9 million, up 10% on the prior year.
At the unit level, operating earnings per unit came in at 17.3 cents, up 13.1% on FY2025. Distributions per unit reached 17.0 cents, up 11.8% year-on-year. The gap between the two figures reflects a payout ratio sitting just below 100%, a point that matters when assessing the forward case.
The metric that cuts hardest against the market’s prevailing concern is NTA. With bond yields staying high and many investors expecting property valuations to soften, CQE’s NTA per unit nonetheless climbed to $3.93, up 1.8%. The rental income growth proved strong enough to counteract the upward pressure on capitalisation rates rather than being swamped by it.
| Metric | FY2026 Result | Year-on-Year Change |
|---|---|---|
| Operating EPU | 17.3 cents | +13.1% |
| DPU | 17.0 cents | +11.8% |
| Net Property Income | $119.9M | +10% |
| Like-for-Like NPI Growth | ~4.2% | Organic |
| NTA per Unit | $3.93 | +1.8% |
NTA per unit: $3.93, up 1.8%. In a period where the market priced in asset value declines, NTA moved in the opposite direction, a signal that the portfolio’s income fundamentals are absorbing rate headwinds rather than buckling under them.
When big ASX news breaks, our subscribers know first
Why a 26% discount to fair value persists after a strong result
Three prices frame the valuation disconnect. At $2.75, CQE’s units trade at roughly 30% below NTA of $3.93 and approximately 26% below Morningstar’s fair value estimate of $3.70 per unit (no-moat rating, analyst Yingqi Tan, CFA).
A-REIT unit prices reflect market sentiment and interest rate expectations rather than underlying building values, which means listed property can sell off materially before physical property valuations move, a structural feature that helps explain why CQE’s units trade at a 30% discount to NTA even as the portfolio itself is independently valued at $2.3 billion with 99.7% occupancy.
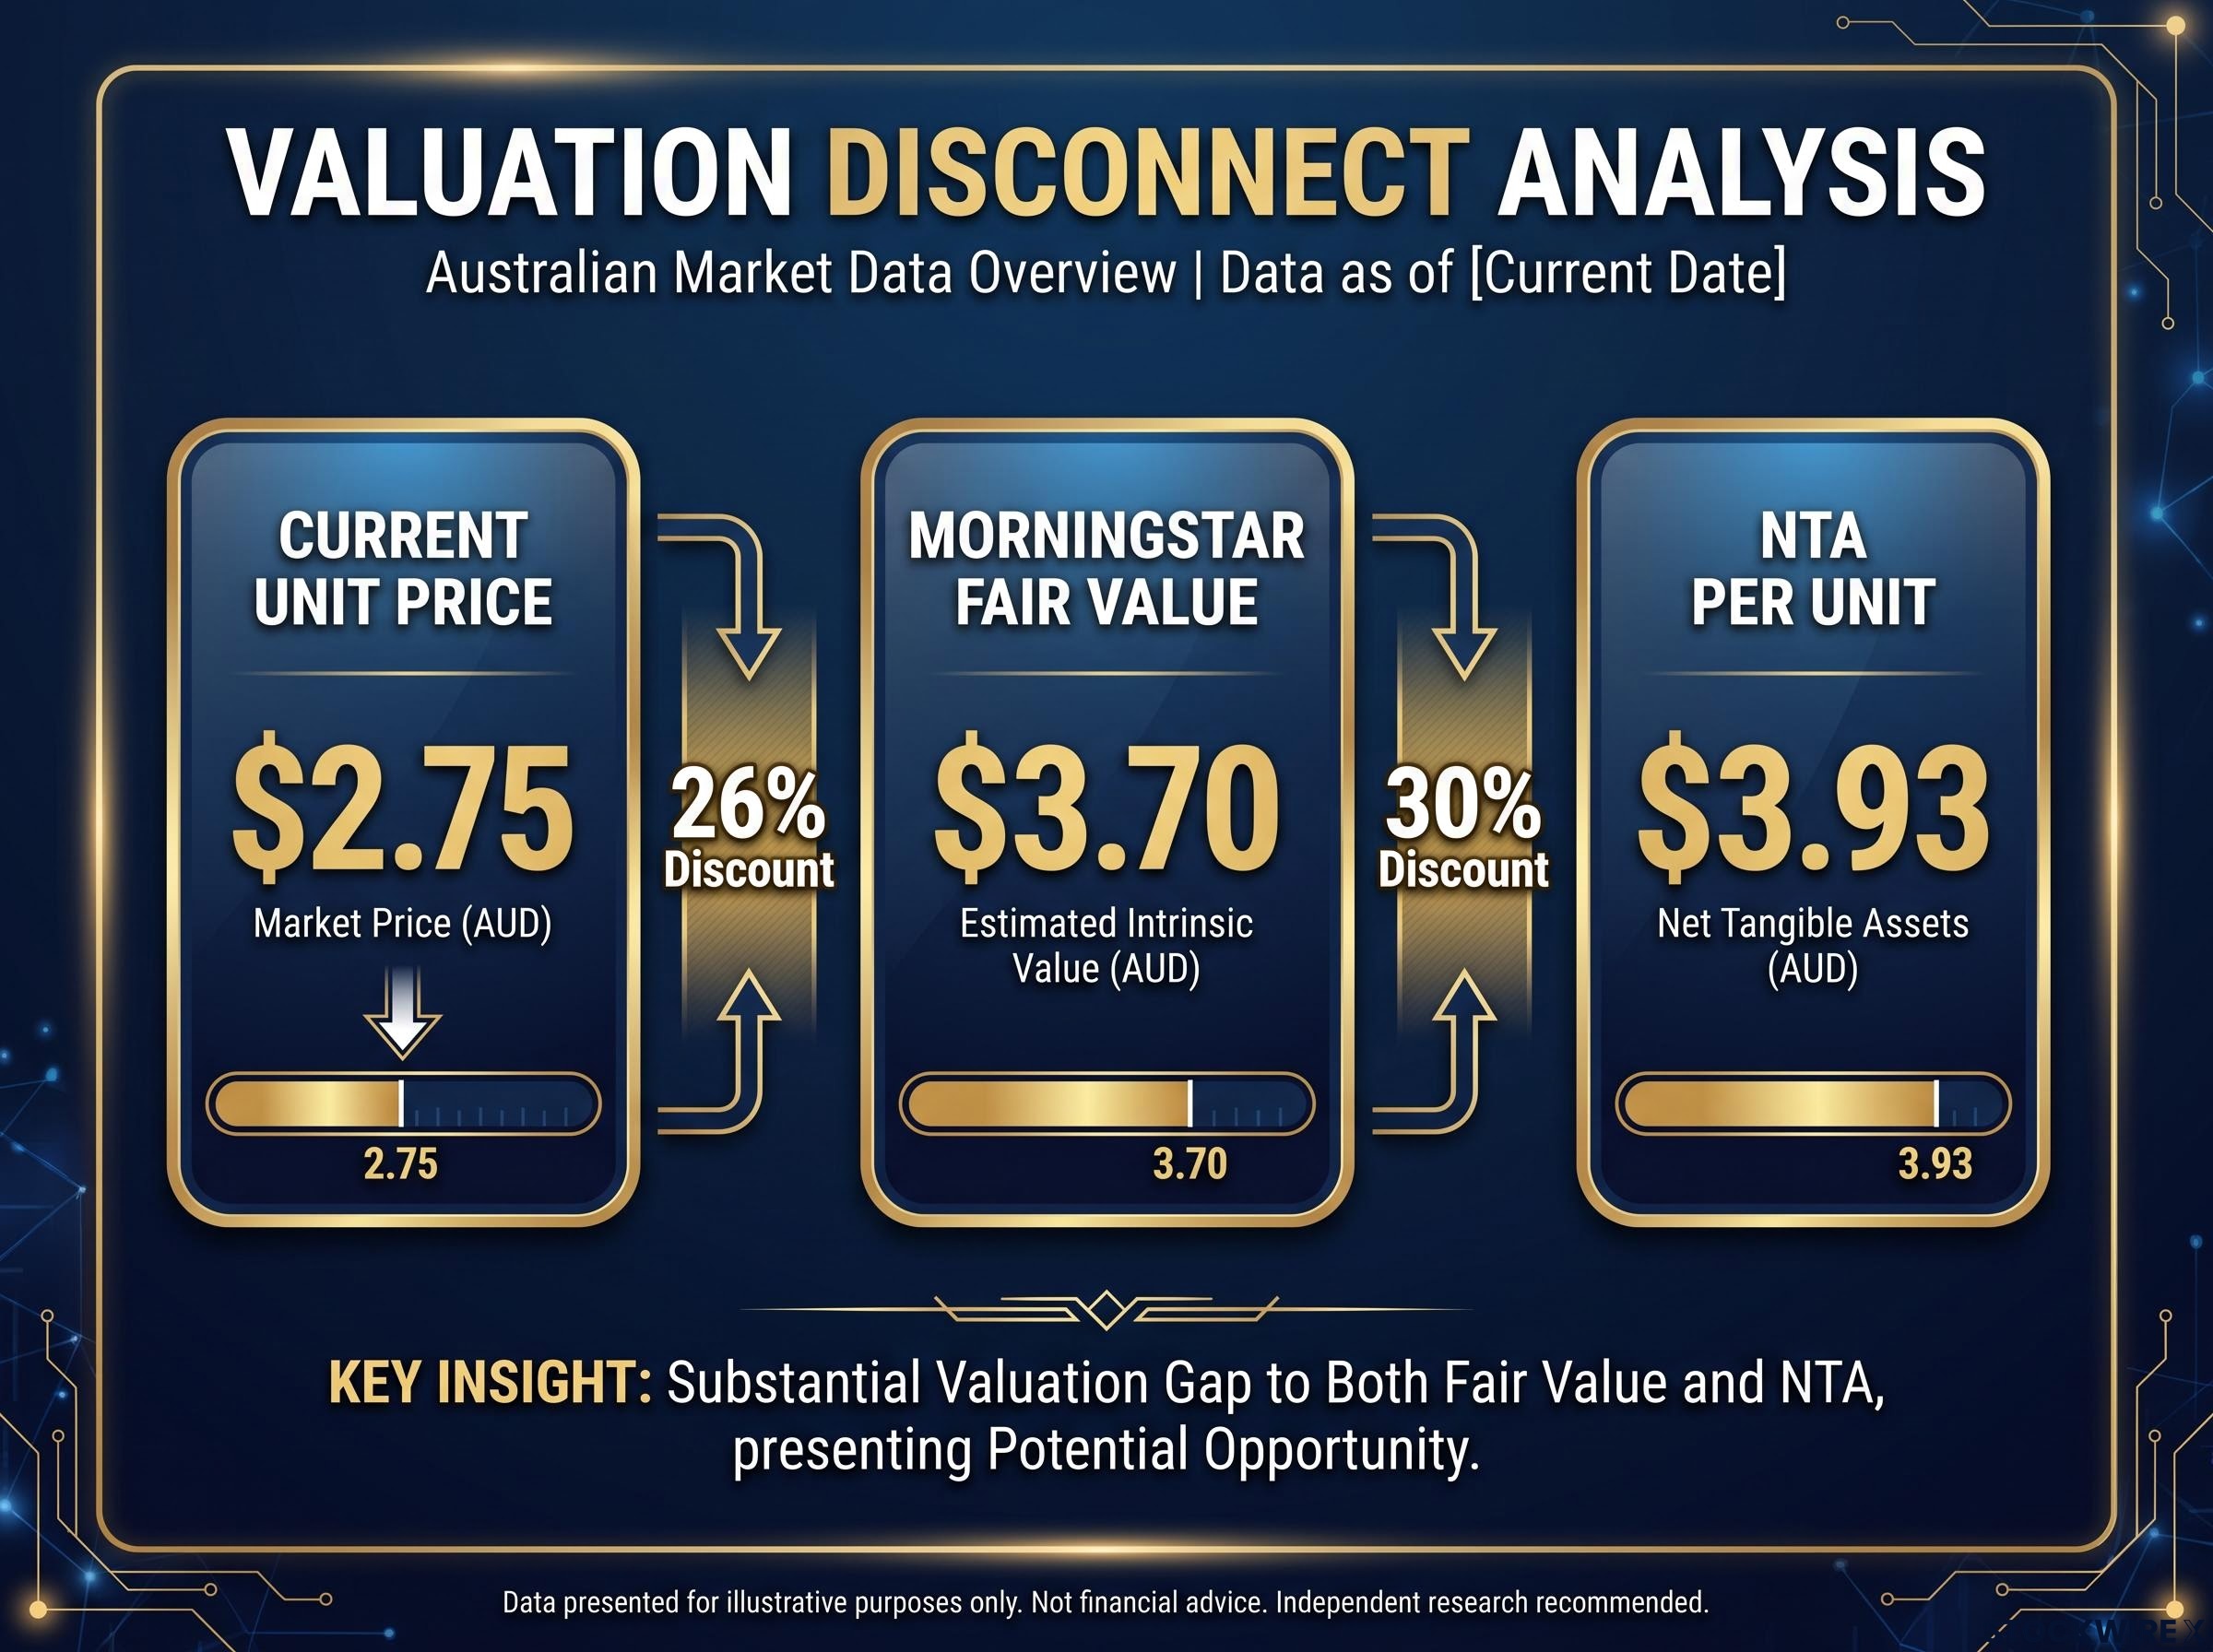
- Unit price: $2.75 (approximately 30% discount to NTA)
- NTA per unit: $3.93
- Morningstar fair value: $3.70 (approximately 26% discount)
The market’s dominant concern is straightforward: if Australian bond yields stay elevated or rise further, capitalisation rates will expand, and property values will fall, regardless of how strong the rental income is. That concern has kept the discount wide across the listed property sector, and CQE has not been spared.
The near-9% surge on results day is itself a signal. It suggests consensus had the stock positioned for a weaker outcome. Yet the rally only partially closed the gap, which means the market is still pricing in a scenario that the FY2026 result did not validate.
What bond yields have (and have not) done to the portfolio
Capitalisation rates measure the relationship between a property’s net rental income and its market value. When bond yields rise, cap rates tend to follow, because investors demand higher returns from property to compensate for the higher risk-free rate available in bonds. Higher cap rates mechanically push property values down.
That pressure was real in FY2026. But the portfolio’s CPI-linked and market rent reviews generated sufficient income growth to more than counteract cap rate expansion, leaving NTA nudging higher rather than declining. The anticipated erosion of asset values has not, to this point, shown up in the actual portfolio numbers. The discount may reflect a fear that has not yet materialised, not a forecast that has been validated.
The asset base that makes the income stream defensible
The yield and the long weighted average lease expiry (WALE, the average remaining term across all leases in the portfolio) only mean something in the context of what CQE actually owns.
The portfolio spans 295 properties valued at $2.3 billion, concentrated in early learning, childcare, education, healthcare, and broader social infrastructure. These are not discretionary retail centres or CBD office towers. They are assets serving non-discretionary demand, the kind of services that communities require regardless of the economic cycle.
- Properties: 295 across Australia
- Portfolio value: $2.3 billion
- WALE: 11.4 years
- Occupancy: 99.7%
- Tenant profile: government or government-linked, essential services
- Lease reviews: CPI/index-linked or market rent reviews
The tenant profile is where the defensiveness becomes structural. Government or government-linked tenants carry lower default risk than commercial tenants exposed to consumer spending cycles. An 11.4-year WALE across near-full occupancy gives forward income visibility that most listed income vehicles cannot match.
The 39% non-early learning income figure is the result of a deliberate portfolio diversification strategy, most visibly executed through the $53 million acquisition of a 25% stake in Sonic Healthcare’s central Queensland pathology laboratory on a 20-year triple net lease, funded without equity dilution by divesting nine early learning properties at a 3.4% premium to book.
The Child Care Subsidy data for March quarter 2026 from the Department of Education captures the scale of government-backed demand underpinning CQE’s largest asset class, with subsidy volumes and service utilisation rates reflecting the structural, policy-supported nature of childcare demand across Australia.
99.7% occupancy across 295 properties. That is not a headline figure propped up by a handful of anchor tenants. It reflects portfolio-wide demand for the essential services these assets house.
What this tells you is that the approximately 6.5% forward yield is not a distressed yield reflecting credit or vacancy risk. It is a market-priced discount applied to a genuinely defensive income stream, one whose risk profile looks materially different from the yield alone might suggest.
FY2027 guidance and what it implies for income investors
Management’s FY2027 guidance, issued alongside the FY2026 result, points to continued growth. Operating EPU is expected to grow by at least approximately 4.6% from the 17.3 cent base, implying a floor of approximately 18.1 cents. Distribution guidance of approximately 18.0 cents represents 5.9% growth, with recently completed acquisitions adding incremental earnings that underpin the uplift.
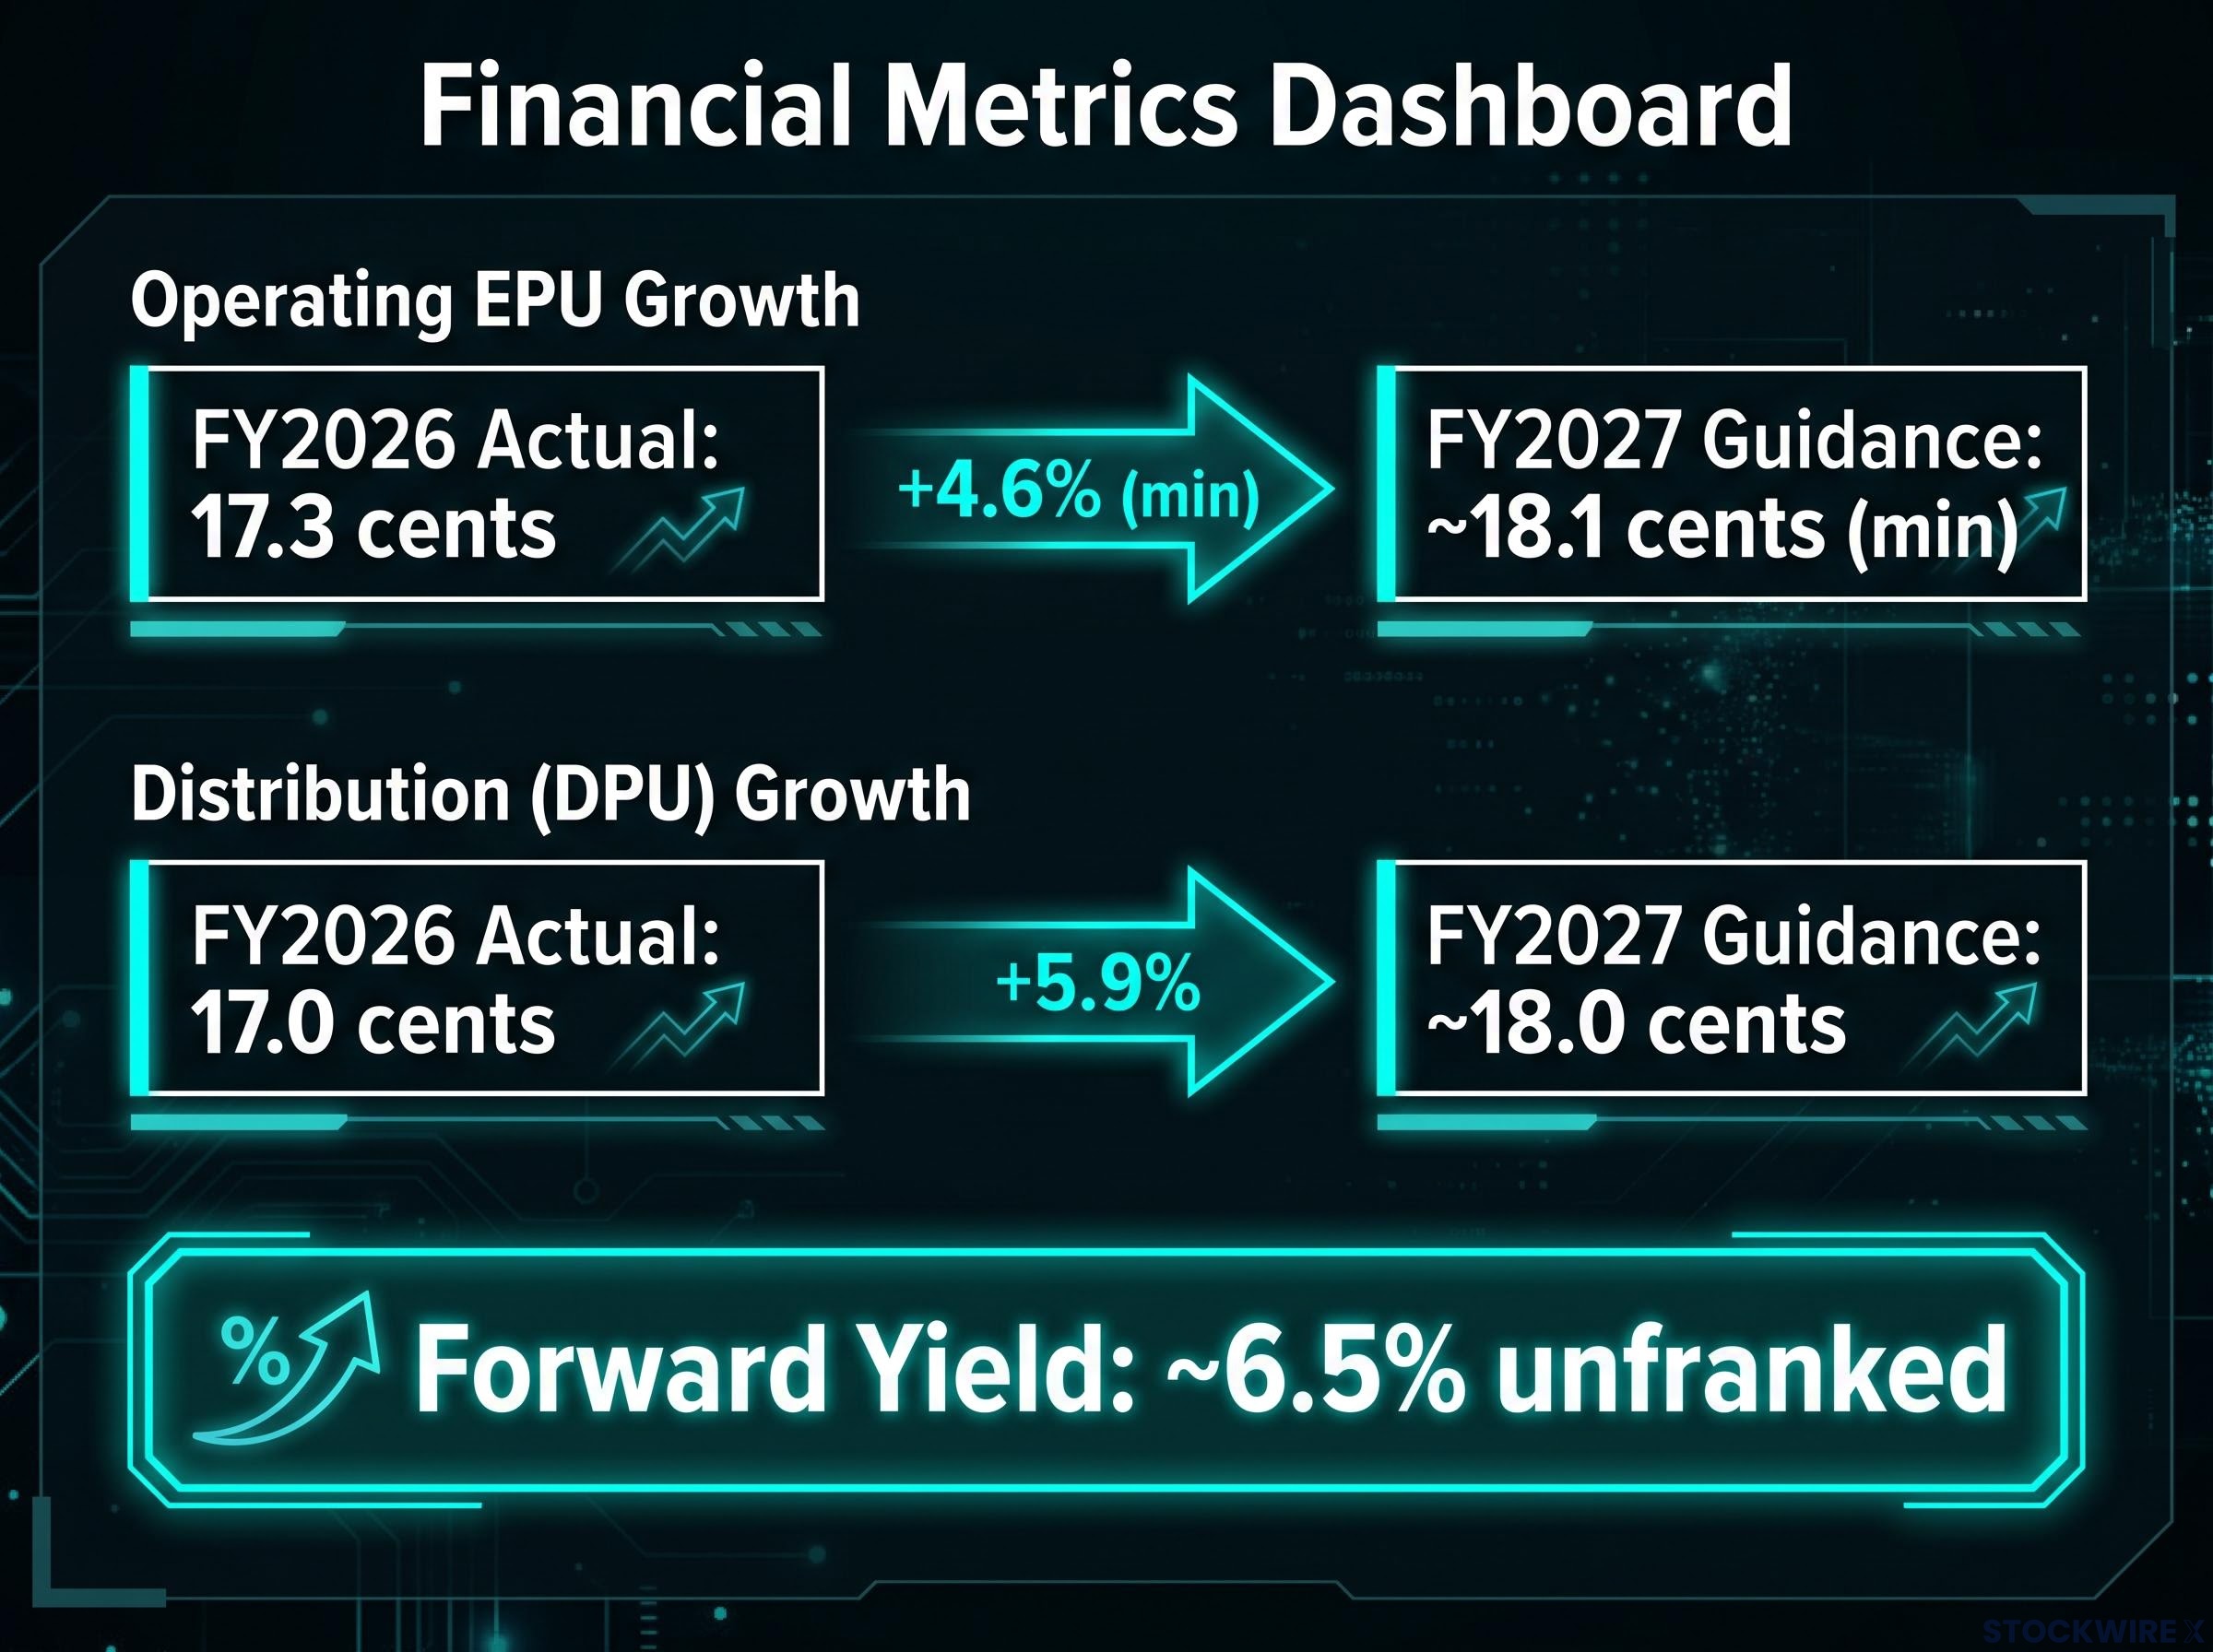
| Metric | FY2026 Actual | FY2027 Guidance | Change |
|---|---|---|---|
| Operating EPU | 17.3 cents | ~18.1 cents (min) | +4.6% (min) |
| DPU | 17.0 cents | ~18.0 cents | +5.9% |
| Forward Yield (at $2.75) | ~6.5% unfranked | ||
| Payout Ratio | ~100% |
At a unit price of $2.75, the 18.0 cent forward distribution equates to an unfranked yield of approximately 6.5%. The near-100% payout ratio is standard for Australian REITs, but it leaves limited buffer if earnings undershoot. What this combination tells you is that you are being paid an income premium that reflects the market’s rate-risk concerns, not underlying asset or tenant weakness. Comparing that 6.5% against alternative income sources is where the allocation decision sits.
For income-focused investors wanting to benchmark CQE’s 6.5% unfranked yield against alternative ASX income sources, our dedicated guide to passive income investing on the ASX covers dividend ETFs, bond instruments, and cash rates with actual yield data, including how to identify yield traps where headline figures mask capital volatility.
Risks that keep the discount in place
The bear case deserves its full weight.
- Interest rate and cap rate risk: If bond yields remain elevated or rise further, capitalisation rate expansion could pressure NTA even if operating income holds. This is the primary reason the market discounts CQE relative to underlying asset values.
- Payout ratio buffer: With distributions essentially matching operating earnings at close to 100%, any shortfall in rental growth, occupancy, or an adverse move in funding costs could force a distribution reassessment. There is limited room for error.
- Debt refinancing: The weighted average debt maturity of 3.8 years is not an immediate concern, but it is the variable most dependent on the rate environment. If rates remain elevated when facilities come due, refinancing costs could compress earnings.
- Acquisition integration: Part of the FY2027 guidance uplift depends on recently completed acquisitions performing to expectation. If these assets carry shorter leases or weaker tenant covenants than the existing portfolio, earnings growth could disappoint.
- Sector perception: Listed markets may continue to apply a structural discount to property as an asset class regardless of CQE-specific fundamentals, particularly while rate uncertainty persists.
The 3.8-year debt maturity figure is the one most sensitive to the rate environment. It tells you that refinancing risk is real but not immediate, and the thesis has a time window before it becomes a material headwind.
Debt refinancing mechanics across the Charter Hall stable illustrate what rate-environment execution looks like in practice: Charter Hall Long WALE REIT’s $2.0 billion secured refinance in June 2026 extended weighted average maturity to 4.3 years while cutting the credit margin by 20 basis points, a result that directly increased distributable earnings rather than eroding them.
What the FY2026 result changes, and what it does not
The FY2026 result strengthens the mispricing case. Double-digit earnings growth, distribution growth, and a modestly higher NTA, delivered at a time when many investors had positioned for weaker asset values and softer earnings, constitutes direct evidence that the operating fundamentals held firm against rate headwinds.
But it does not remove the risk. If bond yields rise from here, or stay elevated longer than rental escalation can offset, NTA could come under genuine pressure. The near-100% payout ratio means the distribution has limited cushion beneath it.
The market’s near-9% reaction on results day tells you the operating fundamentals were better than consensus expected. Yet the discount remains, which in itself is an analytical signal: the market is not disputing the FY2026 result; it is pricing in a forward scenario the result has not yet disproved.
Morningstar fair value: $3.70 per unit. The no-moat, unchanged assessment from analyst Yingqi Tan, CFA, anchors the valuation gap this result has put back in focus.
For income-focused investors, the core valuation anchors are clear: $2.75 unit price, $3.70 Morningstar fair value, $3.93 NTA, 6.5% forward yield. The variables that determine whether the discount narrows or widens are the rate environment, the payout ratio’s margin of safety, and whether the portfolio continues to translate rental escalation into stable or rising NTA. Those are the three inputs worth monitoring from here.
This article is for informational purposes only and should not be considered financial advice. Investors should conduct their own research and consult with financial professionals before making investment decisions. Past performance does not guarantee future results. Financial projections are subject to market conditions and various risk factors.
—