Most investors watch quarterly earnings, annual returns, and the price action of the past few months. That is the lens the market gives you by default. But some of the most consequential forces shaping commodity prices operate across decades, largely invisible until they are already well advanced.
The framework that captures those forces is the commodity supercycle. It is not a fringe concept. Major banks, institutional asset managers, and policymakers use it to distinguish structural price regimes from ordinary market noise. As of mid-2026, the term is gaining traction again as multiple structural forces converge, and understanding what it actually means has become practically relevant, not merely academic.
Here is what this covers: the precise definition that separates a supercycle from an ordinary bull market, the supply-side mechanics that make supercycles so persistent, the three documented episodes and what triggered each one, and the analyst case for whether a new cycle is forming now. By the end, you will be able to evaluate that case against the historical template yourself, rather than accepting or rejecting it on authority alone.
What makes a commodity supercycle different from an ordinary price move
You already know commodity prices go up and down. They respond to weather, inventory cycles, interest rates, and speculative flows. A supercycle is not simply a bigger version of that.
A commodity supercycle is a multi-decade period in which a broad range of commodity prices remain persistently above (or below) their long-run trend, driven by structural shifts rather than short-term shocks. Three characteristics define it:
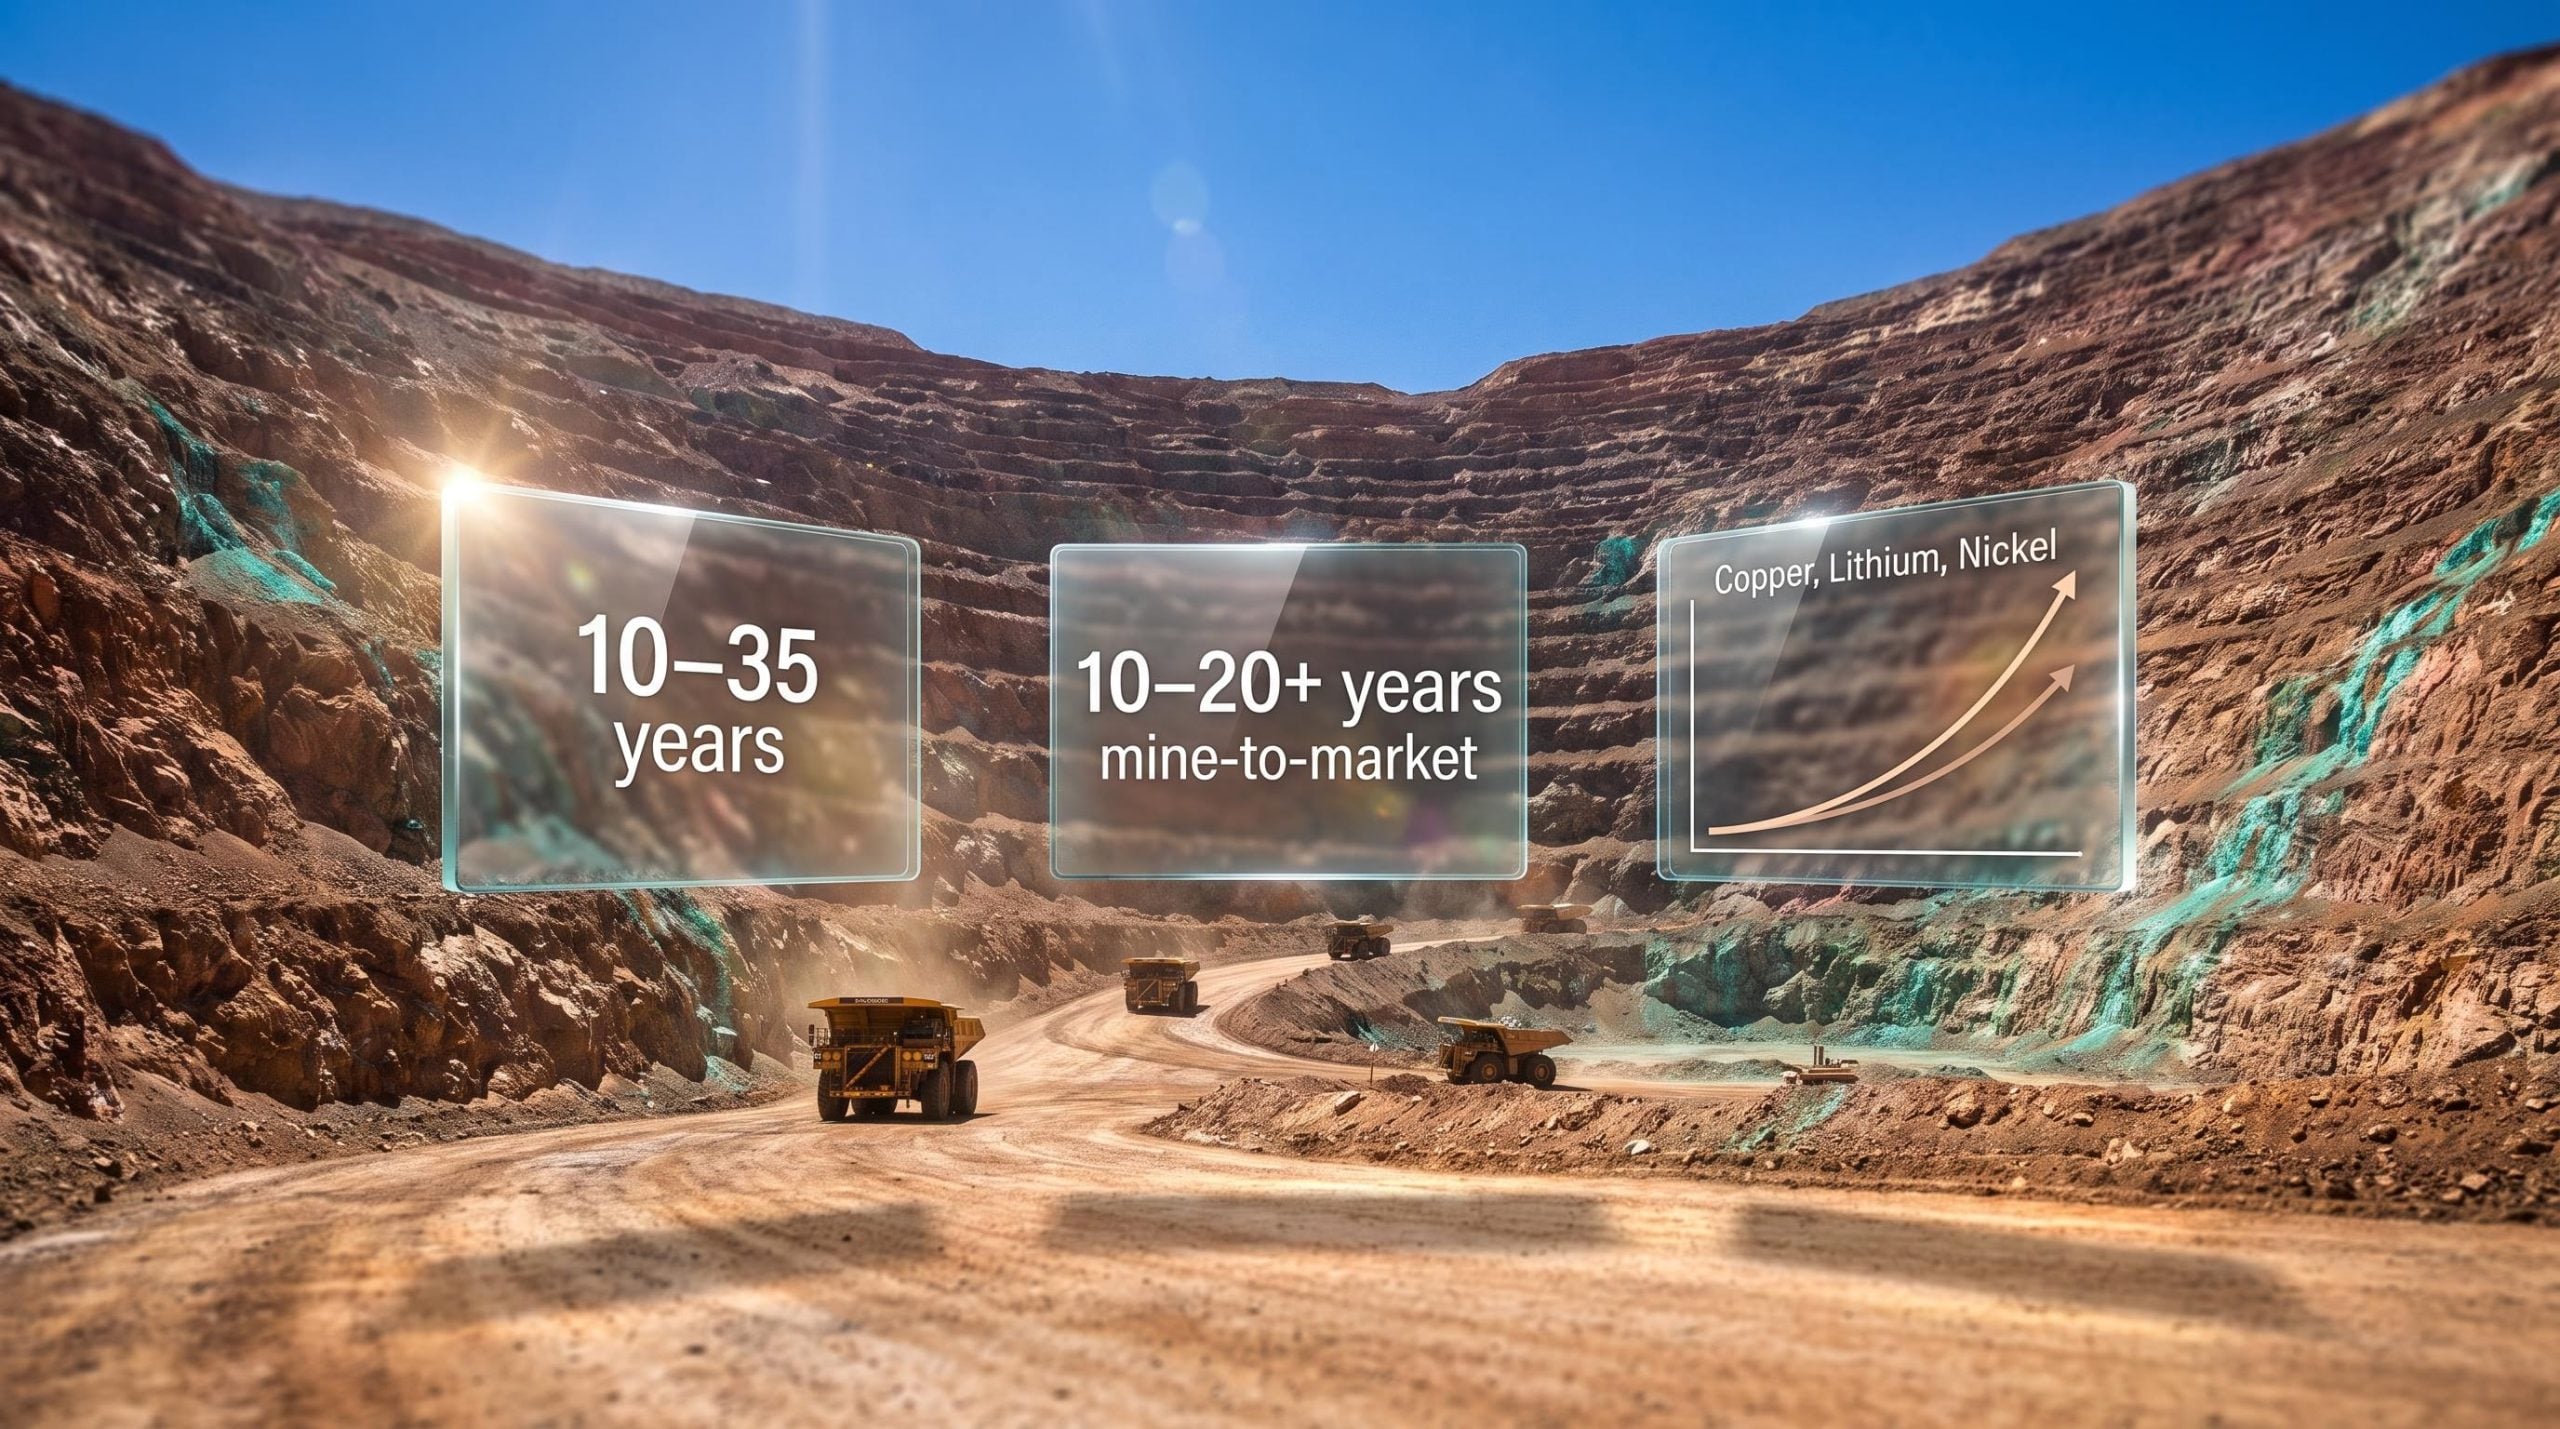
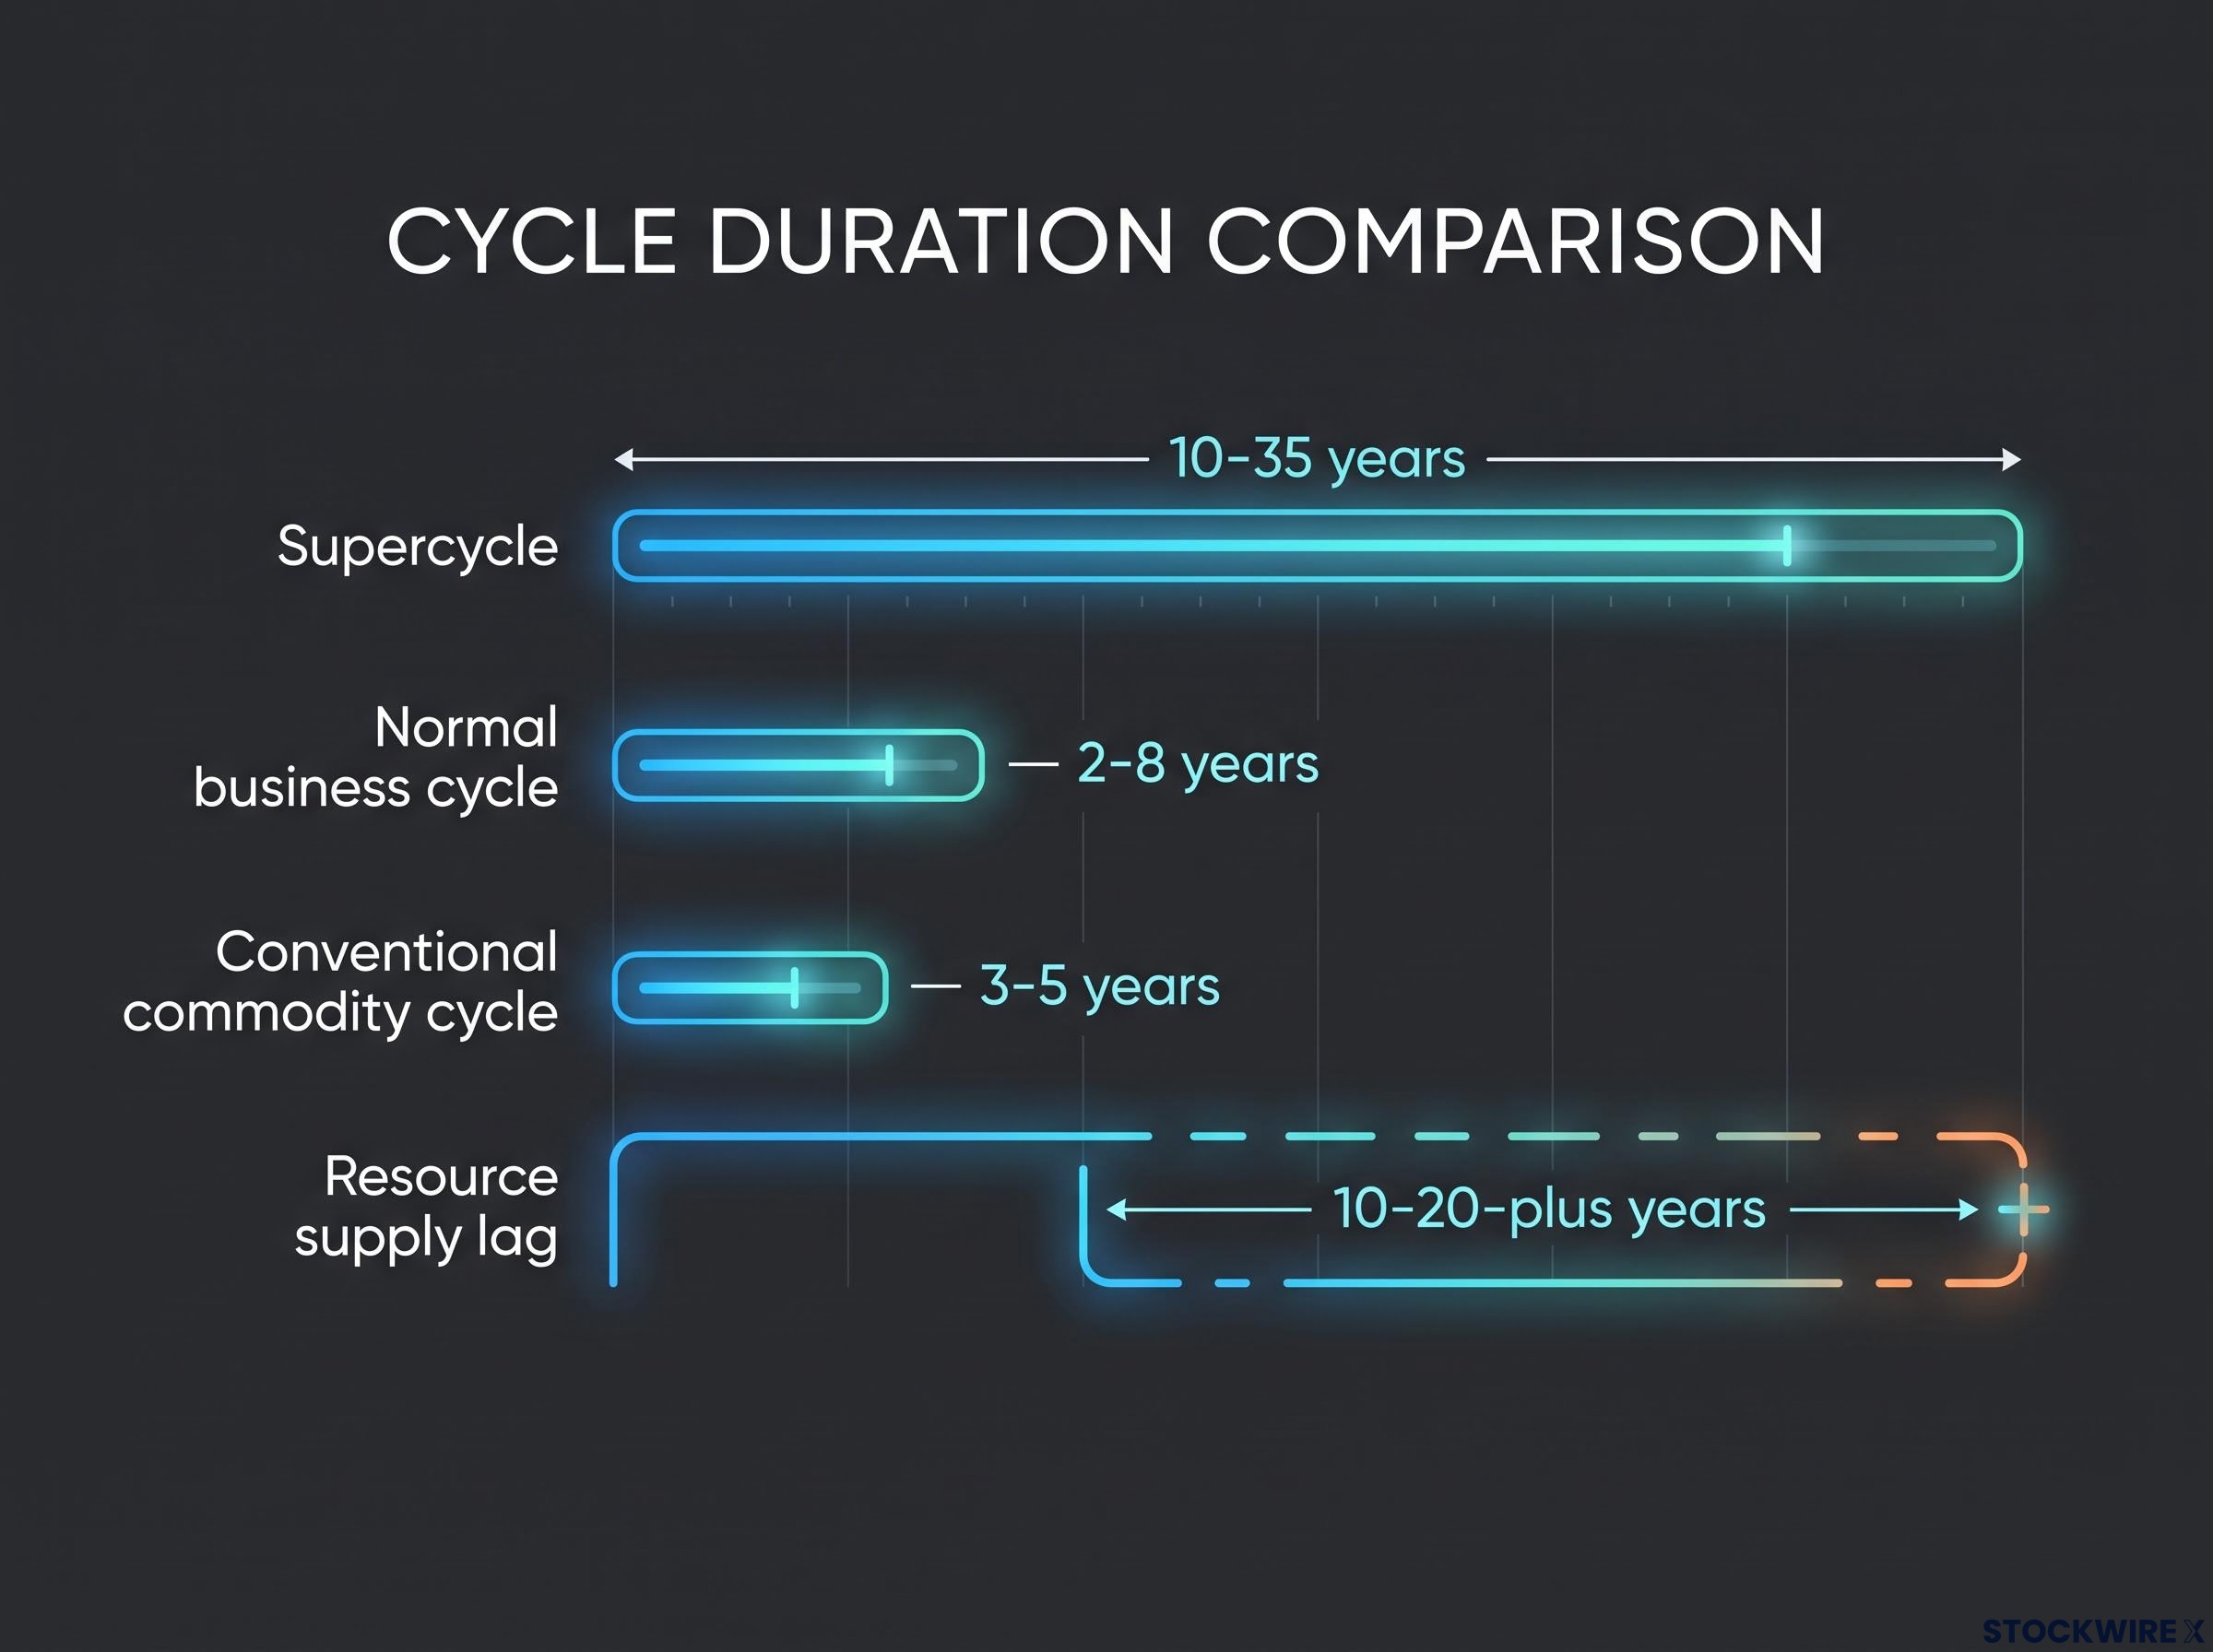
The IMF supercycle research by Cuddington and Jerrett defines supercycle expansions as lasting 10-35 years, with complete cycles spanning 20-70 years, providing the empirical foundation that most subsequent analyst frameworks, including those used by major banks today, draw on when assessing whether current conditions qualify as a new regime.
- Extended duration: supercycles typically last 10-35 years, outlasting normal business cycles (usually 2-8 years) and conventional 3-5 year commodity cycles
- Secular character: the price regime is structural, not tied to any single business cycle or interest rate environment
- Broad-based scope: prices move across energy, metals, and agricultural commodities simultaneously, not just in one category
The distinction between a supercycle and an ordinary bull market is not semantic. It determines whether a price environment warrants a structural adjustment to your investment strategy or simply a tactical tilt.
Sector rotation signals tend to move ahead of official economic data, and during a supercycle regime the conventional rotation playbook changes: resource-producing sectors can sustain leadership for years rather than the one to two quarters typical of a standard business cycle phase, complicating timing frameworks built for shorter horizons.
Three things a supercycle is not
- A short-term price spike: weather events, temporary supply disruptions, or speculative surges can push prices sharply higher for months or a couple of years, then reverse. Supercycles persist for decades.
- An ordinary commodity bull market: these can be strong but remain tied to business cycles, inventory dynamics, and interest rate movements. They rotate over shorter timeframes.
- A single-commodity boom: one metal or one energy source surging does not constitute a supercycle. The phenomenon requires breadth across multiple commodity categories simultaneously.
When big ASX news breaks, our subscribers know first
The engine behind supercycles: why supply cannot keep up
Supercycles do not appear at random. They follow a logic chain that, once you see it, makes their persistence feel almost inevitable.
- A rare, large-scale economic transformation emerges. Industrialisation, post-war reconstruction, or an energy-system shift creates new and sustained demand for raw materials across multiple categories.
- Demand growth outpaces existing supply capacity. The transformation is large enough that current production cannot absorb the additional requirements, and prices begin rising.
- Supply cannot respond quickly. Bringing new mining and resource capacity online is both capital-heavy and extraordinarily slow, with the journey from initial discovery through to full output commonly spanning 10-20-plus years. New capacity simply cannot arrive fast enough.
- The investment cycle compounds the lag. After a previous price bust, exploration and capital expenditure fall sharply. That depletes the project pipeline precisely when the next demand surge arrives, widening the gap further.
The supply-side reality: From the moment a deposit is identified to the point of full-scale extraction, resource projects routinely consume 10-20-plus years. That timeline is not a market failure waiting to be corrected. It is an embedded feature of how resource extraction works.
This is why supercycles persist far longer than most market participants initially expect. Once the structural demand arrives and the supply lag is established, elevated prices tend to hold for years or decades before enough new capacity and consumption adjustments bring them back toward trend. Understanding this mechanism is your foundation for evaluating any forward-looking supercycle argument, including the one being made right now.
The three documented supercycles and what triggered each one
Academic and market research typically identifies three to four major supercycles since the late 19th century. The count depends on methodology: some frameworks treat the 1970s-1990s oil and resource cycle as a distinct supercycle, while others fold it into broader long-run cycles. Both positions are academically defensible. The three most widely agreed-upon episodes share a strikingly consistent structural signature.
| Supercycle | Approximate Dates | Primary Demand Driver | Key Commodities Involved |
|---|---|---|---|
| First | 1899 to early 1930s | U.S. industrialisation (railroads, steel, electrification) and European post-WWI reconstruction | Steel, copper, iron ore, coal, timber |
| Second | 1939 to 1961 | WWII mobilisation followed by post-war reconstruction (Marshall Plan) and U.S. expansion | Metals, energy, industrial materials |
| China-driven | Late 1990s to 2010s | China’s WTO accession (2001), rapid urbanisation, and infrastructure build-out | Steel, copper, coal, iron ore, energy |
| Contested entry | 1970s to 1990s | Oil shocks and broader resource demand; treated as a distinct supercycle in some frameworks | Oil, industrial commodities |
The first supercycle took shape as America’s expanding rail network, steelworks, and electrification programmes generated broad-based appetite for raw materials over several decades. As those domestic pressures matured, the need to rebuild European economies shattered by World War I sustained the demand pulse further. The Great Depression ended it by collapsing global demand.
The second followed the same structural pattern at a larger scale. The wartime mobilisation of the early 1940s drew heavily on metals, energy, and industrial materials across every major economy. Reconstruction programmes that followed, including the Marshall Plan in Europe, then kept commodity consumption running at elevated levels well into the 1960s.
The China-driven supercycle is the most recent and most widely recognised. WTO membership in 2001 opened global markets to Chinese goods and accelerated an urbanisation process already underway, generating simultaneous raw-material requirements on a scale the world had not previously seen. Global supply, built for a pre-China world, could not ramp up fast enough.
The China-driven supercycle peaked around 2011 before unwinding through the mid- to late 2010s as Chinese growth matured and infrastructure build-out slowed.
The pattern across all three episodes is consistent: a large-scale, policy-anchored economic transformation in a major economy collides with an under-supplied commodity market. When you see that structural signature, the supercycle conditions are present.
How supercycles ripple through the global economy
If you are not a commodity trader, you might assume supercycles are someone else’s story. They are not. A supercycle is a macroeconomic regime shift that touches your portfolio whether or not you hold a single resource stock.
The effects move through four channels simultaneously:
- Inflation and monetary policy: persistently higher input costs can keep inflation elevated well beyond the normal business-cycle horizon, influencing central bank decisions on interest rates for years. That affects your bond yields, your mortgage rate, and the discount rate applied to every growth stock you own.
- Country-level winners and losers: commodity-exporting nations (resource-rich economies like Australia, Canada, Brazil, and several Middle Eastern and African states) tend to see fiscal improvement, stronger growth, and currency appreciation. Net importing nations face cost pressure, widening trade deficits, and political strain from higher consumer prices.
The 2026 oil supply shock, which pushed Saudi crude output to a 36-year low and WTI above $101 per barrel, illustrates the inflation and monetary policy channel the article describes: persistently elevated energy prices are already reshaping central bank rate expectations in a way that extends well beyond a single business cycle.
How it reaches your portfolio
- Sector dynamics: resource-producing industries (energy, mining, agriculture) experience prolonged profit booms and heavy investment inflows. Downstream sectors relying on those inputs, including manufacturing, construction, transport, and chemicals, face margin compression that can persist for years.
- Capital allocation: supercycles tend to coincide with extended periods of outperformance for resource equities, certain emerging markets, and inflation-linked assets. If your portfolio is built around the assumption that the last decade’s winners will keep winning, a supercycle can quietly erode that thesis over time.
For any reader with global exposure, a supercycle is not background news. It is a multi-year force reshaping which assets outperform and which face structural headwinds, making it directly relevant to allocation decisions you are making right now.
Structural shifts versus cyclical peaks: the current supercycle debate
The analyst community has increasingly coalesced around the view that mid-2026 conditions bear the hallmarks of a new commodity supercycle in its early phase. The structural demand case rests on three drivers that, unlike ordinary cyclical forces, are anchored in long-term policy frameworks:
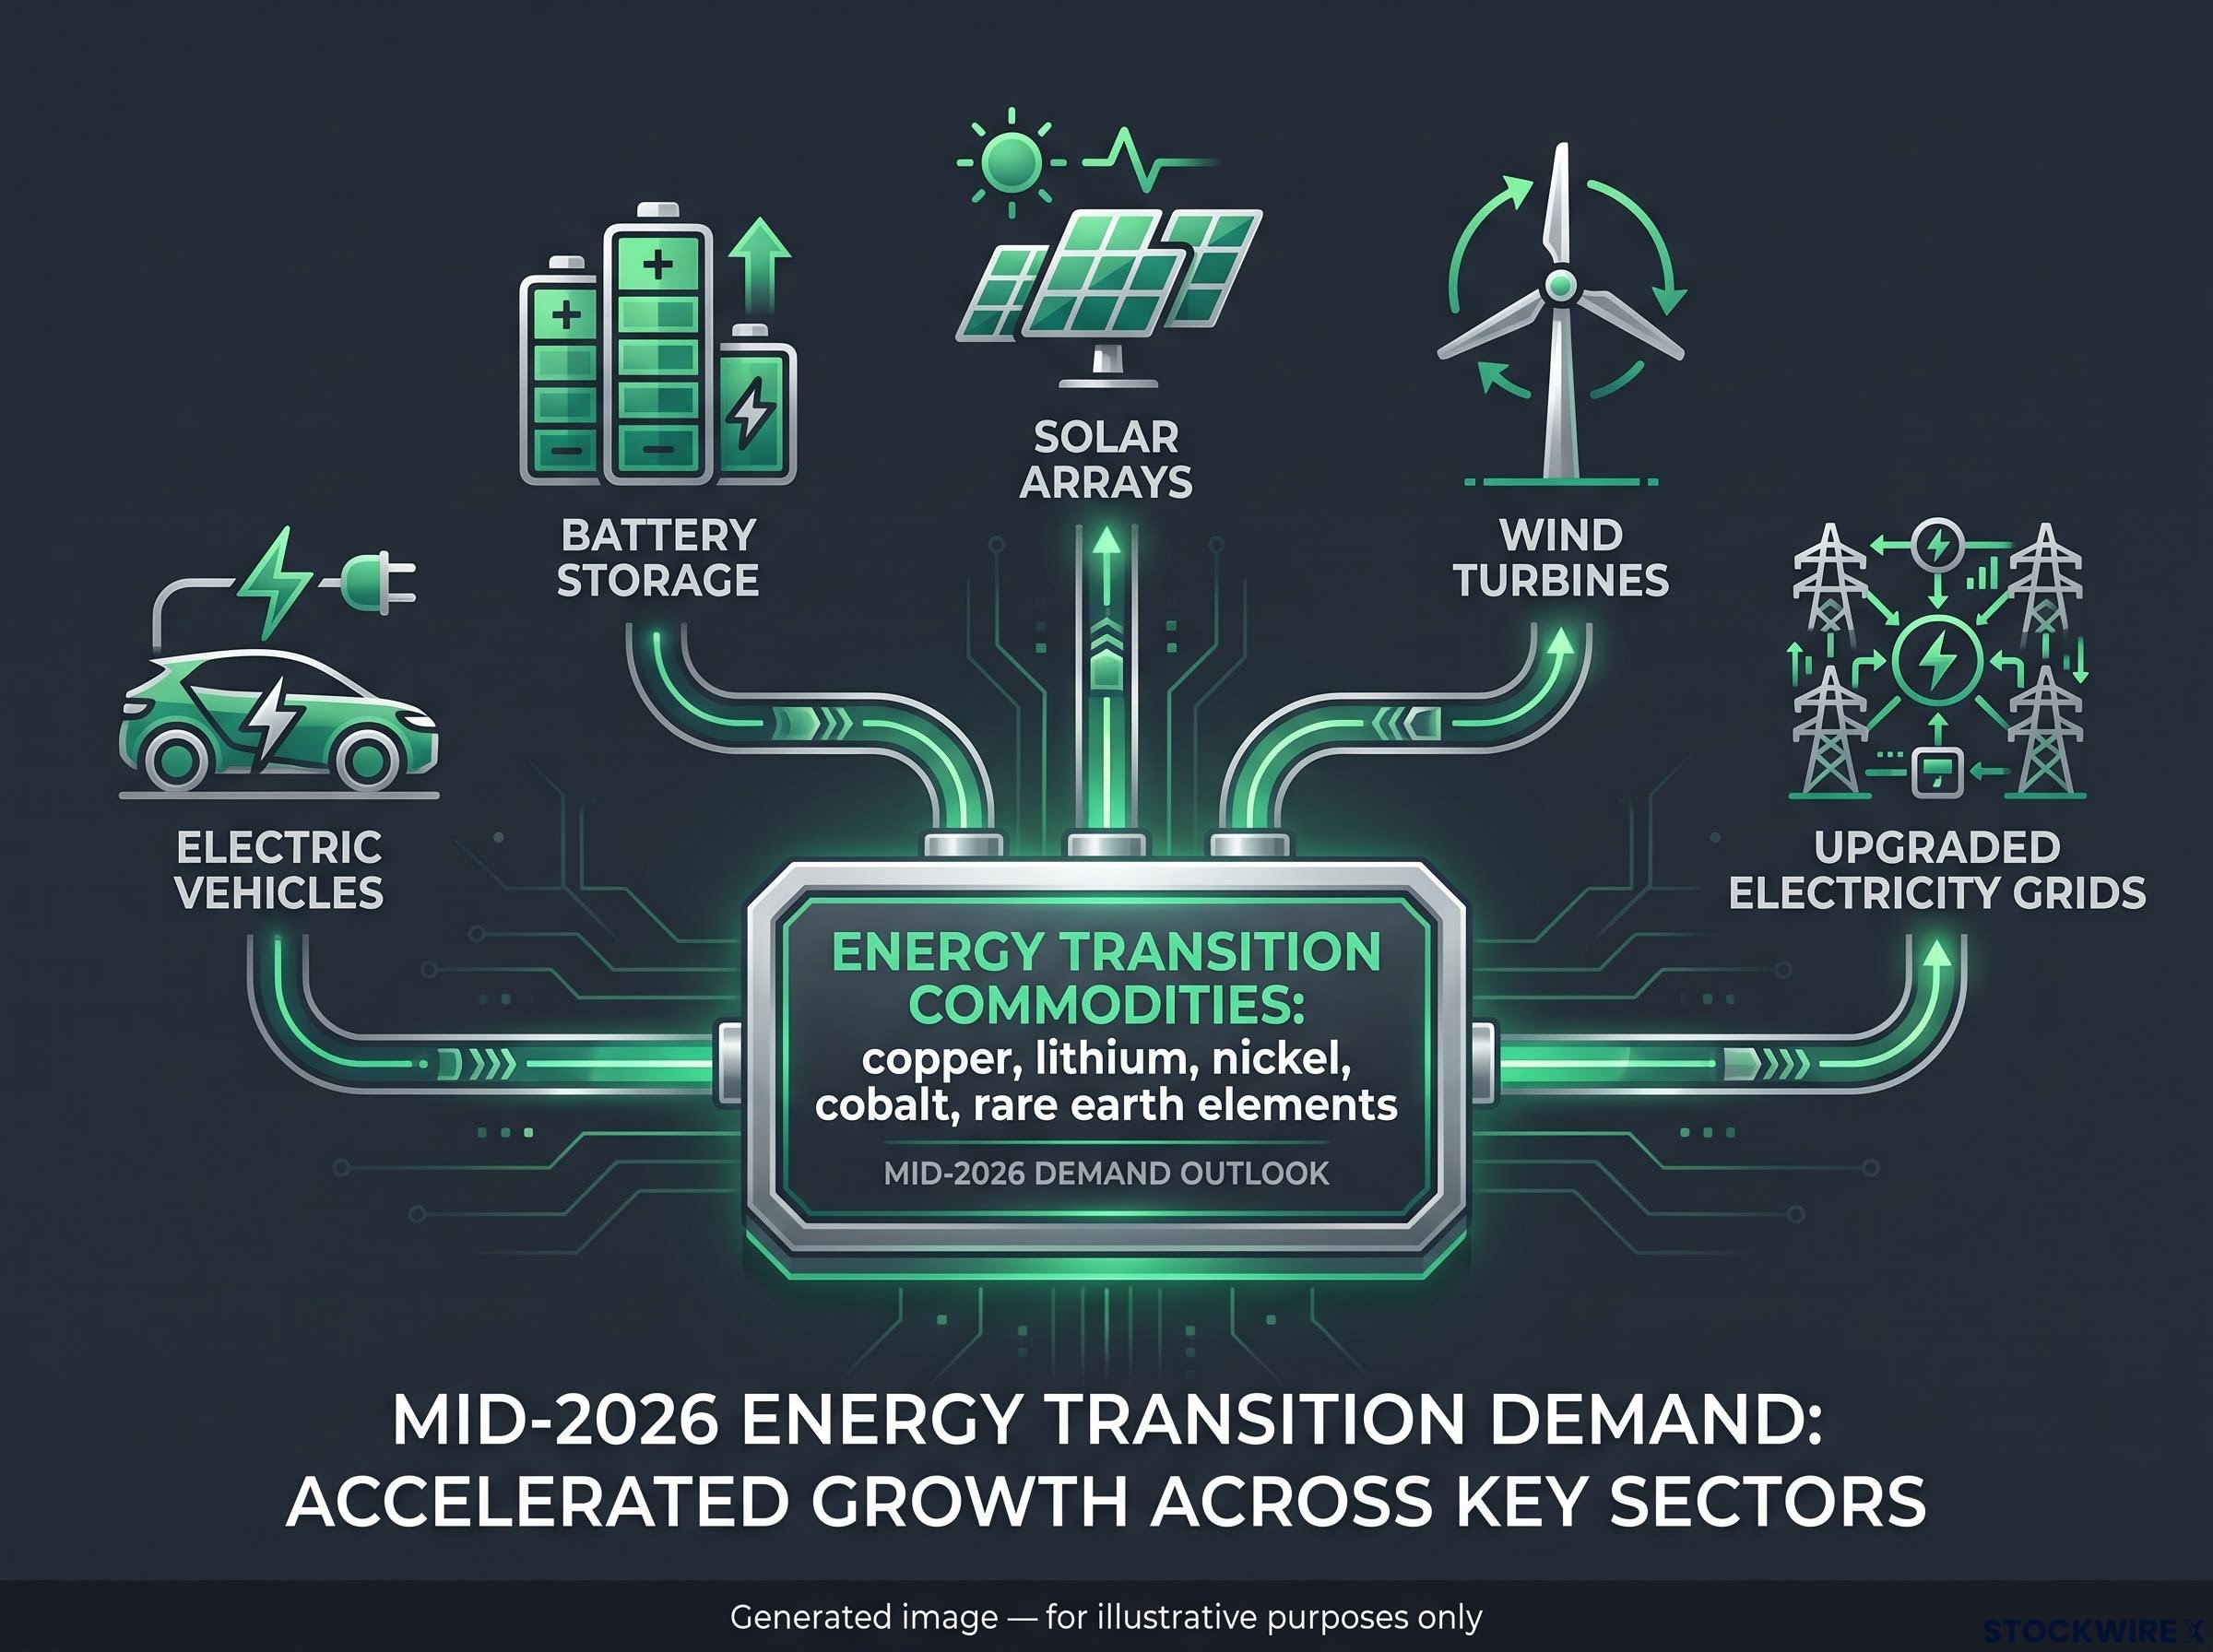
- The global energy transition: decarbonisation at the scale required by net-zero targets calls for sustained, large-volume consumption of copper, lithium, nickel, cobalt, and rare earth elements across the full range of clean-energy infrastructure, from electric vehicles and battery storage through to solar arrays, wind turbines, and upgraded electricity grids. Because decarbonisation targets are written into long-term government policy, this demand is policy-anchored rather than purely market-driven.
- Geopolitical fragmentation and reshoring: nations are moving deliberately to bring critical mineral supply chains within their own borders or those of trusted partners. The resulting combination of defence procurement, strategic reserve-building, and supply-chain resilience legislation creates a base of structurally supported demand that does not switch off when market prices fluctuate.
- Prolonged underinvestment in supply: the years that followed the China supercycle’s peak saw miners and energy producers pull back sharply on exploration budgets and development spending. That contraction left the project pipeline unusually thin at precisely the moment transition-metal demand began to accelerate, pointing to a supply gap that could prove both deeper and longer-lasting than those seen in earlier cycles. Additional momentum comes from AI infrastructure buildout and demographic factors in emerging economies.
Societe Generale’s move to quadruple its commodities allocation from 5% to 20% in a single step in June 2026 illustrates how major institutional players are translating the structural demand thesis into actual portfolio positioning, with five overlapping demand drivers cited as the basis for a regime-level conviction shift.
If you map these drivers against the historical template, the structural signature is recognisable: a large-scale economic transformation, policy-anchored demand, and constrained supply. The pattern matches.
What the sceptics argue
The counterarguments carry genuine weight:
- Supply may respond faster than expected. New extraction technologies, recycling capacity, and alternative materials could shorten the lag.
- Policy trajectories can shift. Government commitments to net-zero and reshoring may soften under fiscal pressure or political change.
- This may be a strong cyclical move, not a structural one. The current price dynamics could prove to be an ordinary commodity cycle of unusual strength rather than a multi-decade regime.
- Supercycles can only be definitively identified in hindsight. By definition, confirmation requires years of additional data showing sustained above-trend pricing.
The epistemic boundary: academic research consistently notes that supercycles can only be identified with confidence in hindsight, once full peak-and-trough behaviour is visible. Any current assessment, however well-grounded, remains conditional.
The forward-looking discussion reflects analyst consensus as of mid-2026 and remains subject to evolution with new data. You should hold both things simultaneously: the structural demand case is coherent and historically grounded, and the verdict will not arrive for years.
Where the evidence on a new supercycle actually lands as of mid-2026
Three to four documented supercycles all share the same structural signature: a large-scale economic transformation collides with a supply side that cannot respond quickly enough. The current setup, where the energy transition, geopolitical reshoring, and prolonged underinvestment converge, matches that template in several key dimensions.
What is confirmed is that the structural demand drivers are real and policy-anchored. What remains open is whether supply responds slowly enough, and for long enough, to constitute a true supercycle rather than a strong but shorter cycle. That distinction will only become clear with years of additional data.
The most useful thing you take from this is the framework itself. Even if the current cycle proves shorter or weaker than the historical supercycles, the supercycle lens changes the questions you ask about commodity markets. It forces you to distinguish noise from signal, to think about whether a price move is cyclical or structural, and to evaluate industrial policy, energy strategy, and long-horizon portfolio construction with greater coherence.
That shift in the questions you ask is where the real value sits. The supercycle framework is most powerful not as a forecast but as a decision-support tool: it does not tell you what to conclude about commodity markets, but it materially improves the quality of the conclusions you reach under uncertainty.
For readers wanting to move from the supercycle framework to specific portfolio positioning, our deep-dive into the capex super cycle examines Goldman Sachs’s HALO framework and the sectors showing the strongest structural earnings leverage across AI infrastructure, energy transition, reshoring, and defence spending.
This article is for informational purposes only and should not be considered financial advice. Investors should conduct their own research and consult with financial professionals before making investment decisions. Forward-looking statements regarding a potential new commodity supercycle reflect analyst consensus as of mid-2026 and are subject to change based on market developments and evolving data.