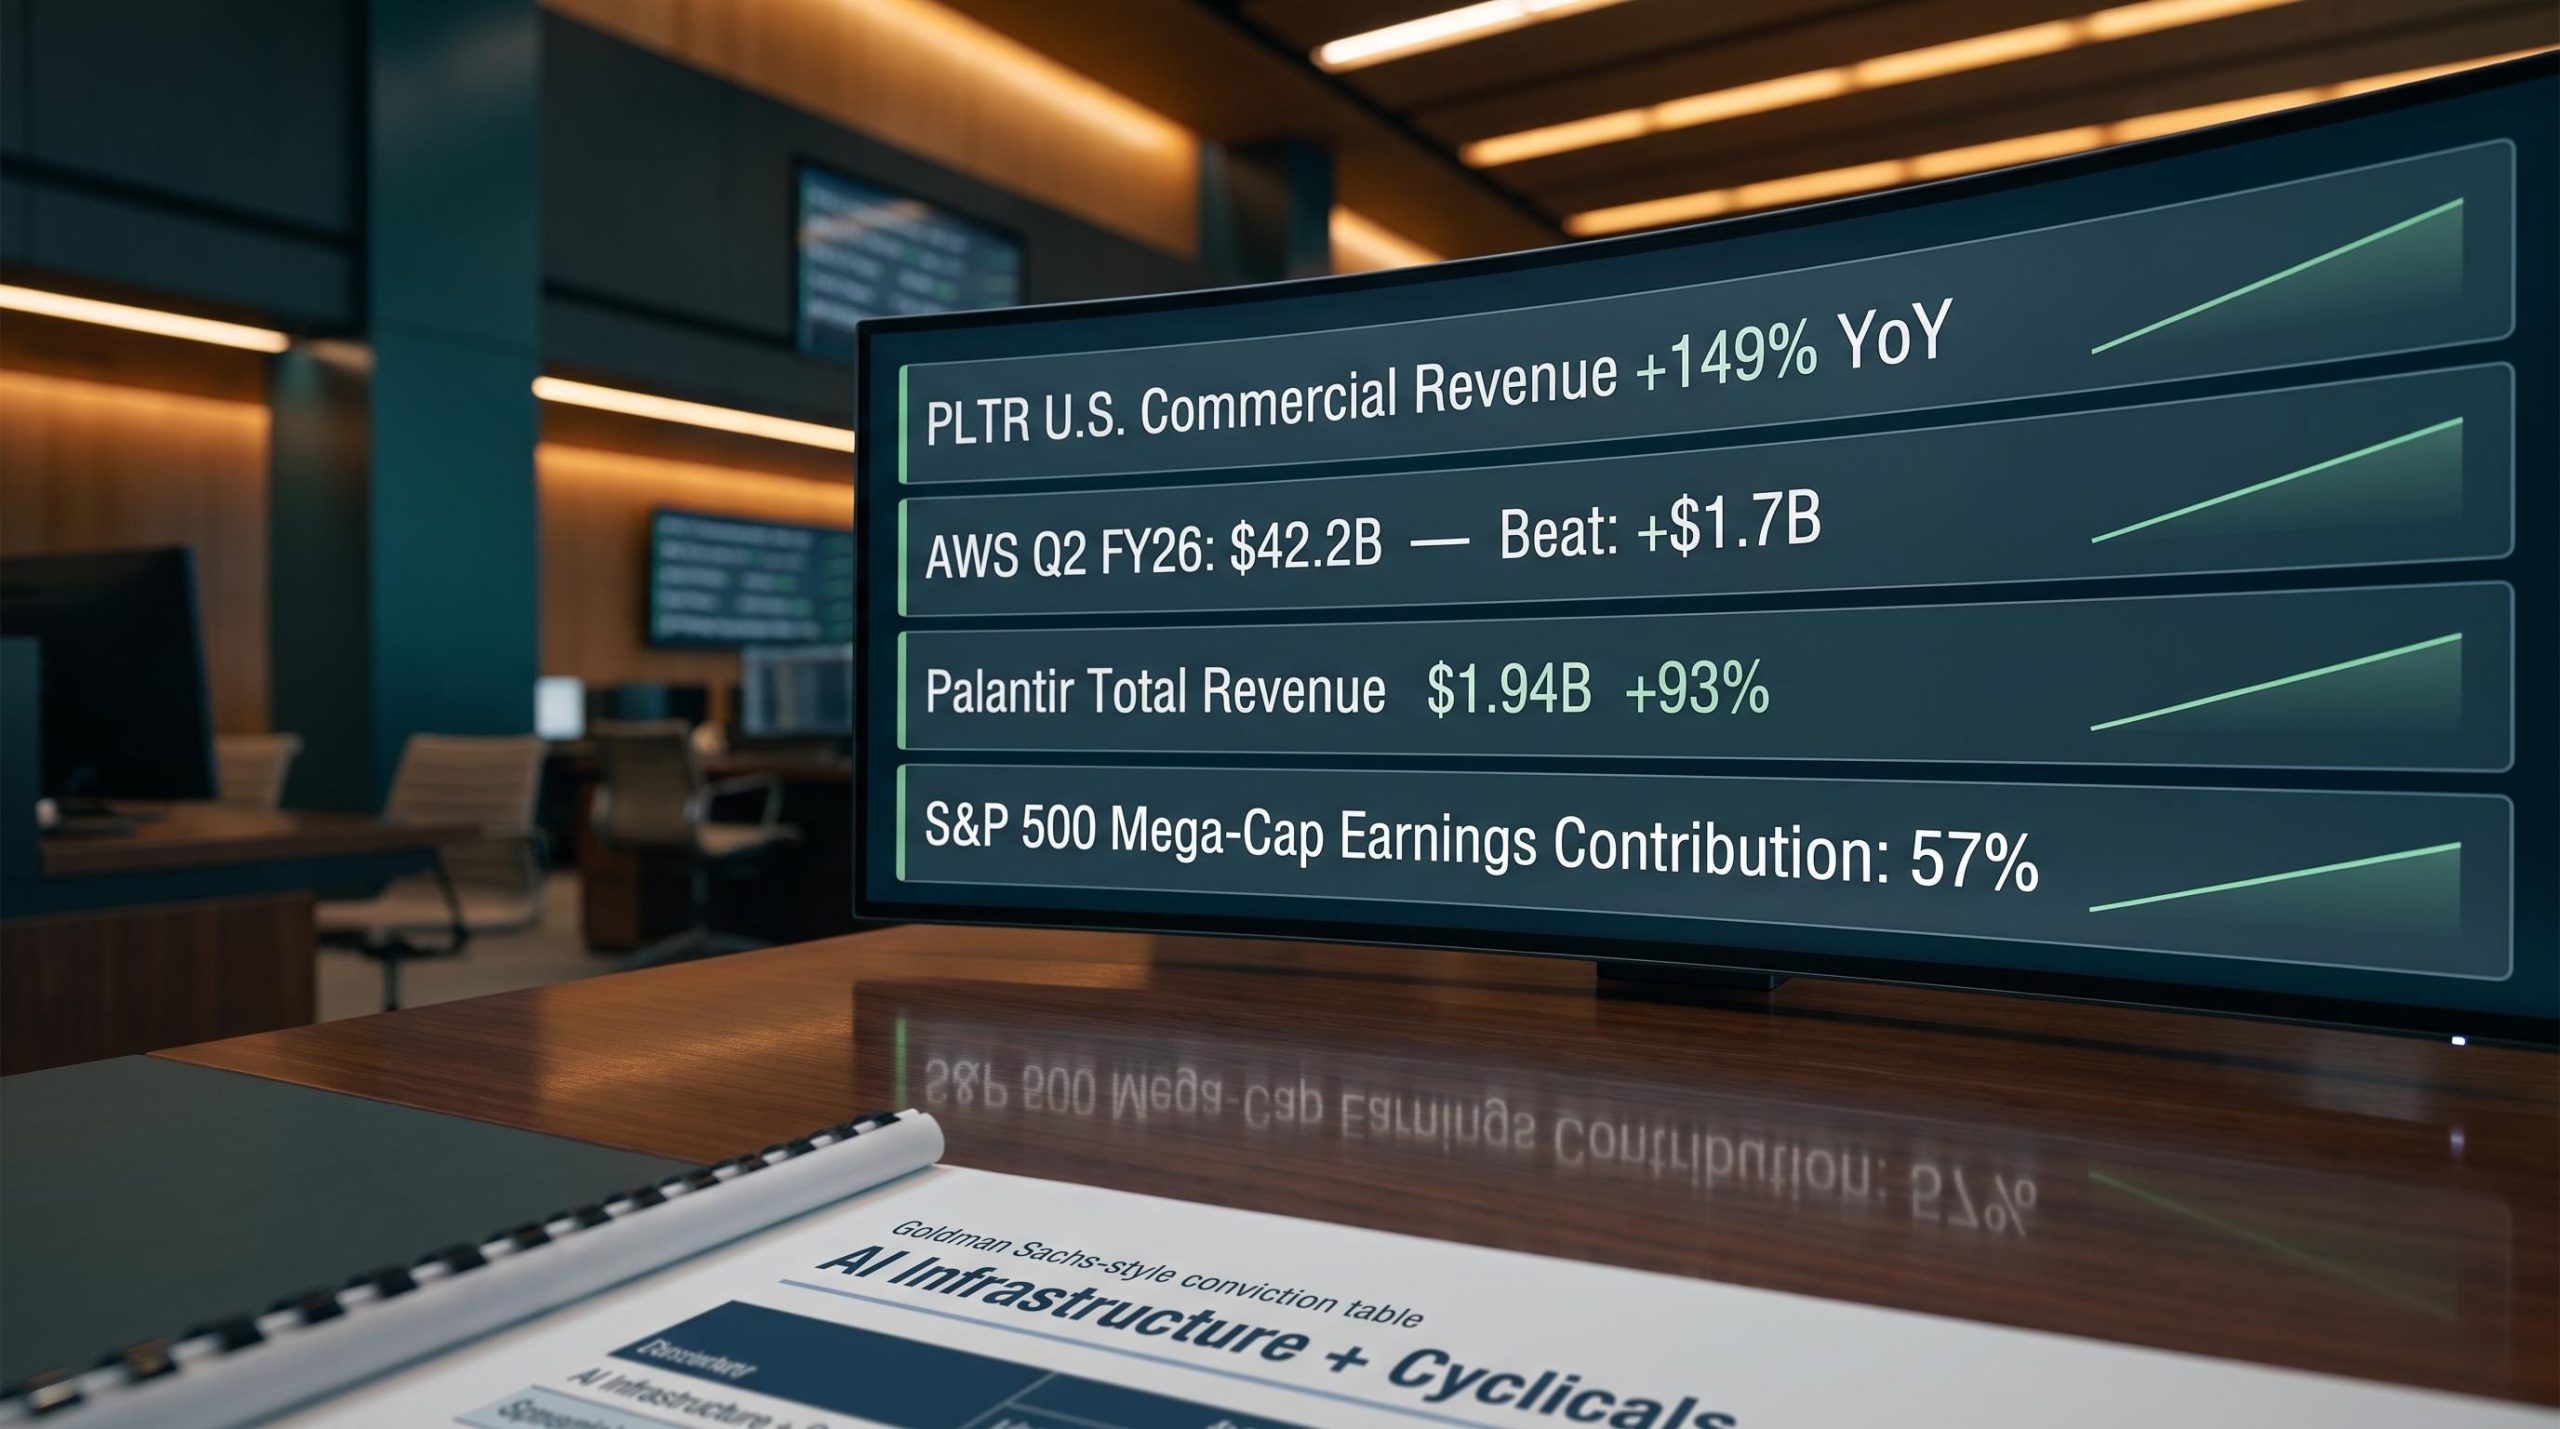
Two earnings reports filed after market close on 3 August 2026 have done something that weeks of analyst notes could not: they have put hard numbers on what AI monetisation actually looks like when it reaches enterprise scale.
Palantir’s U.S. commercial revenue grew 149% year-on-year in Q2 FY26. Amazon’s cloud division beat consensus by roughly $1.7 billion and pushed the company’s market capitalisation past $3 trillion. At the same time, Deutsche Bank figures indicate that mega-cap tech’s portion of S&P 500 earnings growth has dropped from around 90% to 57%, with every one of the eleven sectors now on course to post positive growth. Goldman Sachs responded by reshaping its Conviction List to pair AI infrastructure with cyclicals, transport, and logistics. These are not isolated data points. They form a pattern.
This piece traces that pattern from the company-level results through to what it means for how you should be thinking about index concentration, sector rotation, and where the next leg of earnings growth is likely to come from.
Palantir’s 93% revenue surge is the clearest proof yet that AI has crossed from pilot to platform
Palantir reported Q2 FY26 results that beat expectations across every metric that matters. The headline numbers speak for themselves:
- Total revenue: $1.94 billion, up 93% year-on-year
- U.S. commercial revenue: $764 million, up 149% year-on-year
- Earnings per share: $0.41, exceeding analyst estimates by approximately 24%
- Full-year FY26 guidance raised to $8.15 billion (from $7.65 billion prior)
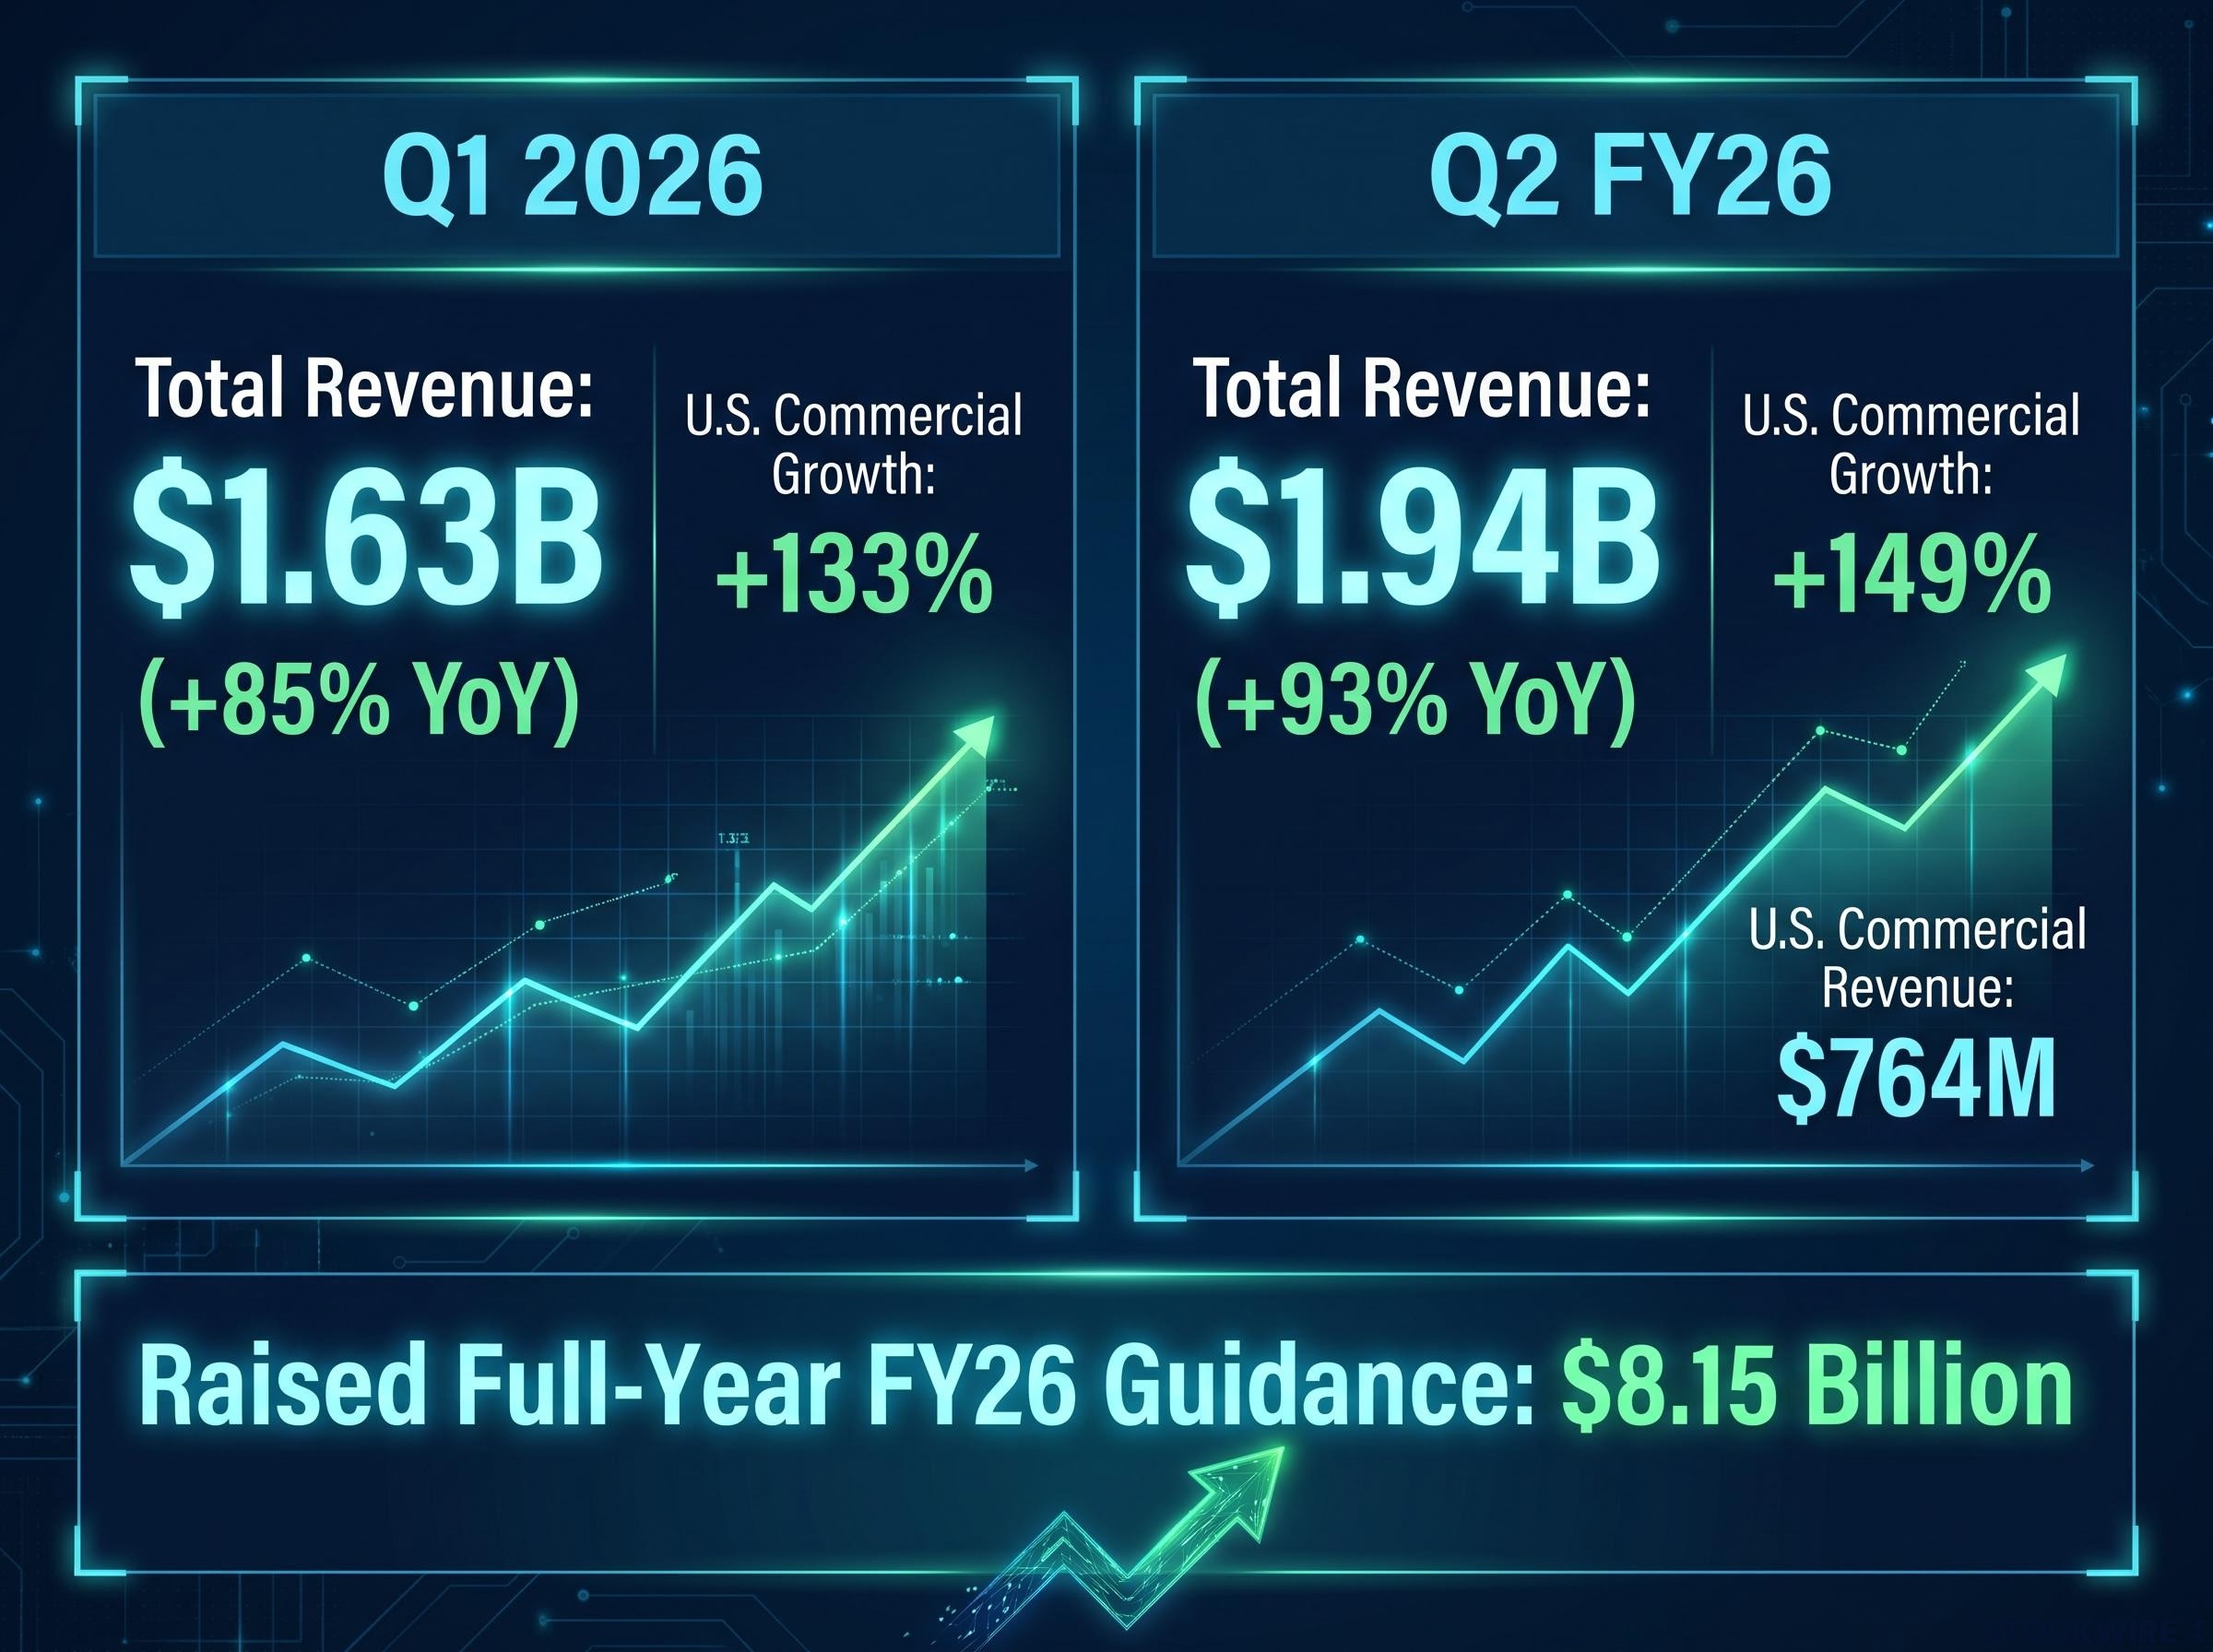
Shares gained approximately 12% in after-hours trading following the report. For context, Q1 2026 revenue grew 85% year-on-year to $1.63 billion, with U.S. commercial revenue up 133%. The acceleration is the signal.
Interpreting earnings reports with precision matters here because the 149% U.S. commercial growth figure and the AWS beat are both gap-versus-expectations signals, not absolute results, and the practical framework for separating genuine earnings acceleration from pre-baked expectations determines whether these numbers support a new position or merely validate one already held.
Full-year guidance: $8.15 billion. That implies management sees demand strengthening, not plateauing, as the year progresses.
What the U.S. commercial acceleration actually signals
The composition of growth matters more than the headline figure. U.S. commercial revenue at 149% is growing faster than government revenue, and the gap widened from the prior quarter. That tells you enterprises are not just trialling Palantir’s AI tools; they are deploying them at budget-level scale, which is the transition that turns a high-growth story into a durable earnings compounder.
The repeated pattern of guidance raises across multiple quarters reinforces the point. This is not a single-quarter spike. Management is signalling a sustained demand environment, and the customer mix is shifting from government-dominant to commercial-dominant. That shift changes the investment thesis: Palantir increasingly looks like a broad enterprise AI platform, not a niche defence contractor.
When big ASX news breaks, our subscribers know first
Amazon at $3 trillion: why the AWS beat matters more than the market cap milestone
Amazon joined a group of just four other companies that had previously surpassed the $3 trillion market capitalisation mark, with its shares reaching a record closing price on 4 August 2026. That is a headline worth noting. It is not the investment signal.
The investment signal is this:
- AWS Q2 FY26 revenue: $42.2 billion
- Analyst estimate: approximately $40.54 billion
- Beat: roughly $1.7 billion above consensus
AWS beat magnitude: $42.2 billion reported versus $40.54 billion estimated, a gap that resolves the single biggest risk concern investors had priced into hyperscaler stocks.
When the cloud division of the world’s largest e-commerce company beats by $1.7 billion, it tells you that enterprise demand for AI workloads and compute capacity is not slowing. It is exceeding even upwardly revised expectations. The market is increasingly valuing Amazon as a cloud and AI infrastructure leader that also operates e-commerce, rather than the other way around.
One quarter’s data does not close the debate over whether hyperscaler AI capital expenditure is outrunning real demand. But it meaningfully shifts the burden of proof onto the sceptics.
Understanding earnings concentration: why the shift from 90% to 57% changes the index investing conversation
Before looking at the numbers, it is worth understanding what earnings concentration means at the portfolio level. Earnings concentration refers to the share of an index’s total earnings growth that comes from a small group of companies. When a handful of mega-cap tech names are responsible for the vast majority of index-level earnings growth, every investor holding a passive S&P 500 fund is effectively running a concentrated portfolio, even if the fund technically holds 500 stocks.
S&P 500 concentration risk reached a point earlier in 2026 where just 20 stocks were responsible for the majority of earnings outperformance, with roughly half of that improvement attributed to non-recurring items, which is the baseline condition the current broadening is now moving away from.
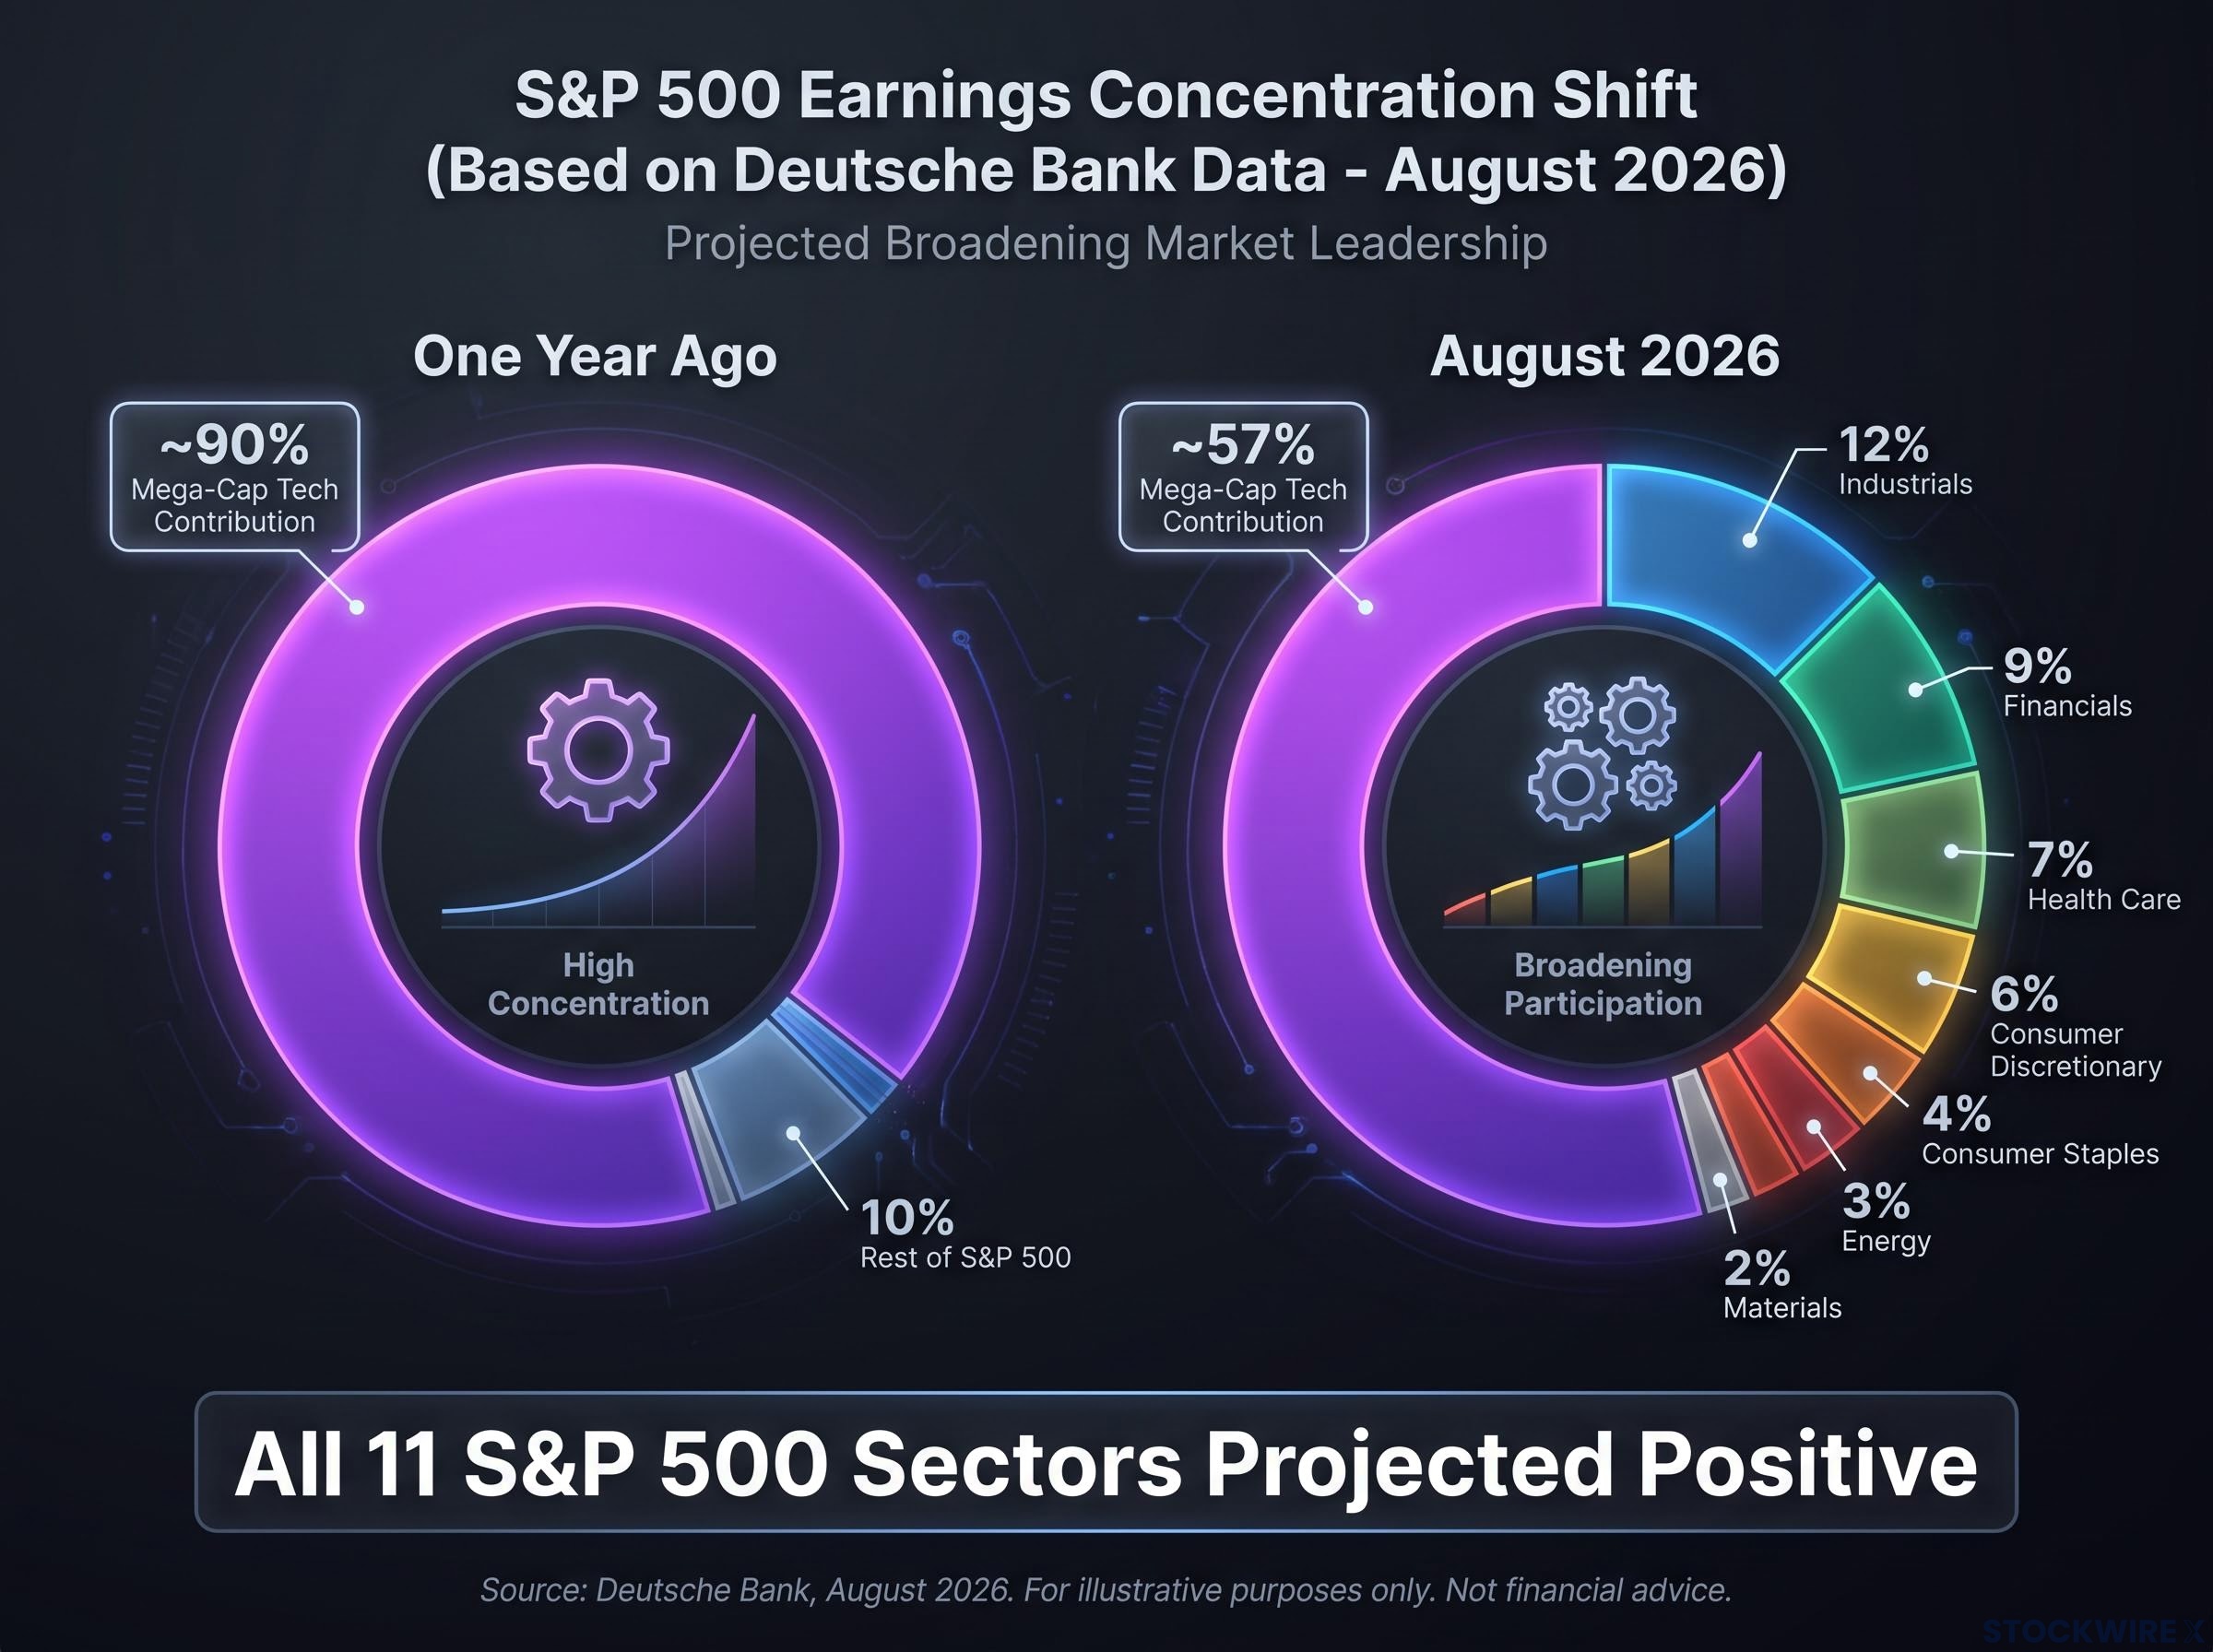
That is why the Deutsche Bank finding, published around 3-4 August 2026, matters.
| Time Period | Mega-Cap Tech Contribution to S&P 500 Earnings Growth | What It Means for Passive Investors |
|---|---|---|
| Approximately one year ago | ~90% | Broad index exposure was effectively a concentrated bet on a handful of mega-caps |
| Current earnings season (August 2026) | ~57% | Diversification is doing more real work, but the portfolio is still more than half-dependent on tech for earnings growth |
Alongside that shift, all eleven S&P 500 sectors are now projected to deliver positive earnings growth in the current season. In prior seasons, several sectors dragged on index-level performance. The contrast matters:
- All eleven S&P 500 sectors are projected to contribute positively, compared to prior periods where earnings growth was driven almost entirely by technology
- Healthcare, industrials, energy, and consumer sectors are all participating in the growth cycle rather than riding index construction passively
What 57% concentration still means for portfolio construction
The important nuance is that 57% is still a materially elevated concentration figure by historical standards. Big tech dominance is moderating, not disappearing. Concentration risk has declined, but it has not been eliminated.
What has changed is what diversification achieves. When all sectors are growing earnings, adding exposure beyond mega-cap tech is no longer purely a defensive move. It becomes a return-enhancing one. For you as an investor holding a passive S&P 500 fund, your diversification is now doing more real work than it was twelve months ago. But you are still running a portfolio where more than half the earnings growth comes from a handful of technology companies.
How institutional allocators are repositioning for a broader profit cycle
Goldman Sachs updated its U.S. Conviction List around 3-4 August 2026, and the pattern of additions and removals reads as a deliberate set of paired signals rather than a routine stock swap.
Goldman’s AI infrastructure thesis has evolved considerably since the bank characterised compute and power as scarce, contract-backed assets; its Conviction List update pairing Microsoft and Applied Materials with airlines and logistics reflects that same framework applied to a broader profit cycle rather than a pure semiconductor play.
| Action | Company | Category | Signal |
|---|---|---|---|
| Added | Microsoft | AI Infrastructure / Cloud | Continued conviction in the enterprise AI stack |
| Added | Applied Materials | Semiconductor Equipment | Upstream AI hardware demand remains strong |
| Added | Delta Air Lines | Airlines / Cyclical | Broader economic and travel cycle strength |
| Added | O’Reilly Automotive | Auto Parts Retail | Consumer-linked cyclical participating in profit expansion |
| Added | Viking Holdings | Travel / Cruise | Services economy benefiting from broader earnings growth |
| Added | UPS | Logistics | Transport and logistics re-entering the growth conversation |
| Removed | Broadcom | Semiconductors / AI-Adjacent | Valuation and risk-reward rebalancing, not sector abandonment |
| Removed | ServiceNow | Enterprise Software / AI-Adjacent | Better upside seen elsewhere at current prices |
| Removed | Johnson and Johnson | Healthcare / Defensive | Rotation from defensive positioning |
| Removed | Dick’s Sporting Goods | Specialty Retail | Rebalancing toward higher-conviction cyclical names |
The barbell logic: AI infrastructure conviction, paired with cyclical and services exposure. Goldman is not rotating out of tech. It is deliberately pairing it with sectors that benefit from a broader economic profit cycle.
The removals reinforce the signal. Broadcom and ServiceNow are both AI-adjacent, but their removal likely reflects valuation discipline, not a change in sector view. Goldman appears to be reallocating high-conviction slots toward names where the upside is better relative to current prices.
What this tells you is that sophisticated institutional allocators are positioning for a world where AI infrastructure and a broader economic profit cycle coexist. That barbell provides a practical framework for evaluating your own sector exposure.
Five portfolio-level questions this earnings season forces investors to answer
This earnings season has moved several debates from theoretical to data-evidenced. That requires revisiting assumptions rather than simply absorbing new information. The Palantir, Amazon, Deutsche Bank, and Goldman data collectively force five questions worth resolving.
- Is your AI exposure in the application layer or only in infrastructure? Palantir’s 149% U.S. commercial growth rate is now the benchmark for evaluating whether other AI software names are genuinely monetising enterprise adoption or still relying on pilot-phase revenues.
Enterprise software repricing is the structural context behind Palantir’s commercial acceleration: AI-native platforms entering enterprise markets at consumption-based pricing are designed to undercut incumbent SaaS costs by 80-90%, which is precisely the competitive dynamic that allows a platform like Palantir to grow 149% commercially while legacy analytical SaaS vendors face displacement.
- How much of your portfolio’s earnings growth is coming from a handful of names? The 57% concentration figure is your reference point. If your exposure mirrors the S&P 500, more than half your earnings growth still depends on mega-cap tech.
- Are you treating diversification as defensive or as return-enhancing? With all eleven S&P 500 sectors projected to deliver positive earnings growth, adding cyclical or services exposure is no longer just a hedge. It is backed by a broader profit base.
Watching for confirmation: what the next two earnings seasons will tell you
- Has your sector allocation shifted to reflect where institutional capital is moving? Goldman’s barbell framework (AI infrastructure alongside airlines, logistics, and auto parts retail) is a structural template, not a stock list. The question is whether your own allocation reflects the broadening earnings environment.
- Are you waiting for multi-quarter confirmation before making major allocation changes? One strong quarter does not confirm a structural trend. The specific indicators to monitor over the next two earnings seasons are: whether AI application-layer software companies beyond Palantir show similar U.S. commercial acceleration, whether AWS and other hyperscaler cloud divisions maintain above-consensus growth, and whether the “all sectors positive” projection translates into actual reported results.
This article is for informational purposes only and should not be considered financial advice. Investors should conduct their own research and consult with financial professionals before making investment decisions. These forward-looking assessments are speculative and subject to change based on market developments and company performance.
What this earnings season settles, and what it leaves open
The 3-4 August 2026 earnings data has substantively settled three things:
- AI application monetisation is real and at scale. Palantir’s Q2 FY26 results show enterprises paying for AI-powered software at budget-level commitment, not pilot-phase experimentation.
- Cloud demand is meeting hyperscaler capex. AWS beating consensus by $1.7 billion means the infrastructure spend is being met with real, sustained usage.
- Earnings breadth is genuinely improving. The decline from 90% to 57% mega-cap contribution, combined with all eleven sectors projected positive, confirms the profit cycle is widening.
What this earnings season cannot resolve:
- Whether triple-digit U.S. commercial growth rates are sustainable as Palantir’s revenue base scales into the billions
- Whether the broadening of earnings across all eleven sectors persists into subsequent quarters or proves to be a single-season phenomenon
- Whether current valuations fully price in the AI infrastructure opportunity, particularly for names where Goldman has maintained or added conviction
The institutional direction is clear: Goldman’s conviction list composition tells you where large allocators see the opportunity set expanding. The next earnings season is the confirmation test. Where the data has spoken clearly, you can position with confidence. Where it has not, the disciplined move is to watch, not to guess.
—