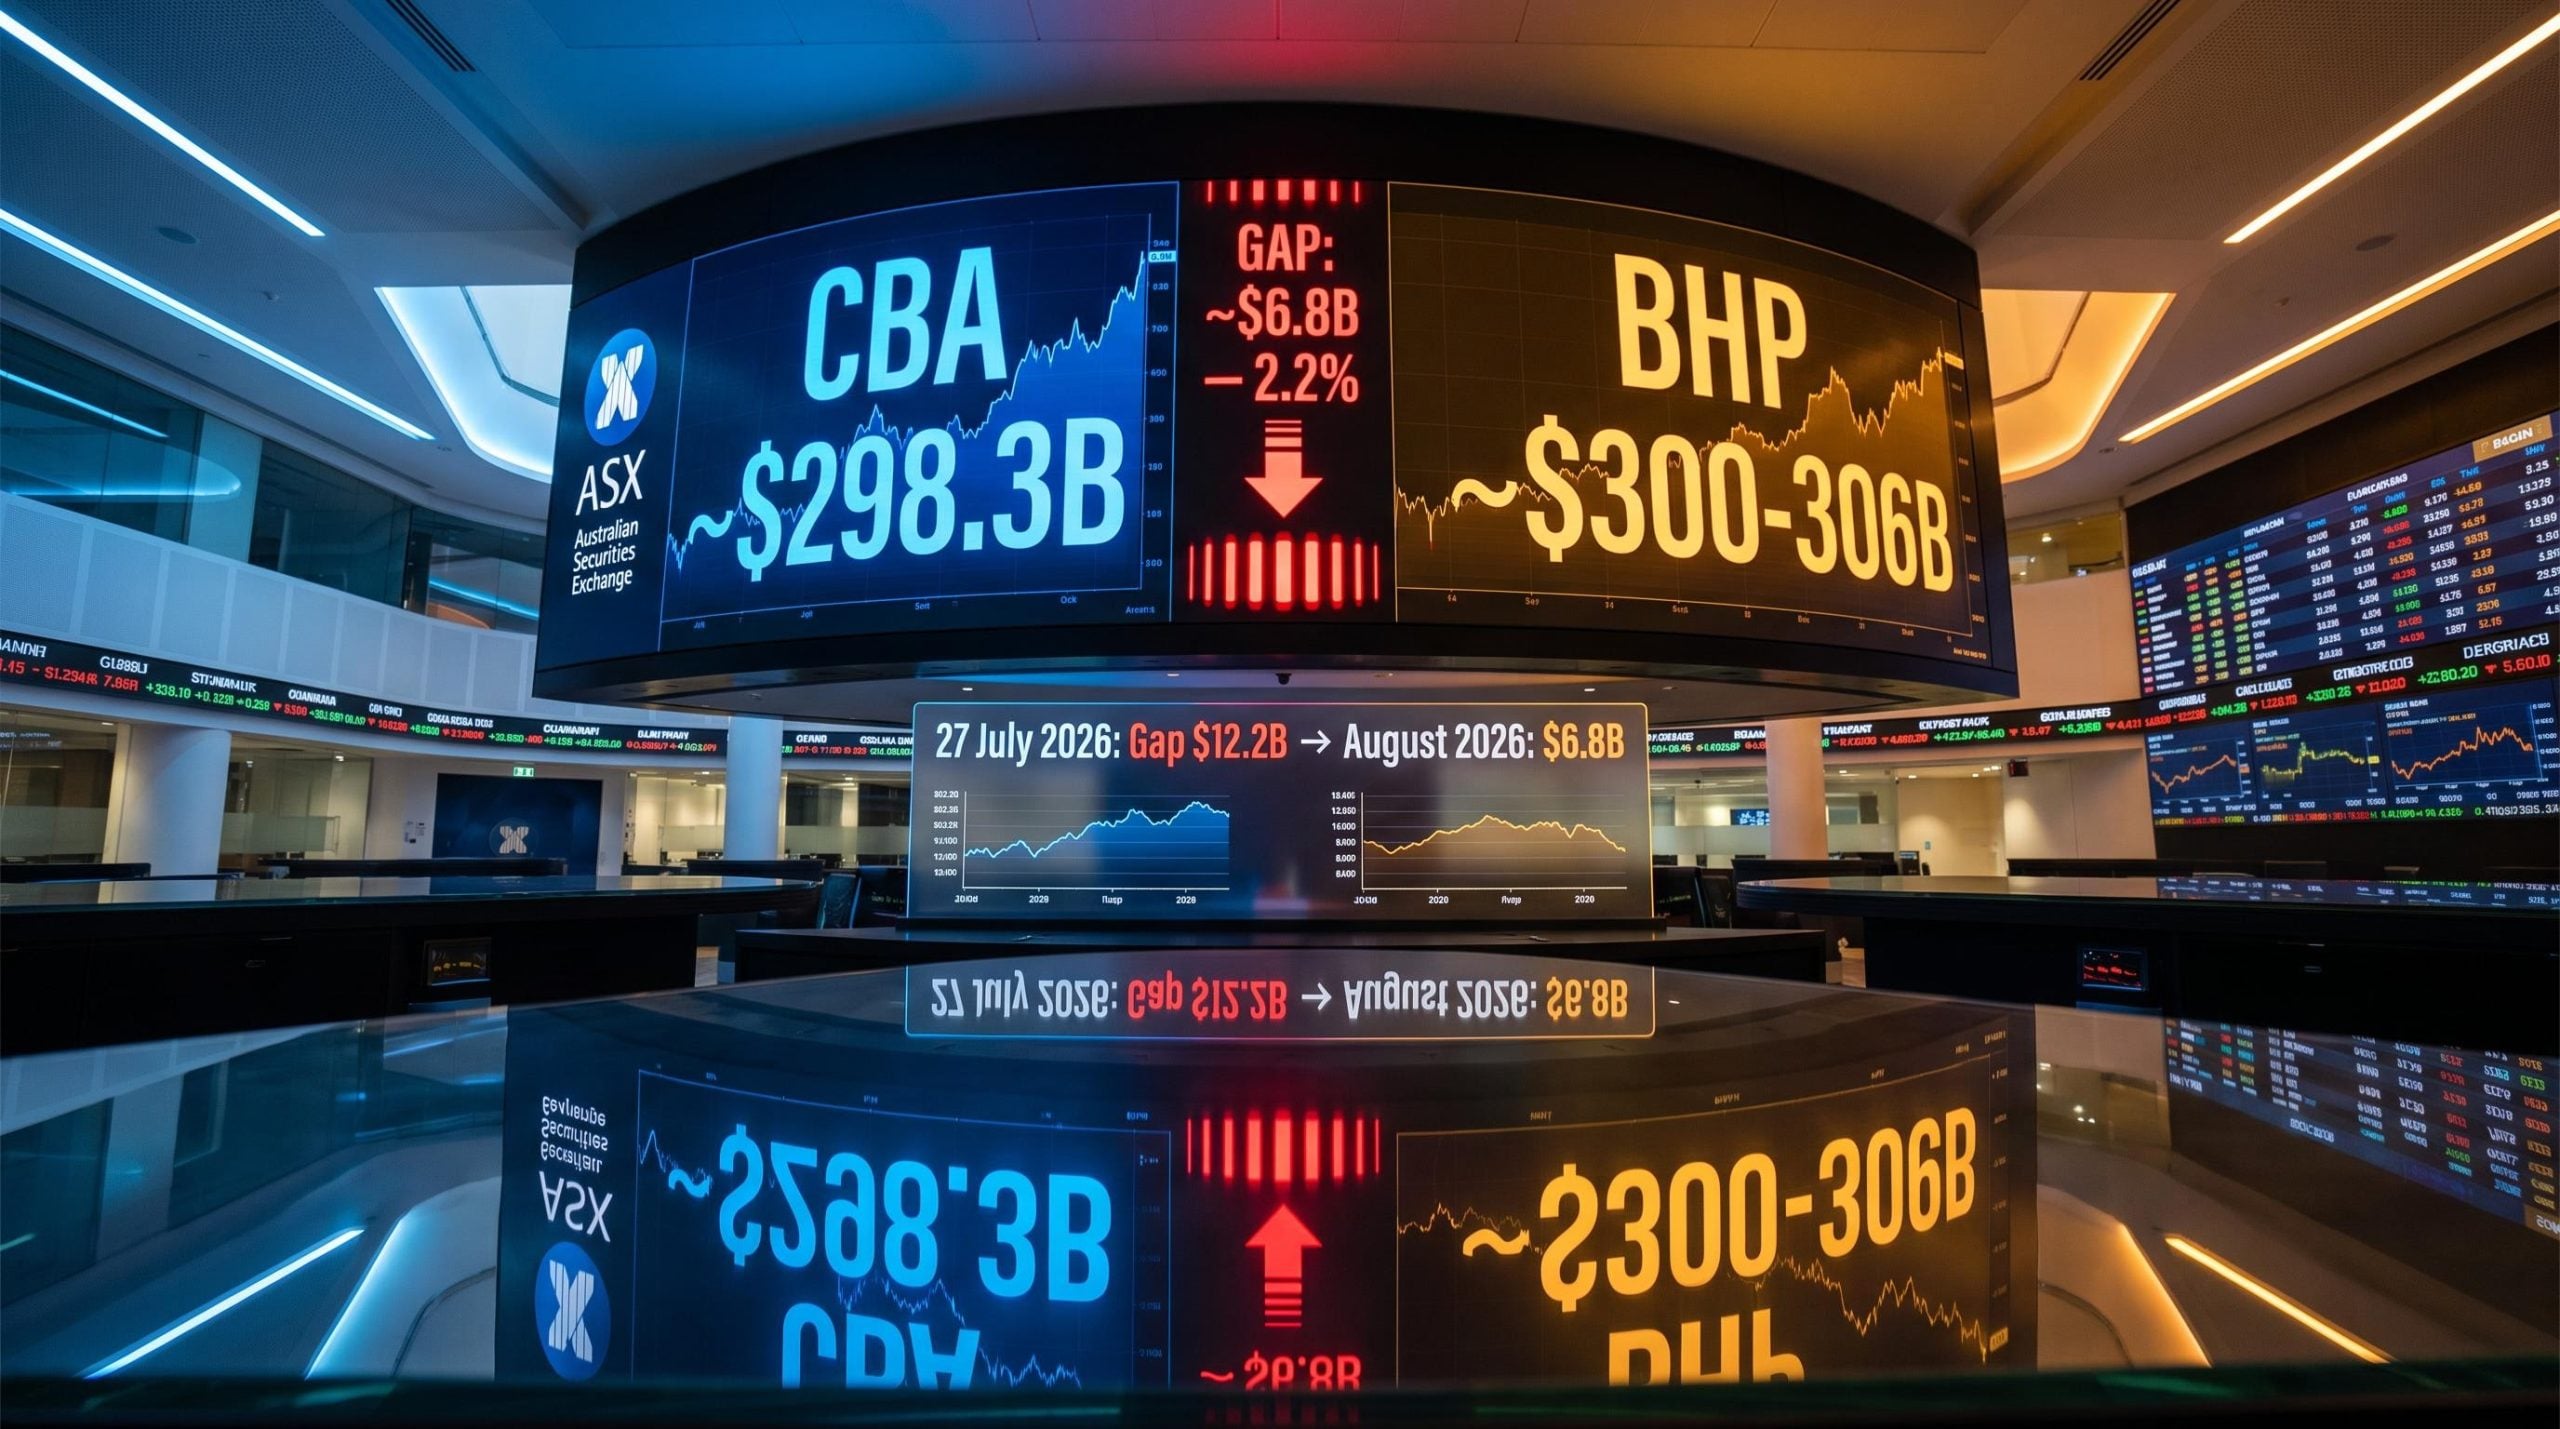
Commonwealth Bank of Australia closed last week with a market capitalisation of approximately $298.3 billion. BHP Group sat at roughly $300-306 billion. The gap between the two largest companies on the ASX has narrowed to approximately 2.2%, and in dollar terms, that is about $6.8 billion of daylight separating a rivalry that has defined the index for years.
That gap is compressing fast. As recently as 27 July 2026, the difference stood at $12.2 billion, or around 4%. CBA’s share price has climbed steadily through July and into August, eating into BHP’s lead at a pace that has turned a theoretical question into a live one.
Here is what the numbers actually show, what it would take for CBA to close the remaining distance, and what a leadership change at the top of the ASX means in practical terms for anyone holding an index-linked super fund or either stock directly.
How close CBA actually is to overtaking BHP right now
The numbers tell the story more clearly than any commentary.
| Metric | CBA | BHP |
|---|---|---|
| Market cap (August 2026) | ~$298.3B | ~$300-306B |
| Gap (AUD) | ~$6.8 billion | |
| Gap (% of BHP) | ~2.2% | |
| CBA share price (current) | ~$177-178 | — |
| CBA price to match BHP | ~$182-184 | — |
| Required move | ~$4-7 per share (2-4%) | — |
Key stat: The gap has narrowed from approximately $12.2 billion on 27 July to roughly $6.8 billion in early August 2026.
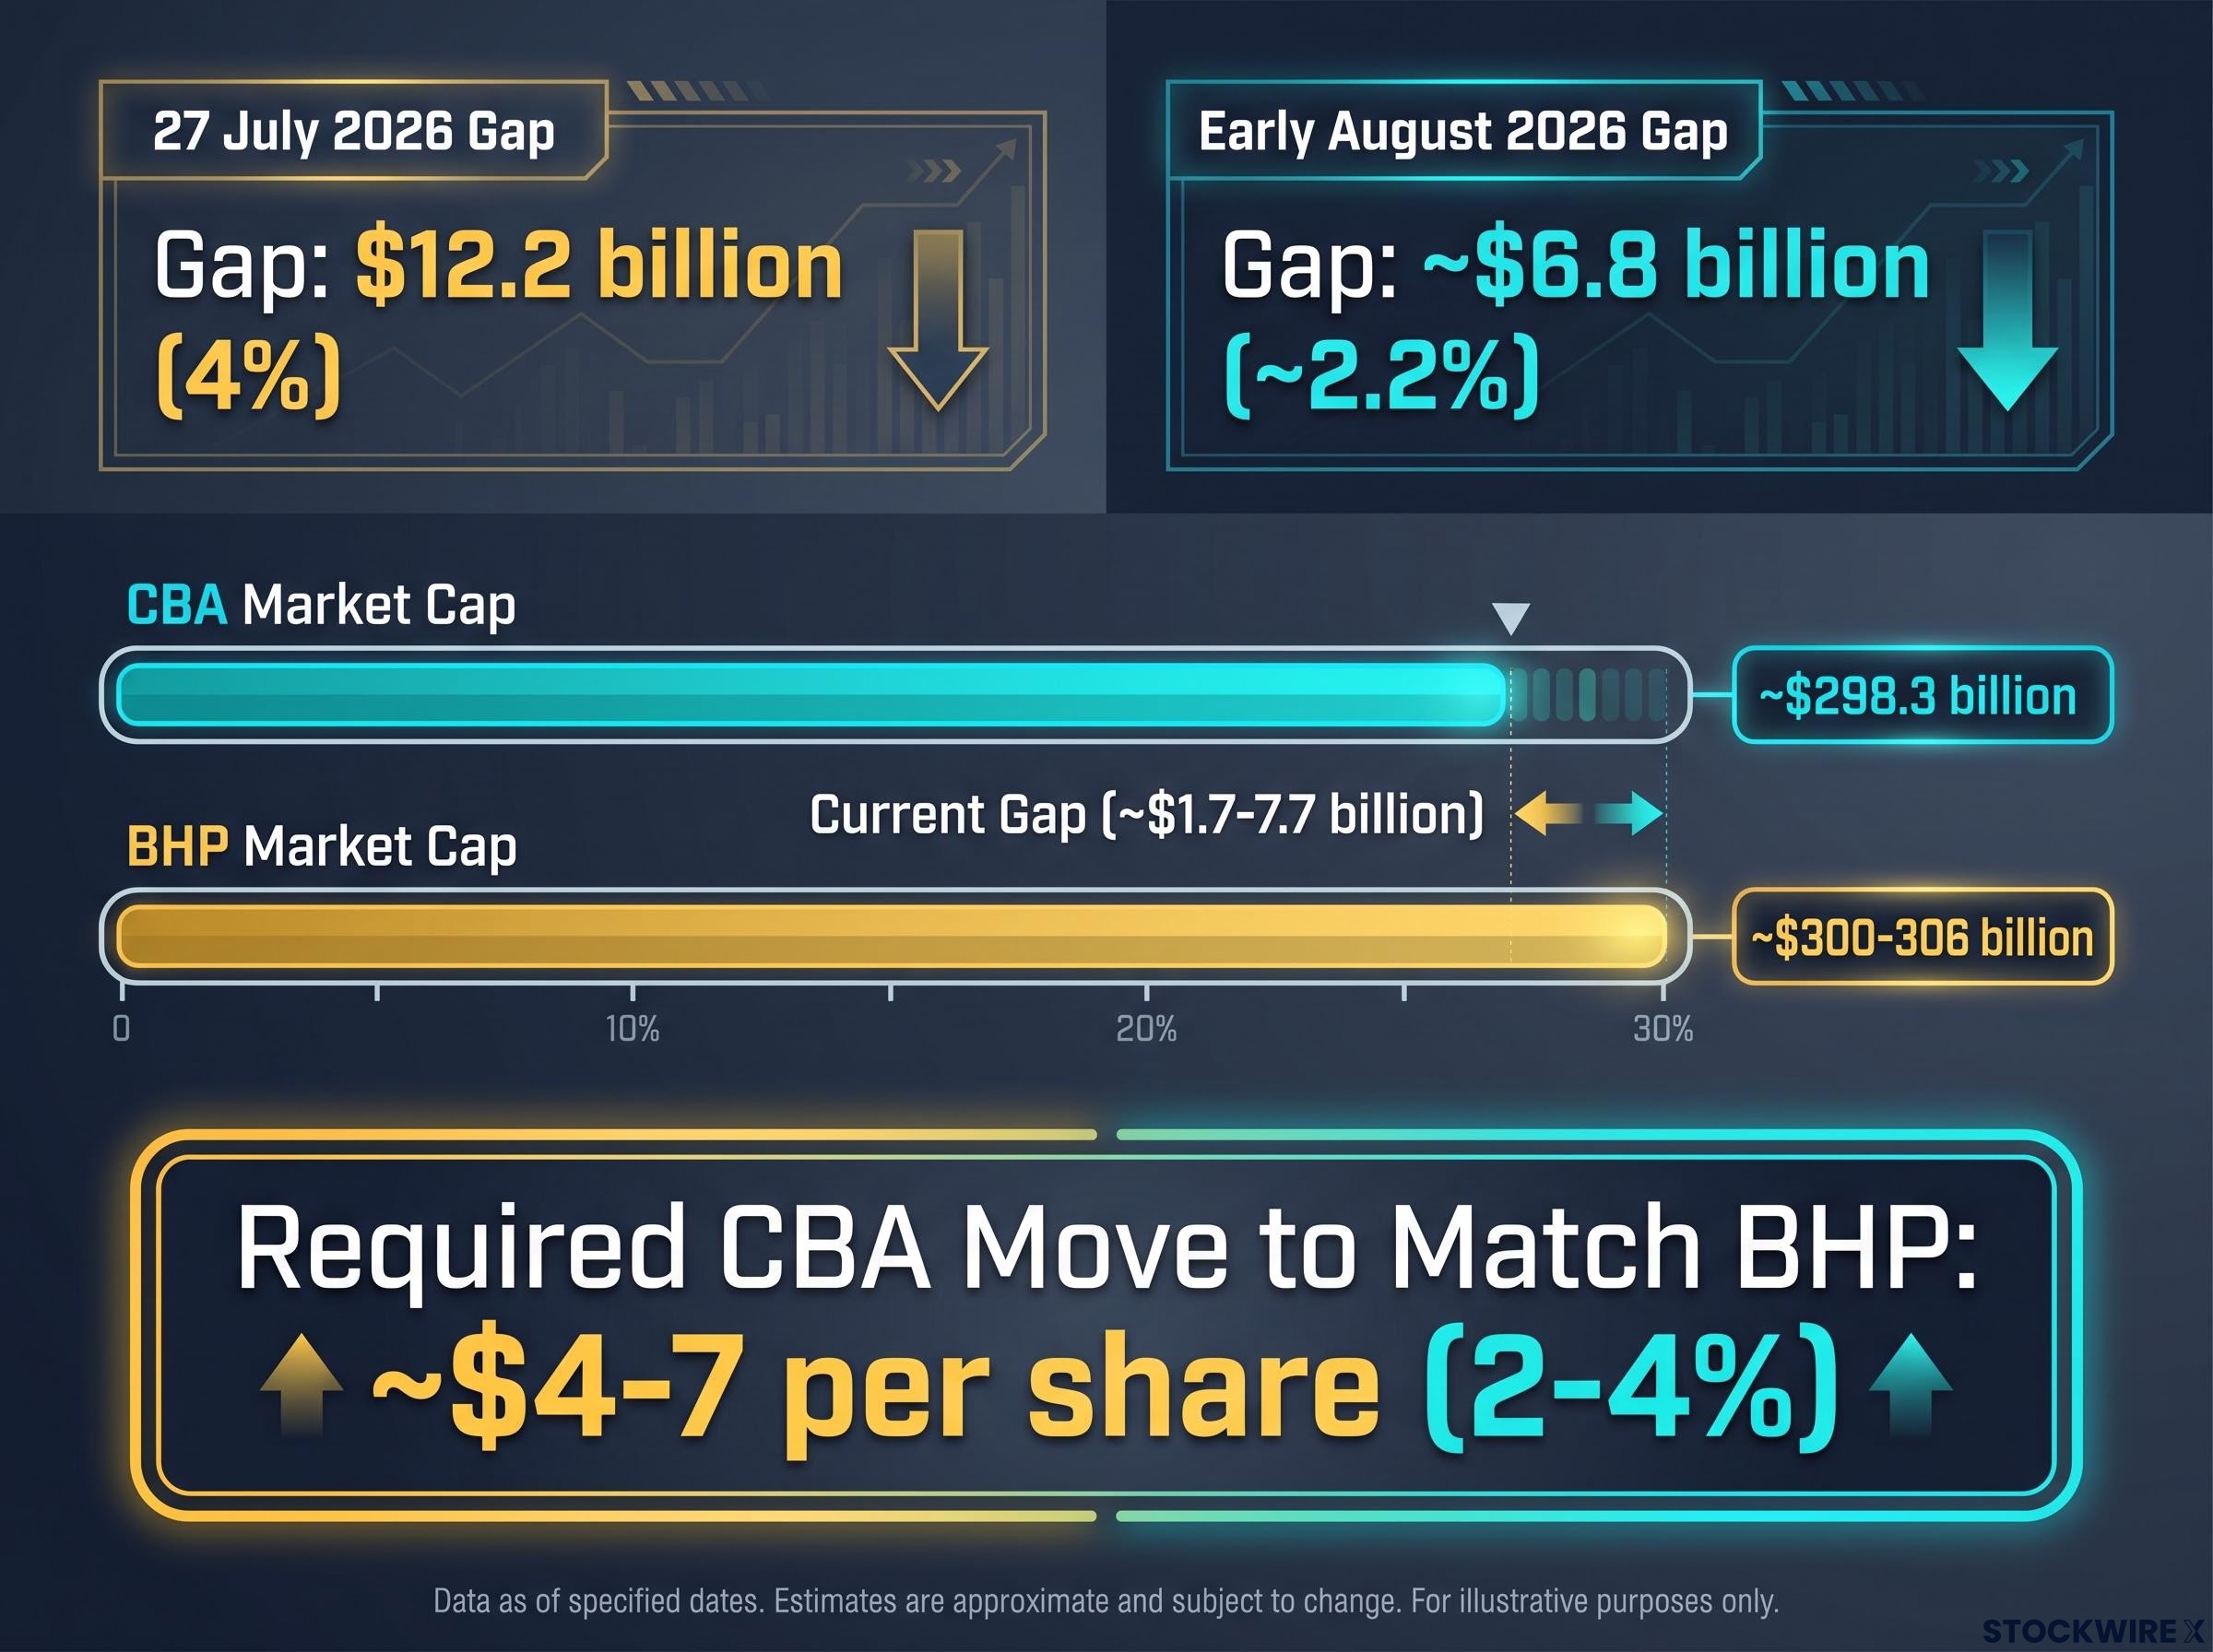
CBA needs to gain approximately $4-7 per share, or roughly 2-4%, to match BHP at prevailing levels, assuming BHP stays flat. For two companies each worth north of $298 billion, a 2.2% gap sits well within a single day’s normal price movement for either stock. The leaderboard at the top of the ASX could flip on any given trading session with a moderate catalyst. This is not a distant prospect. It is an imminent one.
When big ASX news breaks, our subscribers know first
This is not the first time CBA has chased BHP to the summit
If this feels like a once-in-a-generation moment, it is worth knowing it already happened. CBA held the title of Australia’s largest ASX-listed company as recently as July 2024. The crown has changed hands before, and the conditions that drive these swaps are cyclical, not structural.
The sector rotation from banks to miners that pushed BHP ahead of CBA in mid-May 2026 reversed in part as domestic rate sentiment shifted, illustrating exactly how the gap between the two companies contracts and expands with macro conditions rather than with any change in underlying business quality.
Market-cap leadership between the two has fluctuated depending on a combination of forces:
- Commodity price cycles: iron ore and copper strength lifts BHP; weakness narrows its lead
- Domestic interest rate sentiment: rate-hold or rate-cut expectations tend to support bank valuations, boosting CBA
- Bank earnings surprises: a strong CBA result can shift the gap materially in a single reporting season
- Relative sector rotation flows: when capital moves from resources into financials (or vice versa), the top of the index moves with it
The real story here is competitive parity, not a coronation. BHP has dominated over longer stretches, but CBA has surged past before and the data says it could do so again. Treating a future overtake as a permanent verdict would misread a rivalry that has already proven it runs both ways.
What a market cap lead actually means for index-tracking investors
The ASX 200 is a market-cap-weighted index. That means the largest company by market capitalisation holds the largest weight in the index and receives the largest allocation from any fund that passively tracks it. When the ranking at the top changes, the index changes with it, and so does every fund linked to it.
Here is how the sequence works:
- CBA’s market cap exceeds BHP’s at the index rebalancing reference date.
- The index provider updates constituent weights to reflect the new ranking.
- Passive funds tracking the ASX 200 buy more CBA and trim BHP proportionally to maintain alignment.
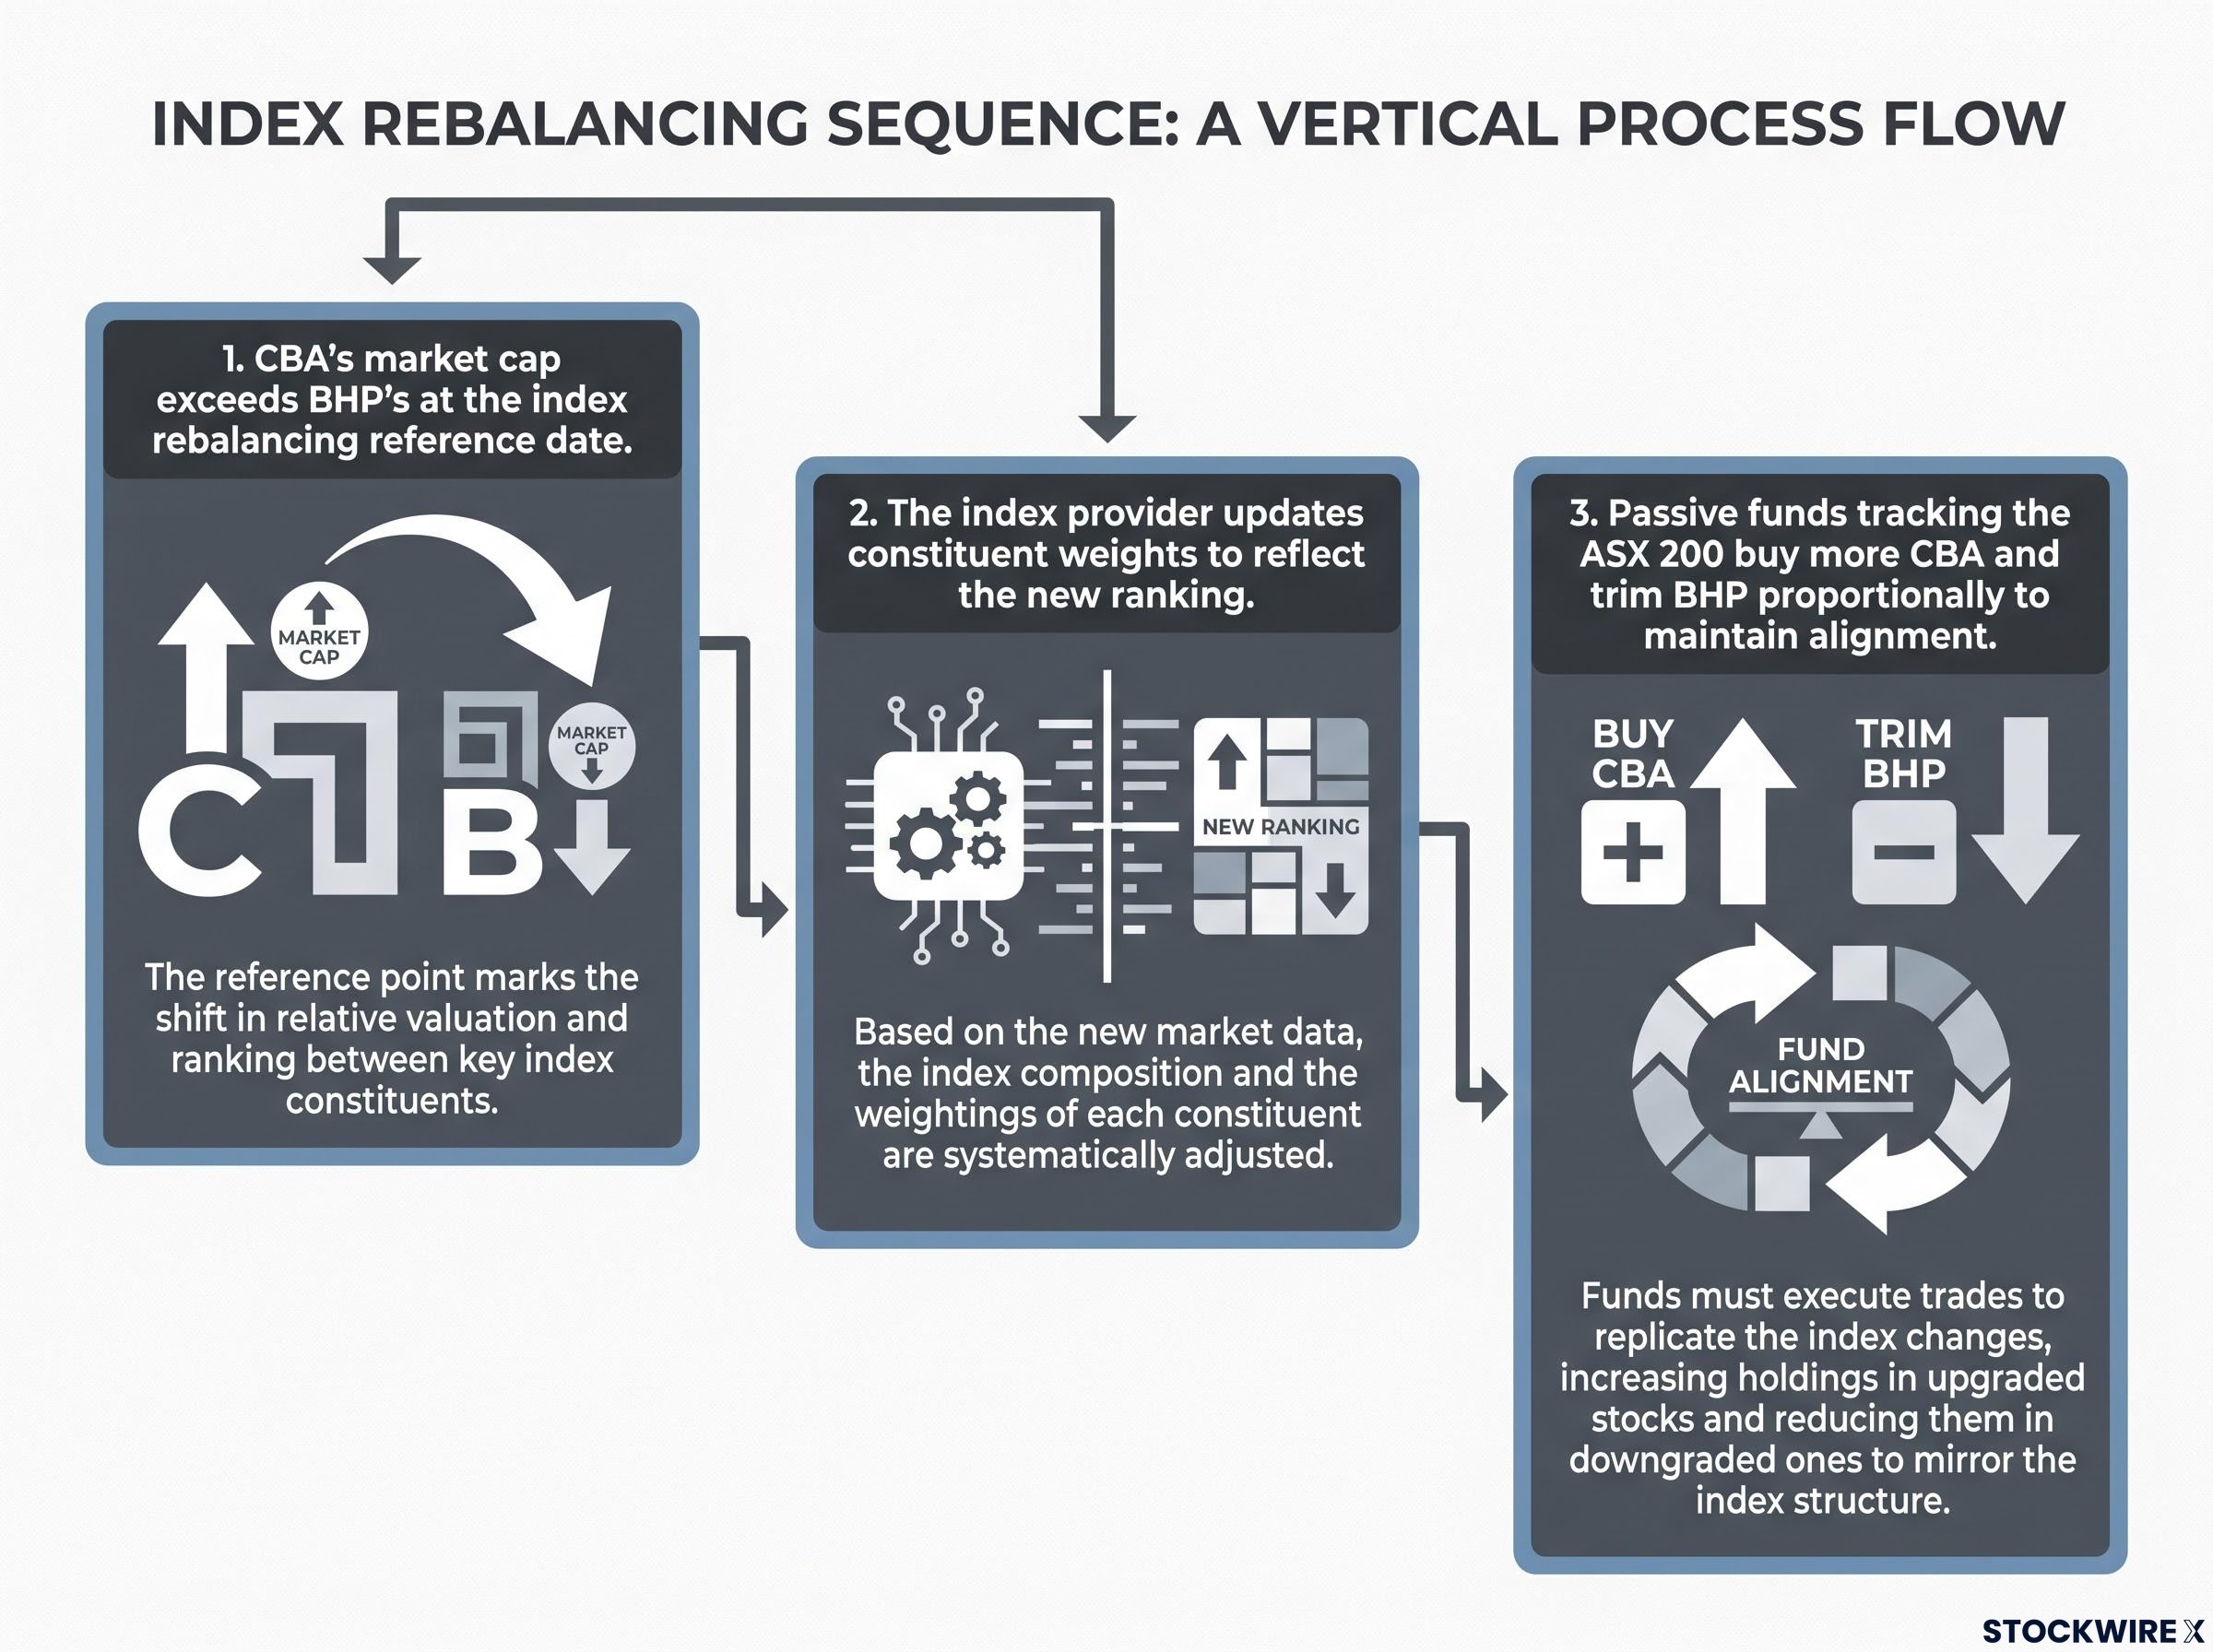
For most diversified Australian equity or superannuation investors, this is a change in relative proportion, not a change in whether either company is held. Both CBA and BHP are already present in broad index portfolios. A leadership swap shifts the weight, not the holdings.
Why superannuation amplifies the effect
Australia’s superannuation system has driven substantial growth in passive and quasi-passive investing over the past decade. That scale means ASX index rebalancing flows are proportionally large relative to daily turnover. A weight shift at the top of the index moves more capital in Australia than an equivalent shift would in most other developed markets, simply because the pool of passively managed super money is so large relative to the market it tracks.
For a reader with an indexed super fund, the practical meaning is straightforward: after the next rebalancing, your fund will quietly hold slightly more CBA and slightly less BHP. No action is required on your part, but understanding the mechanism means you can read your next fund report accurately when those weights shift.
Resources versus financials: what the rivalry signals about the ASX
BHP has long served as the market’s proxy for Australia’s resources-exporting economy: iron ore, copper, mining investment, and Chinese industrial demand. CBA represents the other side: domestic banking, housing credit, superannuation flows, and interest rate sensitivity. The contest between them is, in shorthand, a contest between two versions of what drives Australian prosperity.
Market capitalisation reflects current investor valuation at a point in time, not an objective verdict on which company or sector is more important to the economy.
That distinction matters. A sustained CBA lead would be a market-priced signal that investors currently value Australia’s domestic financial economy more highly than its commodity export capacity, a genuine shift in emphasis even if it says nothing permanent about which sector will lead next year.
ASX 200 concentration risk is amplified by the very rivalry this article tracks: financials and materials together account for more than 50% of the index by weight, so a shift in leadership between CBA and BHP does not merely reshuffle the top two names, it also shifts which macro regime dominates the returns experienced by every passive holder.
The macro sensitivities of each company reinforce the point:
- CBA: domestic interest rates, credit growth, housing market conditions
- BHP: global commodity prices, Chinese steel demand, mining investment cycles
If you hold a broad ASX portfolio, the company sitting at number one shapes which macro forces drive your index returns most heavily. A CBA-led ASX responds differently to a Reserve Bank rate decision than a BHP-led one does.
What the numbers mean if you hold either stock or an ASX fund
A larger market capitalisation is an expression of aggregate market valuation at a point in time. It is not an objective signal of company quality and it is not a buy or sell trigger.
CBA and BHP carry fundamentally different risk profiles. CBA moves on domestic interest rates, credit conditions, and housing. BHP moves on global commodity prices, Chinese demand, and mining cycles. A market-cap ranking tells you which set of risks investors are currently pricing more richly. It does not tell you which company will deliver better returns from here.
Four things worth keeping in your framework:
- The gap is small and can move either way in a single trading session
- Leadership has already changed hands before and will likely change again
- For index and super investors, the effect is a weight adjustment, not a holdings change
- Market cap is a valuation snapshot, not a quality ranking
This article is for informational purposes only and should not be considered financial advice. Investors should conduct their own research and consult with financial professionals before making investment decisions.
The gap that is left to close, and what watching it actually tells you
As of early August 2026, approximately 2.2% separates the two largest companies on the ASX, down from 4% just one week earlier. The trajectory is clearly compressing.
The more useful thing to watch is not the milestone itself, but the macro conditions driving relative performance. For CBA, that means the domestic rate outlook and housing credit trends. For BHP, it means Chinese steel production and iron ore demand. Those are the inputs that will determine whether the gap closes, holds, or widens again.
This rivalry is live, ongoing, and unlikely to produce a permanent winner. What it does produce is a real-time barometer of where Australian investors see value right now, and that reading is worth tracking whether you hold one, both, or neither stock directly.