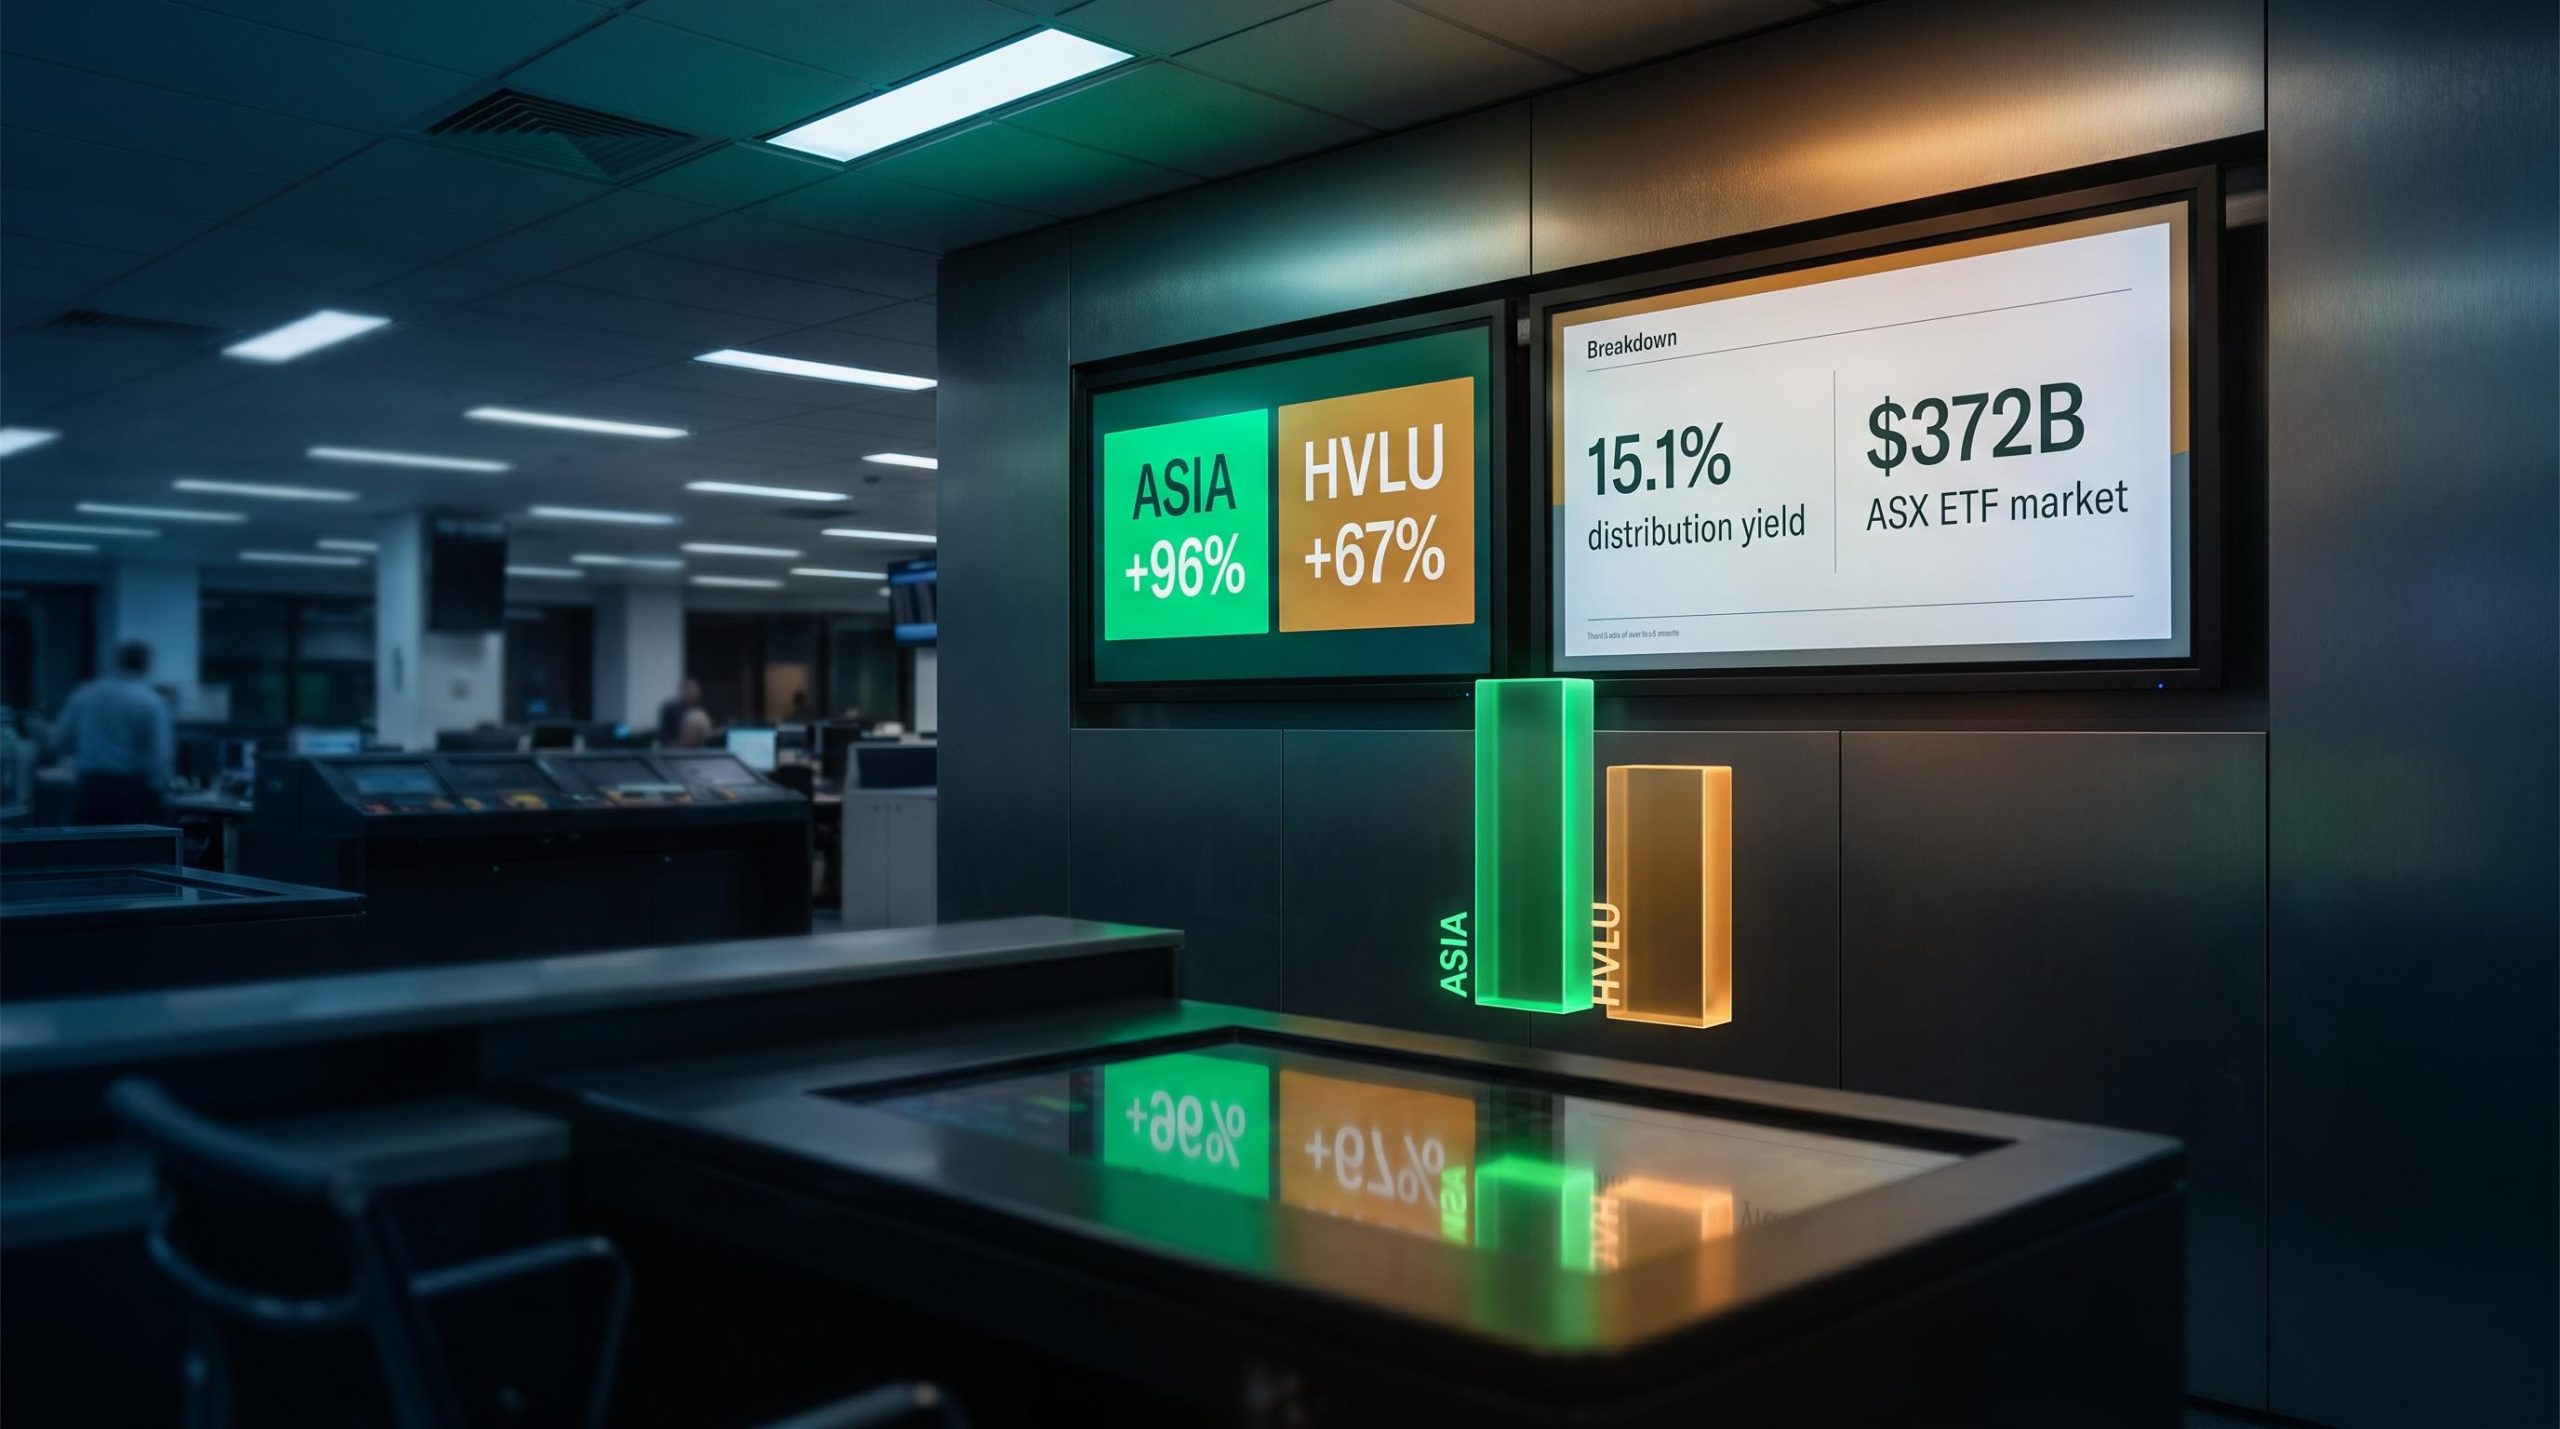
Two ASX-listed international equity ETFs just delivered 96% and 67% returns in a single financial year. Before you chase either of them, you need to understand exactly why those numbers happened.
The ASX’s FY26 full-year investment products report confirms that Betashares ASIA and VanEck HVLU sat at or near the top of the international equity performance tables. But the mechanisms behind those numbers are radically different from each other, and neither is simply “international equities did well.” The results were the product of a rare and specific alignment: an AI-driven semiconductor boom concentrated in Asia, a macro environment that rewarded value factor strategies, and an AUD depreciation cycle that turned currency hedging contracts into an unusually large income engine.
Here is the framework for assessing each of those mechanisms, so you can work out whether the underlying drivers are still present, whether these funds fit your portfolio, and what the headline numbers are actually telling you versus what they are not.
Why FY26 was a standout year for international equity ETFs on the ASX
The Australian ETF market ended FY26 at $372 billion in total assets, according to the ASX full-year investment products report. The growth was broad, but the performance was not.
FY26 was one of the most polarised years on record. The best-performing ETF gained approximately 188% while the worst fell more than 50%, a spread exceeding 240 percentage points. That kind of dispersion tells you that FY26 rewarded investors who made specific, concentrated calls, not those who simply held broad global indices.
Three structural themes drove the top cohort:
- AI and the semiconductor supply chain, which powered Asia-focused tech ETFs to the top of the table
- The value factor’s quiet comeback, with multiple value-tilted ETFs appearing in the top 20
- AUD depreciation, which turned hedging contracts on currency-hedged funds into a substantial income source
Understanding why these three forces converged matters more than the headline returns themselves. The environment that produced them may not persist, and investors who assume it will are making the most common post-rally mistake.
When big ASX news breaks, our subscribers know first
Inside ASIA’s 96% return: what the fund actually owns
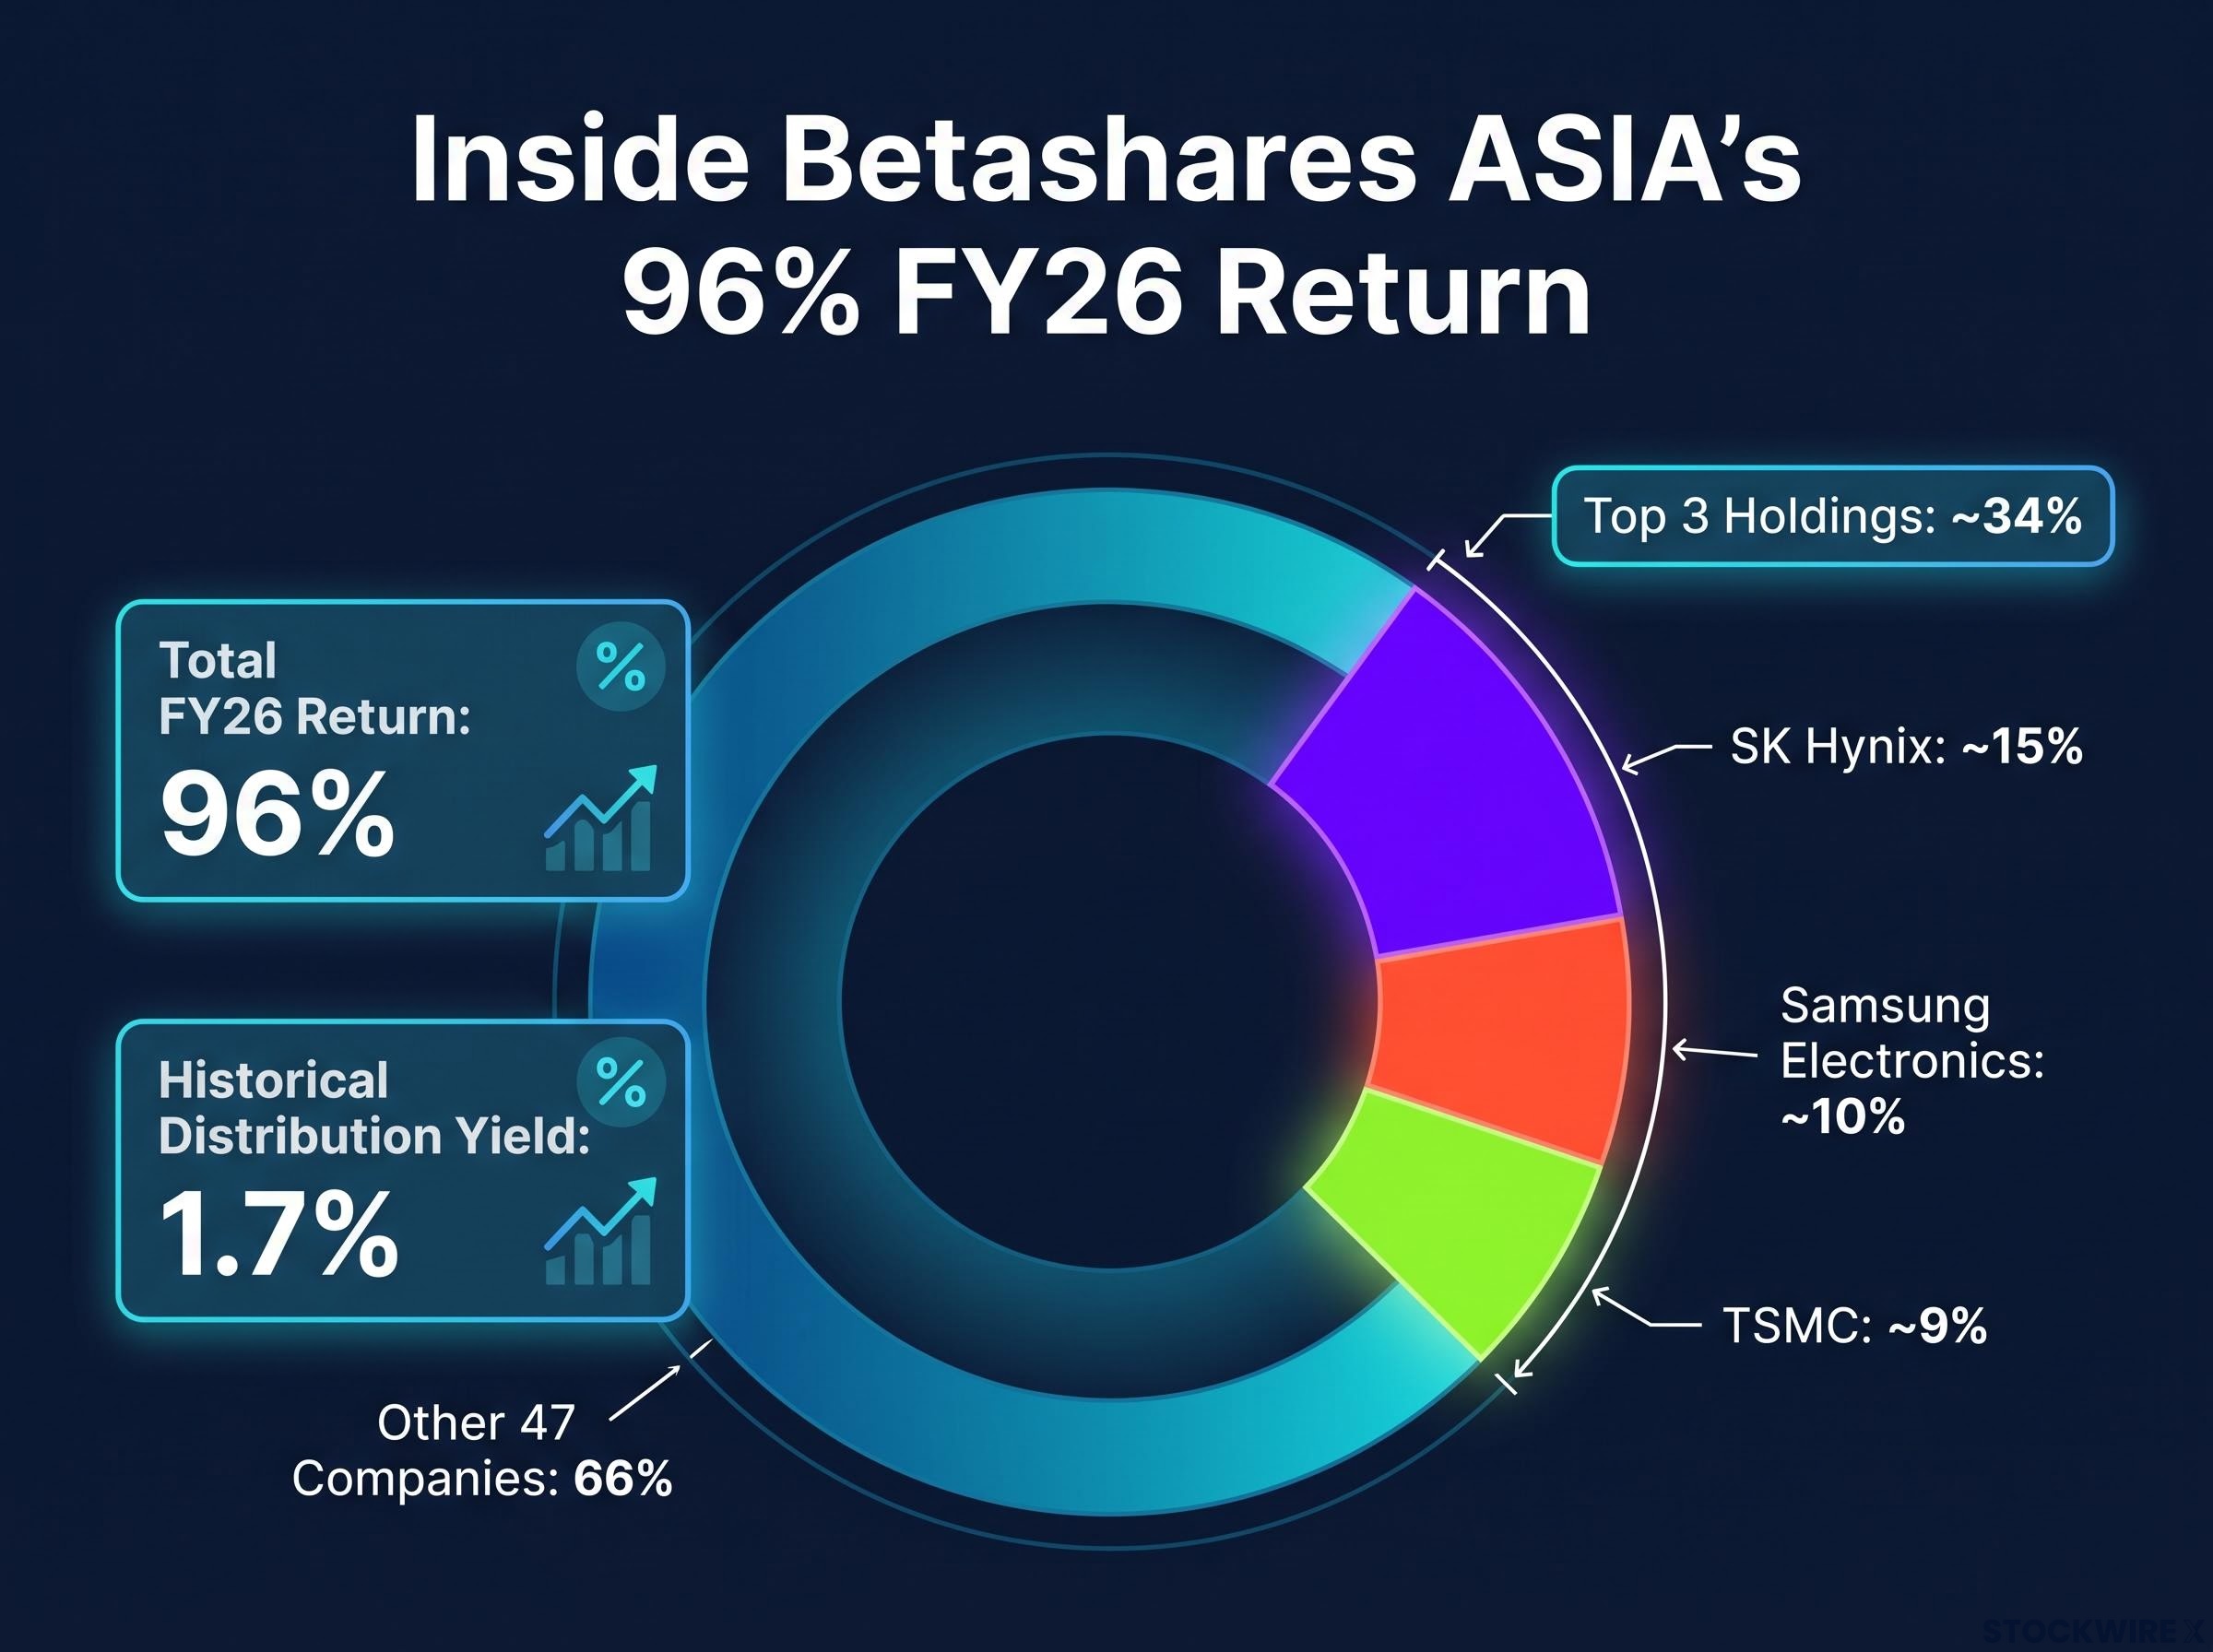
Betashares ASIA targets the 50 biggest technology and online retail businesses across the Asian region, with Japan excluded, and carries heavy exposure to South Korea, Taiwan, and China. Its FY26 total return of 96% was confirmed in the ASX investment products report.
That number becomes less surprising, and more instructive, once you see where the fund’s weight sits.
| Holding | Approximate weight | AI supply-chain role |
|---|---|---|
| SK Hynix | ~15% | Dominant supplier of high-bandwidth memory (HBM) for AI accelerator chips |
| Samsung Electronics | ~10% | Major HBM producer and semiconductor manufacturer |
| TSMC | ~9% | The foundry that manufactures the AI chips themselves |
Those three holdings represent roughly a third of the entire fund. All three are deeply embedded in the same AI hardware supply chain. ASIA is less a diversified “Asia tech” exposure and more a concentrated proxy for the global AI infrastructure buildout.
The semiconductor cycle that powered ASIA’s top three holdings in FY26 is not a static environment: TSMC’s locked-in 2026 capital budget of $52-56 billion and Samsung’s estimated $70-80 billion annual outlay point to a supply wave arriving in 2027-2029, with memory and HBM segments carrying the highest risk of oversupply-driven earnings compression.
Capital growth, not income, drove the result
ASIA’s historical distribution yield is just 1.7%. Virtually all of the 96% total return came from price appreciation, not dividends.
That pattern held across the top AI-themed ETFs in FY26. When a rally is driven by multiple expansion and earnings growth in a single supply chain, the payoff arrives as capital growth. Investors comparing ASIA against a broad global equity ETF need to recognise they are comparing fundamentally different risk profiles: one is a thematic sector bet, the other is broadly diversified.
The value factor’s quiet comeback and how HVLU captured it
Value investing, the systematic overweighting of stocks trading below their estimated intrinsic value, spent years underperforming growth strategies. FY26 changed that.
Value strategies select stocks using metrics like:
- Price-to-book ratio (market price relative to net asset value)
- Price-to-forward earnings (current price relative to expected future earnings)
- Enterprise value relative to operating cash flow (total company value compared to the cash the business generates)
The logic behind value’s FY26 resurgence is straightforward. Growth stocks derive a larger share of their value from cash flows far in the future, making them more sensitive to increases in the discount rate, the rate used to calculate what future earnings are worth today. Value stocks, with strong current earnings and cash flows, are less exposed to that effect. In a period of elevated inflation and higher interest rates, that distinction mattered enormously.
VanEck HVLU follows a benchmark index, the MSCI World ex Australia Enhanced Value Top 250 Select, that captures 250 large and mid-cap companies from developed international markets. Its top holdings include Micron Technology (approximately 4%), Verizon Communications (approximately 2%), and Kioxia Holdings (approximately 2%).
According to VanEck, value-oriented companies tend to demonstrate greater resilience during periods of elevated inflation and higher interest rates, and are perceived as lower-risk relative to growth-oriented stocks during volatile market conditions.
HVLU delivered a one-year total return of 67% for FY26. That is a strong result, but it is not evidence that value investing suddenly became alpha-generating in all conditions. It is evidence that the FY26 macro backdrop happened to be the specific environment where the value factor excels. If that backdrop shifts, the tailwind shifts with it.
How currency hedging turned a strong return into a 15% income yield
Here is the number that should stop you: HVLU’s FY26 distribution yield was 15.1%, with a distribution of $7.18 per unit. The underlying portfolio does not yield anywhere near that figure from dividends alone.
The explanation is mechanical, and once you understand it, you will read hedged ETF distribution data very differently.
What drives distributions on currency-hedged equity ETFs
An unhedged international equity ETF (like VLUE, HVLU’s counterpart) lets the AUD value of its foreign holdings float with exchange rate movements. If the AUD falls, overseas assets are worth more in AUD terms. If it rises, they are worth less.
A hedged ETF like HVLU uses forward currency contracts to neutralise that exposure. The fund locks in exchange rates. When the AUD depreciates against the currencies of the underlying assets, those contracts generate gains, because the fund has pre-agreed to buy foreign currency at a rate that is now cheaper than the weakened AUD would otherwise require.
The hedged vs unhedged ETF decision produced a 13-percentage-point performance gap between HNDQ and NDQ over the year to May 2026, a difference generated entirely by AUD/USD movements rather than any difference in underlying holdings or fund management.
Those gains are typically realised and distributed to investors as income, entirely separate from the dividends paid by the underlying portfolio companies.
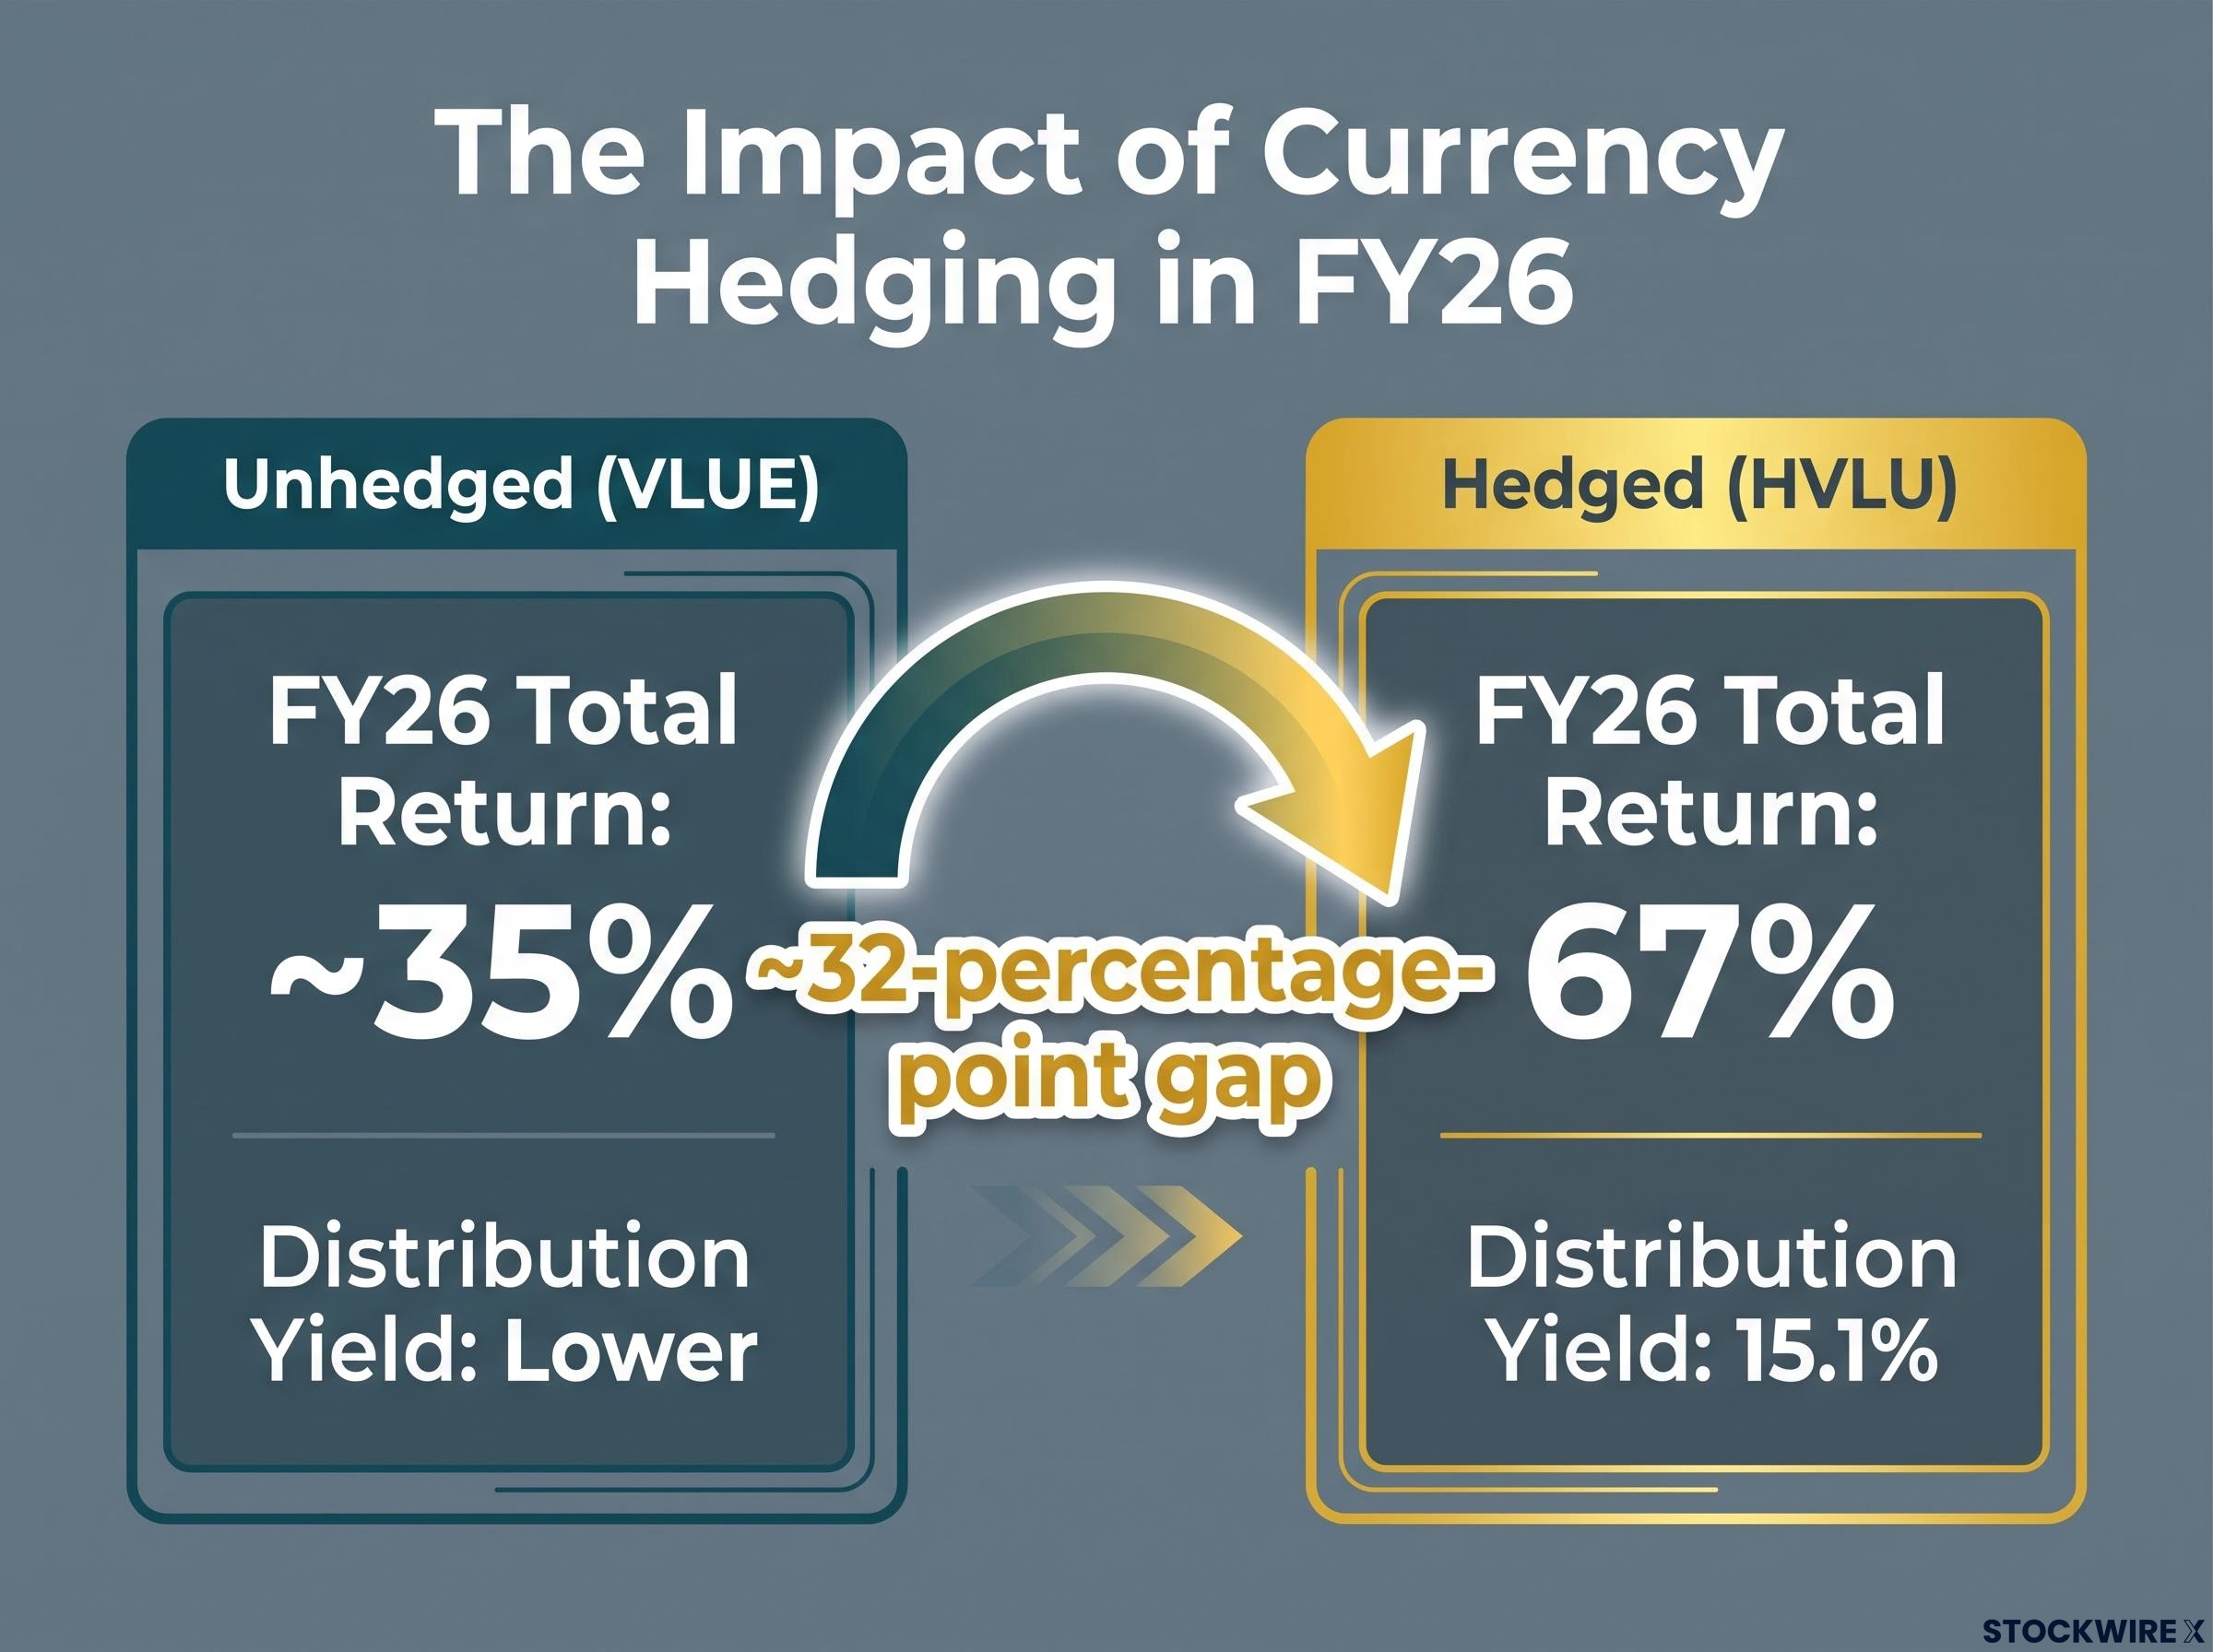
That mechanism is what produced HVLU’s 15.1% yield. It is a backward-looking artefact of a specific AUD depreciation cycle, not a signal that the fund permanently generates that level of income.
| Dimension | Unhedged (VLUE) | Hedged (HVLU) |
|---|---|---|
| FY26 total return | Approximately 35%* | 67% |
| Distribution yield | Lower | 15.1% |
| Source of return | Stock performance + FX movements | Stock performance + hedging P&L |
| Risk introduced | Currency exposure | Derivative/roll risk via hedging programme |
*VLUE return is approximate and not independently confirmed at time of publication.
The roughly 32-percentage-point gap between HVLU and VLUE isolates the hedging contribution. Hedged versions of NASDAQ 100 and Global 100 products also outperformed their unhedged equivalents in FY26, consistent with the AUD weakness thesis. For Australian income-focused investors, understanding the source of a distribution yield is not optional: a yield driven by hedging gains will behave very differently from a yield driven by underlying dividends when currency conditions change.
What ASIA and HVLU’s results actually tell you about portfolio construction
“International equity ETF” is not a single risk category. ASIA and HVLU require completely different evaluation frameworks.
ASIA’s top three holdings account for approximately 34% of the portfolio. Those holdings are concentrated in semiconductor companies exposed to geopolitical risk across Taiwan, South Korea, and mainland China. Semiconductors are historically one of the most cyclical and volatile sectors. The 96% return and the concentration risk are not separate facts; they are the same fact viewed from two angles. Investors who take the return without fully accounting for the risk are making an incomplete assessment.
The three conditions that aligned in FY26, the AI infrastructure boom, macro tailwinds for value, and AUD depreciation, are non-repeatable in the sense that all three must recur simultaneously to produce the same result. Chasing a repeat requires a view on all three persisting.
The risk profiles differ sharply:
- Thematic/concentrated ETFs (ASIA, SEMI): Highly sensitive to a single sector; exposed to semiconductor cyclicality, geopolitical tensions, and export-control policies; returns tend to be more extreme in both directions
- Diversified factor-based ETFs (HVLU, VLUE): Spread across many countries and sectors; performance driven by factor behaviour and, in hedged versions, currency outcomes; more moderate return dispersion
The distinction matters for portfolio design. ASIA may fit as a satellite position for investors with a specific view on AI infrastructure. HVLU may fit as a core international holding for investors who want value-factor exposure with currency management built in. Neither decision should be made on one year’s performance alone.
A disciplined thematic ETF allocation caps any single theme at 5% of total portfolio value and sits on top of a diversified core that fills 70-90% of the allocation, which means ASIA’s 96% return is most instructive for investors who held it as a satellite position rather than those for whom it represented a significant portfolio weight.
Reading the FY26 data without being misled by it
The FY26 results are genuinely informative, but only if you ask the right questions before acting on them. Three questions, applied sequentially, will protect you from the most common errors:
- What was the mechanism? Identify the specific driver behind the return: sector concentration, factor exposure, currency overlay, or some combination
- Is that mechanism still in place? Assess whether the macro, thematic, or currency conditions that produced the result are likely to persist into FY27
- Does the risk profile suit your portfolio design? Match the fund’s concentration, volatility, and hedging structure against your own objectives and risk tolerance
HVLU’s 15.1% distribution yield is the clearest example of why this framework matters. That figure is backward-looking, tied to specific FX conditions, and should never be treated as a forward income estimate. The VLUE/HVLU gap is a worked example of how hedging choice is a portfolio design decision, not a performance-chasing decision.
With $372 billion now invested in ASX ETFs, the breadth of choice available to Australian investors is enormous. That makes a selection framework more valuable, not less.
Look through the ETF wrapper to index methodology, sector concentration, hedging policy, and factor exposures before allocating. The investors best positioned going into FY27 are not necessarily those who held ASIA or HVLU last year; they are those who understand what drove the result and can identify whether the same conditions are present in the next cycle.
This article is for informational purposes only and should not be considered financial advice. Past performance does not guarantee future results. Financial projections are subject to market conditions and various risk factors. Investors should conduct their own research and consult with financial professionals before making investment decisions.