
OUE REIT’s top-line revenue grew 3.8% in the first half of 2026. Its distribution per unit grew 28.6%. That arithmetic gap, where a modest revenue increase translated into an outsized income jump, is the defining feature of this result and the question every income investor should want answered.
The result, reported on 31 July 2026, produced a DPU of 1.26 cents that had already reached 55% of the full-year forecast at the midpoint, a figure that exceeded analyst expectations by a meaningful margin.
Here is what this analysis covers: the specific mechanism that turned 3.8% revenue growth into 28.6% DPU growth, which of OUE REIT’s three forward catalysts carries the most near-term weight, and whether the current 0.57x NAV discount reflects genuine undervaluation or a risk the market has correctly identified. If you are evaluating Singapore REIT income opportunities right now, these are the three questions that matter most.
Why DPU surged while revenue barely moved
The headline numbers tell a connected story when you read them in sequence rather than in isolation.
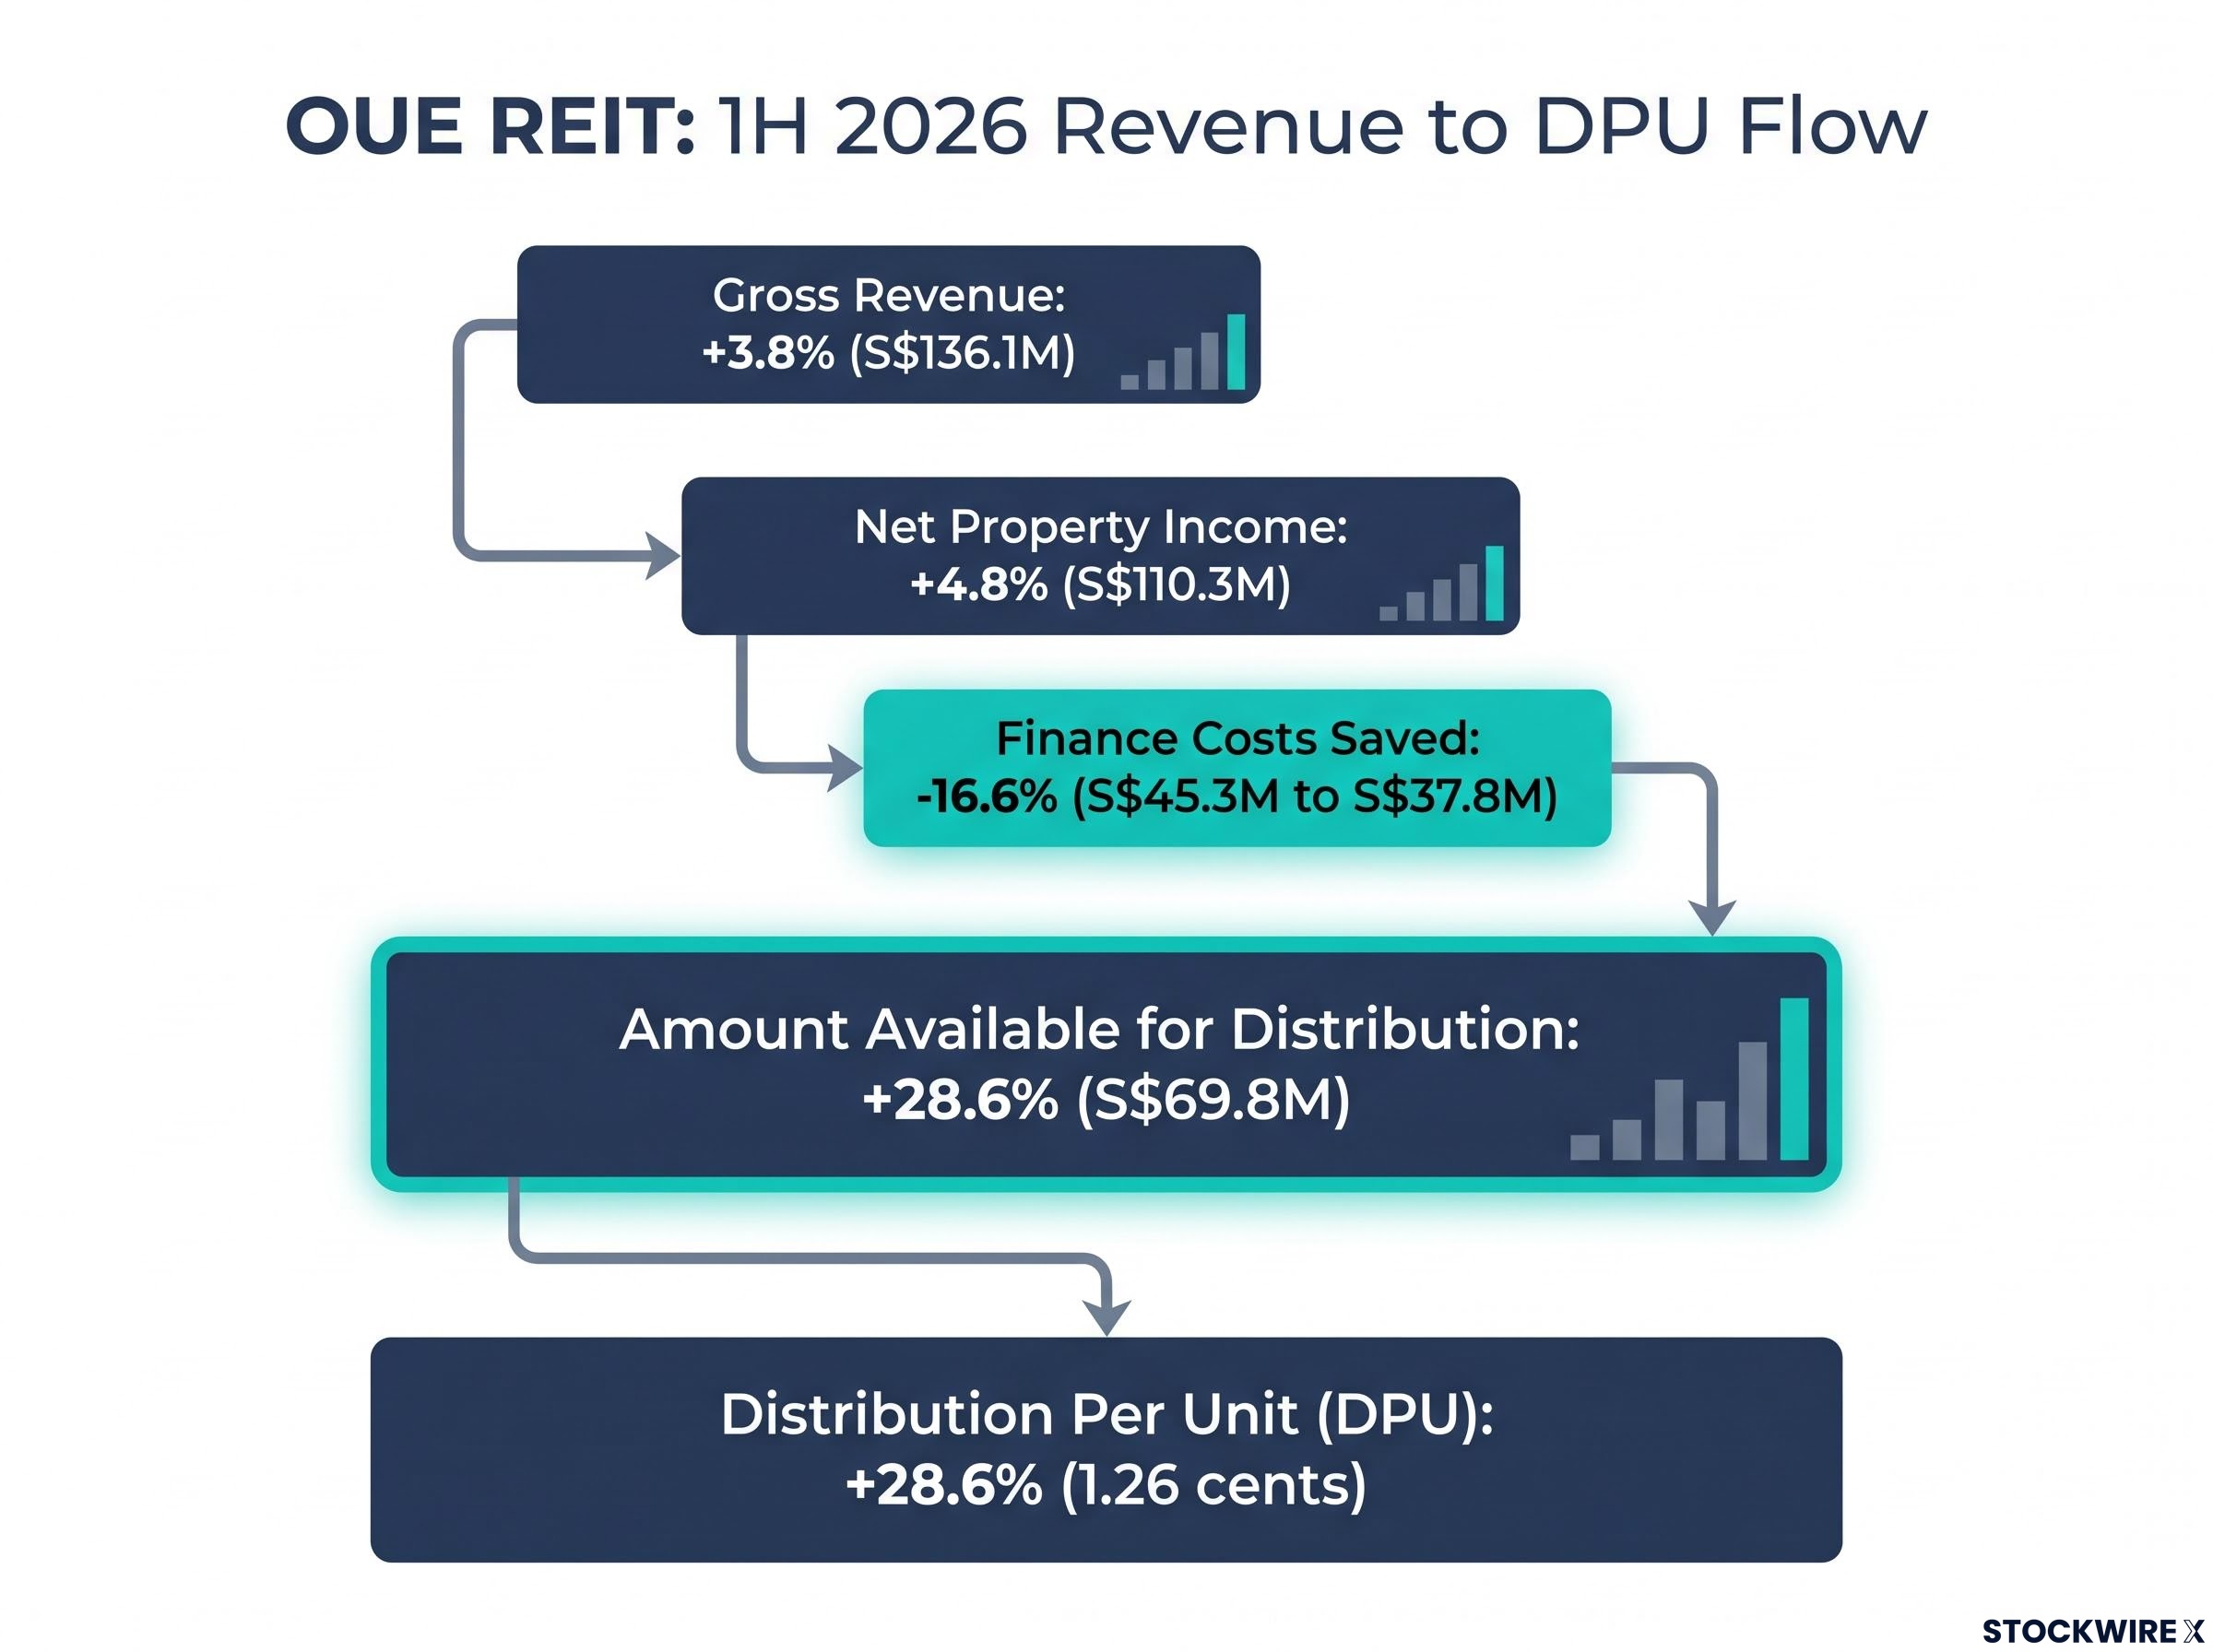
The REIT’s gross revenue reached S$136.1 million for the half, a 3.8% year-on-year increase that placed it at 50% of the full-year forecast. Net property income (NPI), the revenue that remains after direct property operating costs, settled at S$110.3 million, up 4.8% and representing 51% of the annual target. Both figures are tracking cleanly at the halfway point, but neither explains a 28.6% DPU surge.
The mechanism sits one line lower. Finance costs, the interest the REIT pays on its borrowings, contracted sharply over the period, dropping 16.6% year-on-year from roughly S$45.3 million to S$37.8 million. That saving of approximately S$7.5 million flowed directly into the distribution pool. Alongside this, the average cost of debt moved from around 4.2% down to 3.6%, and the interest coverage ratio strengthened from 2.6x to 2.8x.
The finance cost reduction from roughly 4.2% to 3.6% average cost of debt illustrates how rate transmission channels operate at the individual REIT level: a lower borrowing cost benchmark feeds directly into the distributable income pool, producing DPU growth that materially outpaces revenue growth.
DPU: 1.26 cents (+28.6%), already at 55% of the full-year forecast
| Metric | 1H 2026 | YoY Change | Full-Year Forecast |
|---|---|---|---|
| Gross Revenue | S$136.1M | +3.8% | 50% |
| Net Property Income | S$110.3M | +4.8% | 51% |
| Finance Costs | S$37.8M | -16.6% | N/A |
| Amount Available for Distribution | S$69.8M | +28.6% | N/A |
| Distribution Per Unit | 1.26 cents | +28.6% | 55% |
This is not accounting creativity. It is a genuine cash flow improvement driven by active refinancing and a lower rate environment. The 55% full-year DPU coverage at the half-year mark tells you that distribution outperformance is already baked into 2026, making this a more defensible income position than the modest revenue figure alone would suggest.
When big ASX news breaks, our subscribers know first
The hospitality engine: what drove double-digit RevPAR growth
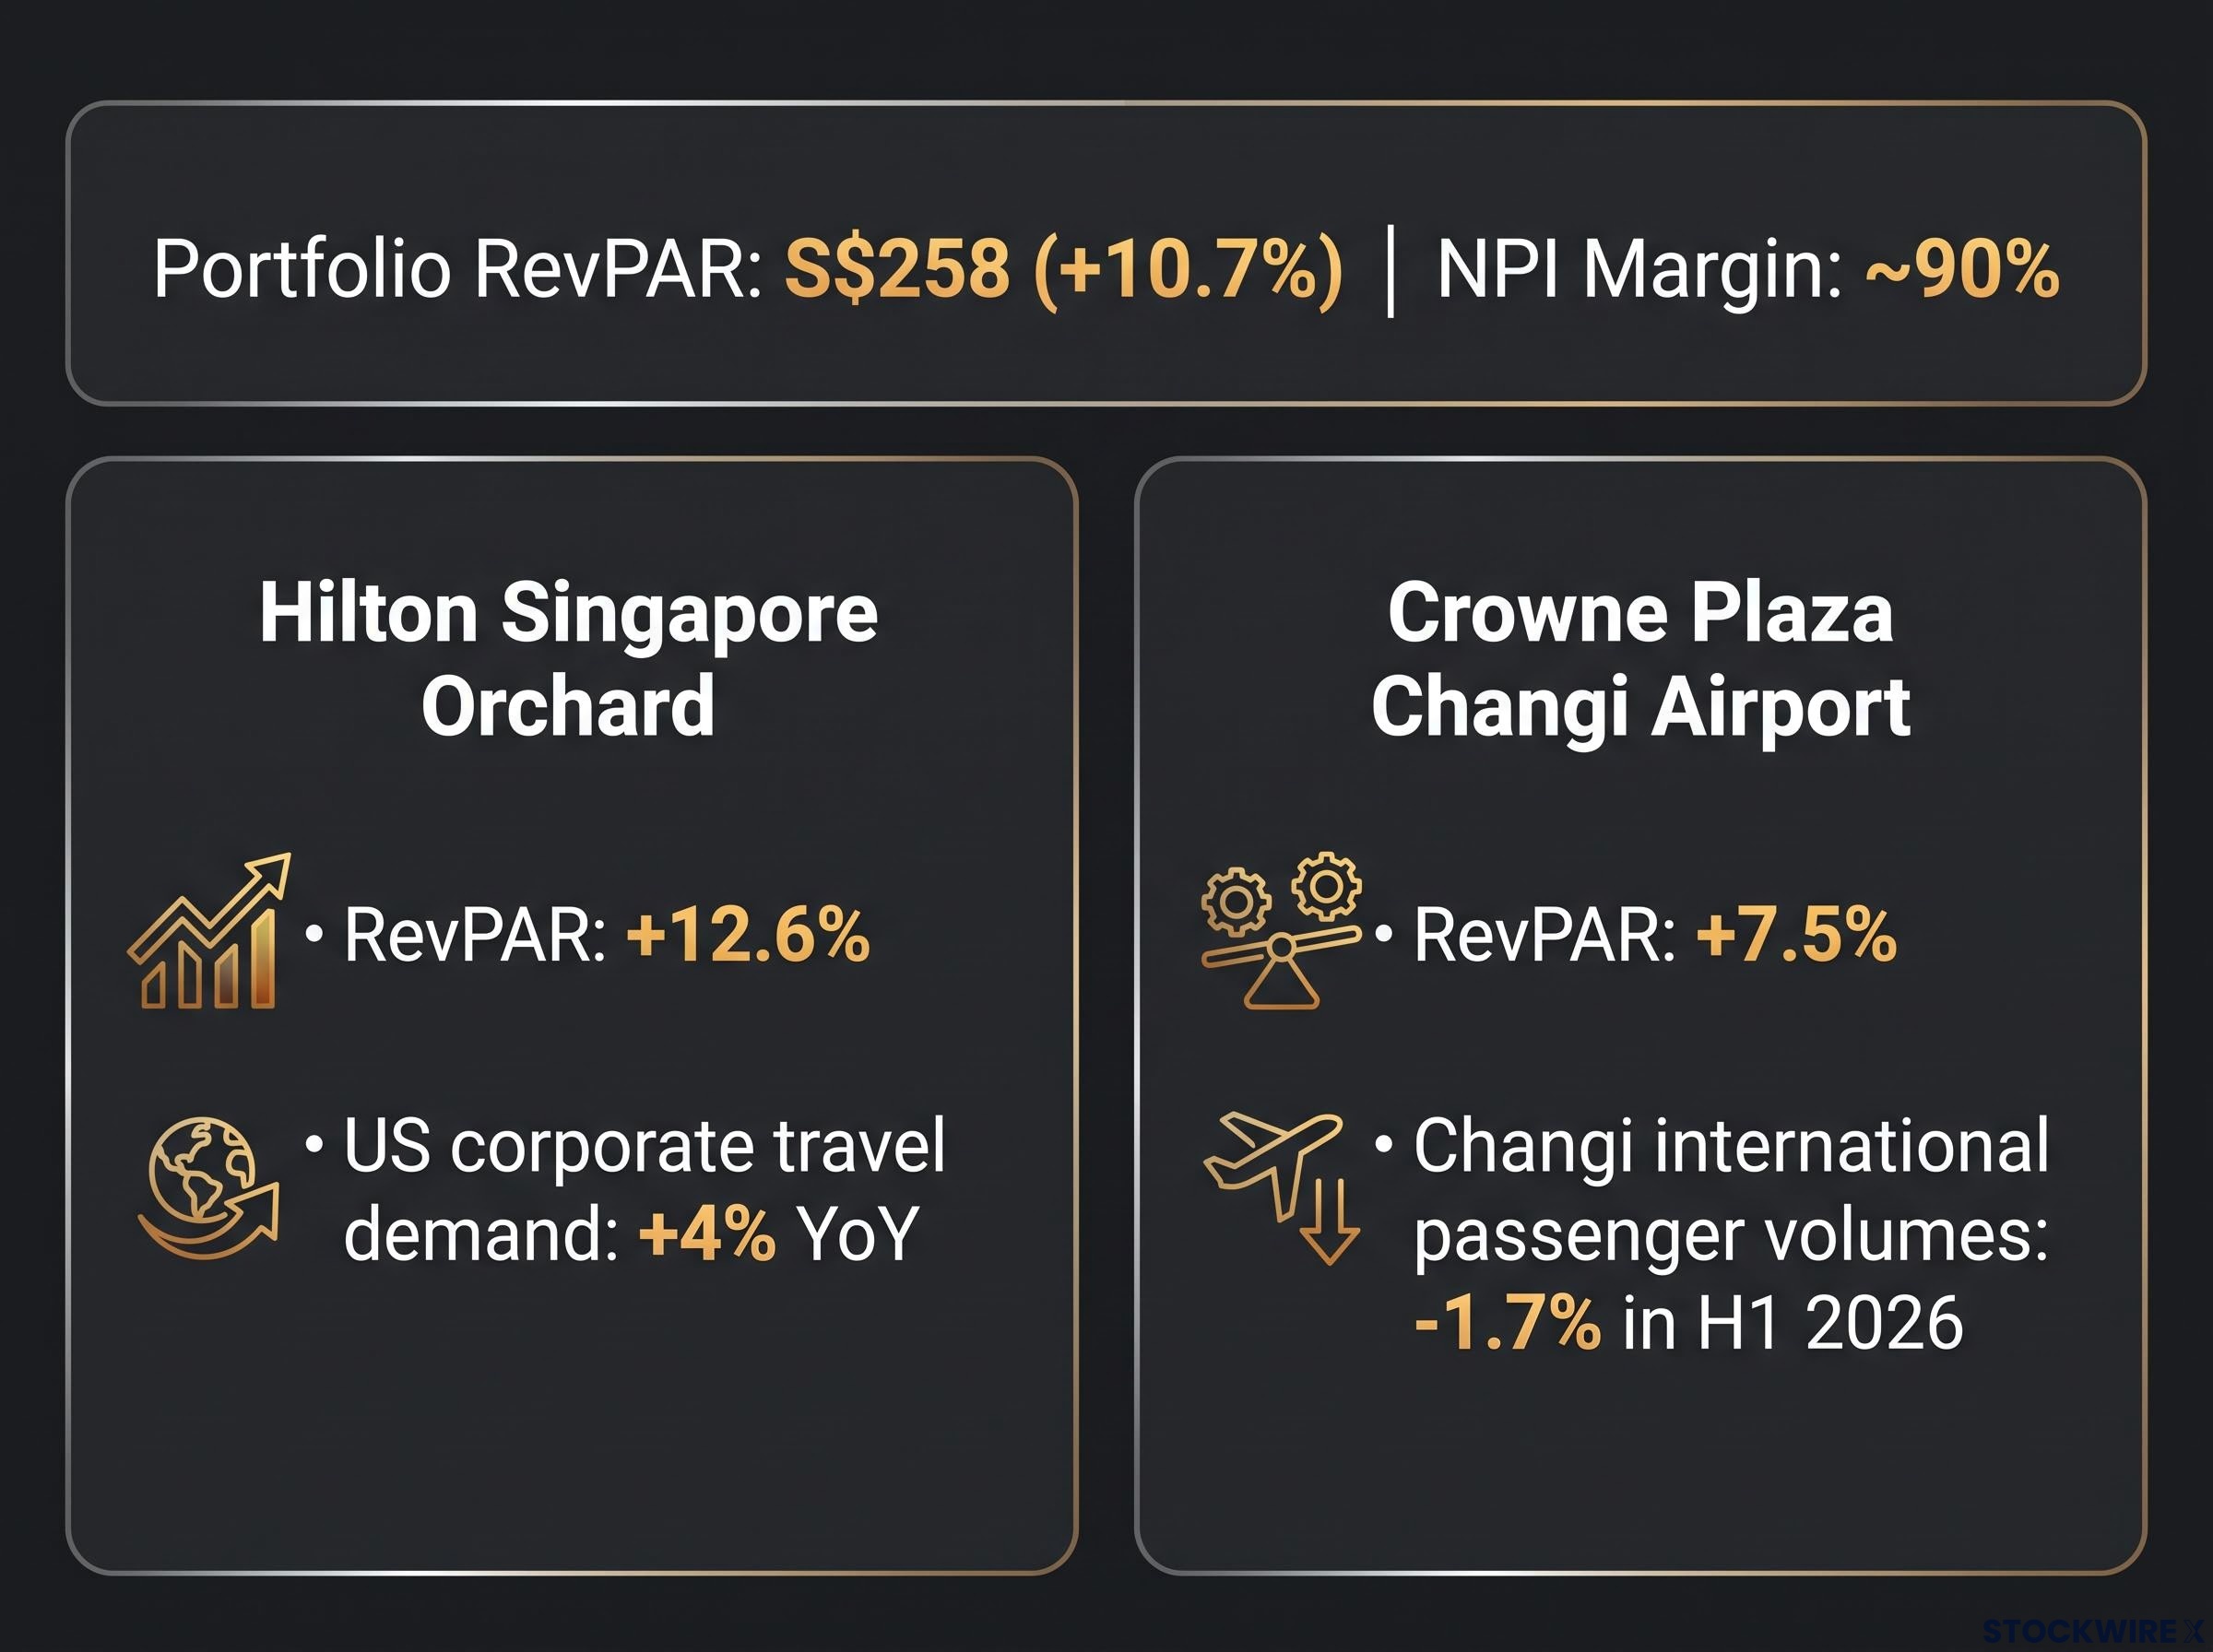
The hospitality segment was the standout contributor to portfolio growth across the first half. Its revenue climbed 11.2% to S$50.1 million, NPI advanced 12.3% to S$45.1 million, and portfolio RevPAR (revenue per available room, a metric that captures both pricing power and occupancy in a single figure) expanded 10.7% to reach S$258.
The NPI margin here is worth pausing on. At approximately 90% (S$45.1 million NPI on S$50.1 million revenue), nearly every additional dollar of RevPAR-driven revenue flows through to the distribution pool. That margin dynamic means NPI grew faster than revenue, giving DPU an earnings leverage effect that top-line growth alone does not capture.
The two hotels contributing to this figure had distinct demand drivers, which matters for assessing sustainability.
Hilton Singapore Orchard
- RevPAR advanced 12.6% year-on-year
- The hotel’s strong positioning with US corporate clients allowed it to capture growing American business travel demand, which rose approximately 4% year-on-year, while also benefiting from improved MICE (meetings, incentives, conferences, and exhibitions) bookings
- This performance partially offset a pullback in leisure arrivals from Indonesia and China
Crowne Plaza Changi Airport
- RevPAR posted a 7.5% year-on-year gain even as overall international passenger volumes at Changi fell 1.7% during H1 2026
- Higher transit passenger traffic offset the broader decline in international arrivals
The fact that Crowne Plaza delivered 7.5% RevPAR growth despite falling passenger volumes tells you that management’s revenue optimisation is doing genuine work, reducing but not eliminating the air travel demand risk.
One watchpoint: portfolio RevPAR was S$277 in 1Q 2026 (up 11.7% year-on-year) but settled at S$258 for the full first half, reflecting some second-quarter moderation. That is worth monitoring, though it does not alter the structural picture.
Commercial stability: not a growth engine, but not a liability
Commercial revenue came in at S$86.0 million, essentially flat at -0.1% year-on-year. NPI was equally flat at S$65.3 million (up 0.1%). This is a portfolio that held its ground rather than contributed growth.
The real story in the commercial segment is forward-looking. Deloitte vacated approximately 150,000 sq ft at OUE Downtown, and backfilling that space at prevailing market rental rates is now the single most consequential variable for commercial segment NPI in the second half of 2026 and beyond. Until leasing execution delivers, the commercial segment’s trajectory is a management question, not a macro one.
OUE REIT’s mixed portfolio of hospitality and commercial assets means its investment case sits at the intersection of two diverging S-REIT sub-sector dynamics: hospitality benefiting from structural MICE and corporate travel demand, and office facing the hybrid-work reset that is concentrating tenant demand in prime CBD locations at the expense of secondary stock.
Salesforce Tower contribution: S$10.4 million in 1H 2026
One growing offset: OUE REIT’s 19.9% interest in Salesforce Tower contributed S$10.4 million in share of results in 1H 2026, an increasingly meaningful income line that partially cushions the commercial segment’s flat headline figures.
Three catalysts that could re-rate the unit price
Three potential re-rating catalysts sit ahead for OUE REIT, and they are not equal in certainty or timing. Ranking them by confidence helps you build a more precise view of forward earnings.
- 2027 debt refinancing (highest certainty). Two tranches of fixed-rate medium-term notes fall due in 2027: S$150 million in May and S$250 million in June, together totalling S$400 million and priced at roughly a 4% coupon. With the current average cost of debt at 3.6%, refinancing at or near prevailing rates would generate a direct and calculable benefit to distributable income. This is the catalyst you can underwrite with the most confidence, because the principal amount and approximate rate differential are already known.
OUE REIT’s 2027 refinancing opportunity is not isolated; the broader S-REIT sector is navigating a rate environment where SORA financing costs have fallen more than 110 basis points over the past year, giving SGD-funded trusts a meaningful structural tailwind that is feeding through to distributable income across the sector.
- OUE Downtown backfilling (medium-term, management-dependent). Re-leasing the 150,000 sq ft vacated by Deloitte at prevailing market rents would represent a meaningful step-change in commercial segment NPI. Timing depends on leasing execution and tenant demand.
- Salesforce Tower capital redeployment (highest upside, least defined). The 19.9% stake already contributed S$10.4 million in 1H 2026. Further redeployment of divestment proceeds is anticipated to be value-accretive, but the specifics remain open.
| Catalyst | Key Variable | Timeline | Estimated Impact |
|---|---|---|---|
| 2027 Debt Refinancing | Rate differential on S$400M | May-June 2027 | Direct DPU uplift |
| OUE Downtown Backfilling | 150,000 sq ft re-leasing | 2H 2026 onward | Commercial NPI step-change |
| Salesforce Tower Redeployment | Capital allocation of proceeds | Undefined | Value-accretive (magnitude TBD) |
What the valuation discount and analyst target imply
Price-to-NAV: 0.57x
OUE REIT is currently priced at 0.57x net asset value. A discount that deep warrants scrutiny; it implies the market has priced in a meaningful probability of earnings disappointment.
| Metric | Current Value | Analyst View |
|---|---|---|
| Price-to-NAV | 0.57x | Implies discount to book |
| Forward 2026 Yield | 6.2% | Attractive vs sector |
| Target Price | Current trading level | S$0.45 (Phillip Securities, BUY) |
Phillip Securities Research has kept its BUY recommendation in place, with a target price of S$0.45 derived from a dividend discount model that remains unchanged. That target implies a forward yield of approximately 6.2% at current pricing.
Some discount is warranted. Office leasing execution on the Deloitte vacancy is unresolved. Hospitality cycle sustainability is not guaranteed. The 2027 refinancing, while likely favourable, is not yet executed. These are real risks.
But the 1H result, with DPU already at 55% of the full-year forecast, materially reduces the probability of the most bearish scenarios. The question for income investors is whether the 6.2% yield is compensation for genuine risk or represents a market mispricing that the second half’s operational updates may begin to correct.
What is actually in the Singapore REIT hospitality premium, and why it matters here
For readers newer to hotel-owning REITs, three metrics determine whether a hospitality REIT is converting guest demand into unitholder income:
- RevPAR (revenue per available room): Captures both room pricing and occupancy in a single figure. It is the primary operating metric for hotel REITs because it tells you whether demand strength is translating into revenue, not just headcount.
- NPI (net property income): Revenue minus direct property operating costs. This is the income the REIT has available before financing and trust-level expenses. The higher the NPI margin, the more revenue flows through to distributions.
- Distributable income: The cash pool from which the REIT pays unitholders. NPI feeds directly into this, which is why NPI margin expansion has a multiplier effect on DPU.
Singapore’s position as a global MICE and corporate travel hub provides structural demand tailwinds for hotel REITs. The approximately 4% growth in American corporate demand cited by management is an indicator of this structural advantage, not a cyclical bounce.
With the hospitality segment running at approximately 90% NPI margins, nearly every additional dollar of RevPAR-driven revenue flows through to distributable income. That is the insight that makes the DPU growth story click into place.
Whether the risk picture has changed after the 1H print
The 1H result did not eliminate risk, but it changed the weight of specific risks in a way that matters for positioning.
| Risk Factor | Status After 1H Print | Key Watchpoint |
|---|---|---|
| Hospitality demand sustainability | Reduced | RevPAR moderation from S$277 (1Q) to S$258 (1H) |
| Deloitte office vacancy | Open | 150,000 sq ft backfilling progress in 2H updates |
| 2027 refinancing execution | Reduced | Interest coverage improved to 2.8x; rate environment supportive |
| International arrivals at Changi | Open | -1.7% passenger volume; softer Indonesian and Chinese demand |
DPU at 55% of full-year forecast at the halfway mark: distribution sustainability risk materially reduced.
The balance sheet and distribution story have been de-risked by the 1H print. Interest coverage is stronger. DPU is tracking ahead of forecast. The financing risk that would have concerned income investors six months ago is now substantially addressed.
Two risks remain open and unresolved: the Deloitte vacancy at OUE Downtown and the softness in international arrivals at Changi Airport. These are the variables that will determine whether the current NAV discount closes or persists through the next reporting cycle.
Three variables to watch before the next REIT review cycle
- Deloitte backfilling progress. This is the variable most likely to surface first. Operational updates in 2H 2026 should disclose leasing momentum on the 150,000 sq ft vacancy. Any announced tenancy above market expectations would be a direct positive catalyst for the commercial segment.
- 2027 refinancing announcement. Watch for the terms on the S$400 million in maturing notes. Refinancing at or below the current 3.6% average cost of debt would confirm the next leg of DPU support.
- Changi international passenger volumes. The -1.7% decline in 1H 2026 is not yet acute, but a further deterioration would pressure Crowne Plaza’s RevPAR trajectory and narrow the hospitality segment’s growth contribution.
At a forward 2026 yield of 6.2% and a price-to-NAV of 0.57x, OUE REIT ranks among the more attractively valued income plays in the Singapore REIT sector, a view supported by Phillip Securities’ BUY rating and S$0.45 price target as of 31 July 2026. The 1H result has answered the distribution sustainability question. The two remaining open risks, office leasing and airport passenger demand, are what the second half needs to address.
For investors wanting to apply a structured framework before making a positioning decision, our dedicated guide to evaluating Singapore REITs covers the seven-part assessment methodology analysts use to weigh gearing, debt structure, income durability, and sponsorship quality together.
This article is for informational purposes only and should not be considered financial advice. Investors should conduct their own research and consult with financial professionals before making investment decisions. Past performance does not guarantee future results. Financial projections are subject to market conditions and various risk factors.