
The 30-year US Treasury yield is sitting near 5.21%, its highest level since 2007. For most of the past two decades, a yield that high on the world’s benchmark safe-haven bond would have triggered a wave of buying. Instead, the world’s largest bond managers are selling.
PIMCO, Schroders, BlackRock, DoubleLine, Jupiter Asset Management, and two of Europe’s biggest pension funds have all reduced or exited long-dated Treasury positions in the first half of 2026. The trigger is not a single event but a convergence: the Federal Reserve kept its policy rate on hold even as inflation was running at 3.5%, compressing real returns on long-dated paper and forcing a repricing of the fiscal risk embedded at the long end of the curve.
Here is the structural case behind the rotation, where the capital is going, the supply-side pressure most investors are overlooking, and what this shift signals about the role of US Treasuries in global portfolios going forward. This is not a tactical positioning story. It is a framework for reading a potential permanent change in how the world’s safest asset is being evaluated.
Why long-dated Treasuries stopped looking like safety
At first glance, 5.21% on a 30-year US Treasury looks generous.
The 30-year US Treasury yield reached 5.21%, a level not seen since 2007, having climbed roughly 27 basis points across the prior three months.
Then the layers come off. With inflation running at 3.5% and the Fed choosing to hold rather than hike, the real return on that fixed coupon shrinks considerably. A 30-year bond locking in a nominal 5.21% while inflation sits 150 basis points above the Fed’s target is not offering compensation for patience; it is asking the holder to absorb a policy-credibility bet they did not sign up for.
The Fed credibility gap has been priced directly into the yield curve’s shape, with long-term yields rising while short-term rates fell after the July FOMC meeting, a steepening that represents the market’s explicit assessment of the Fed’s long-run inflation resolve after 63 months of above-target prices.
The comparison with other developed-market sovereigns sharpens the picture. Over the same three-month period:
- 30-year US Treasuries: climbed around 27 basis points
- Australian 30-year equivalents: moved higher by around 9 basis points
- UK gilts: gained around 7 basis points
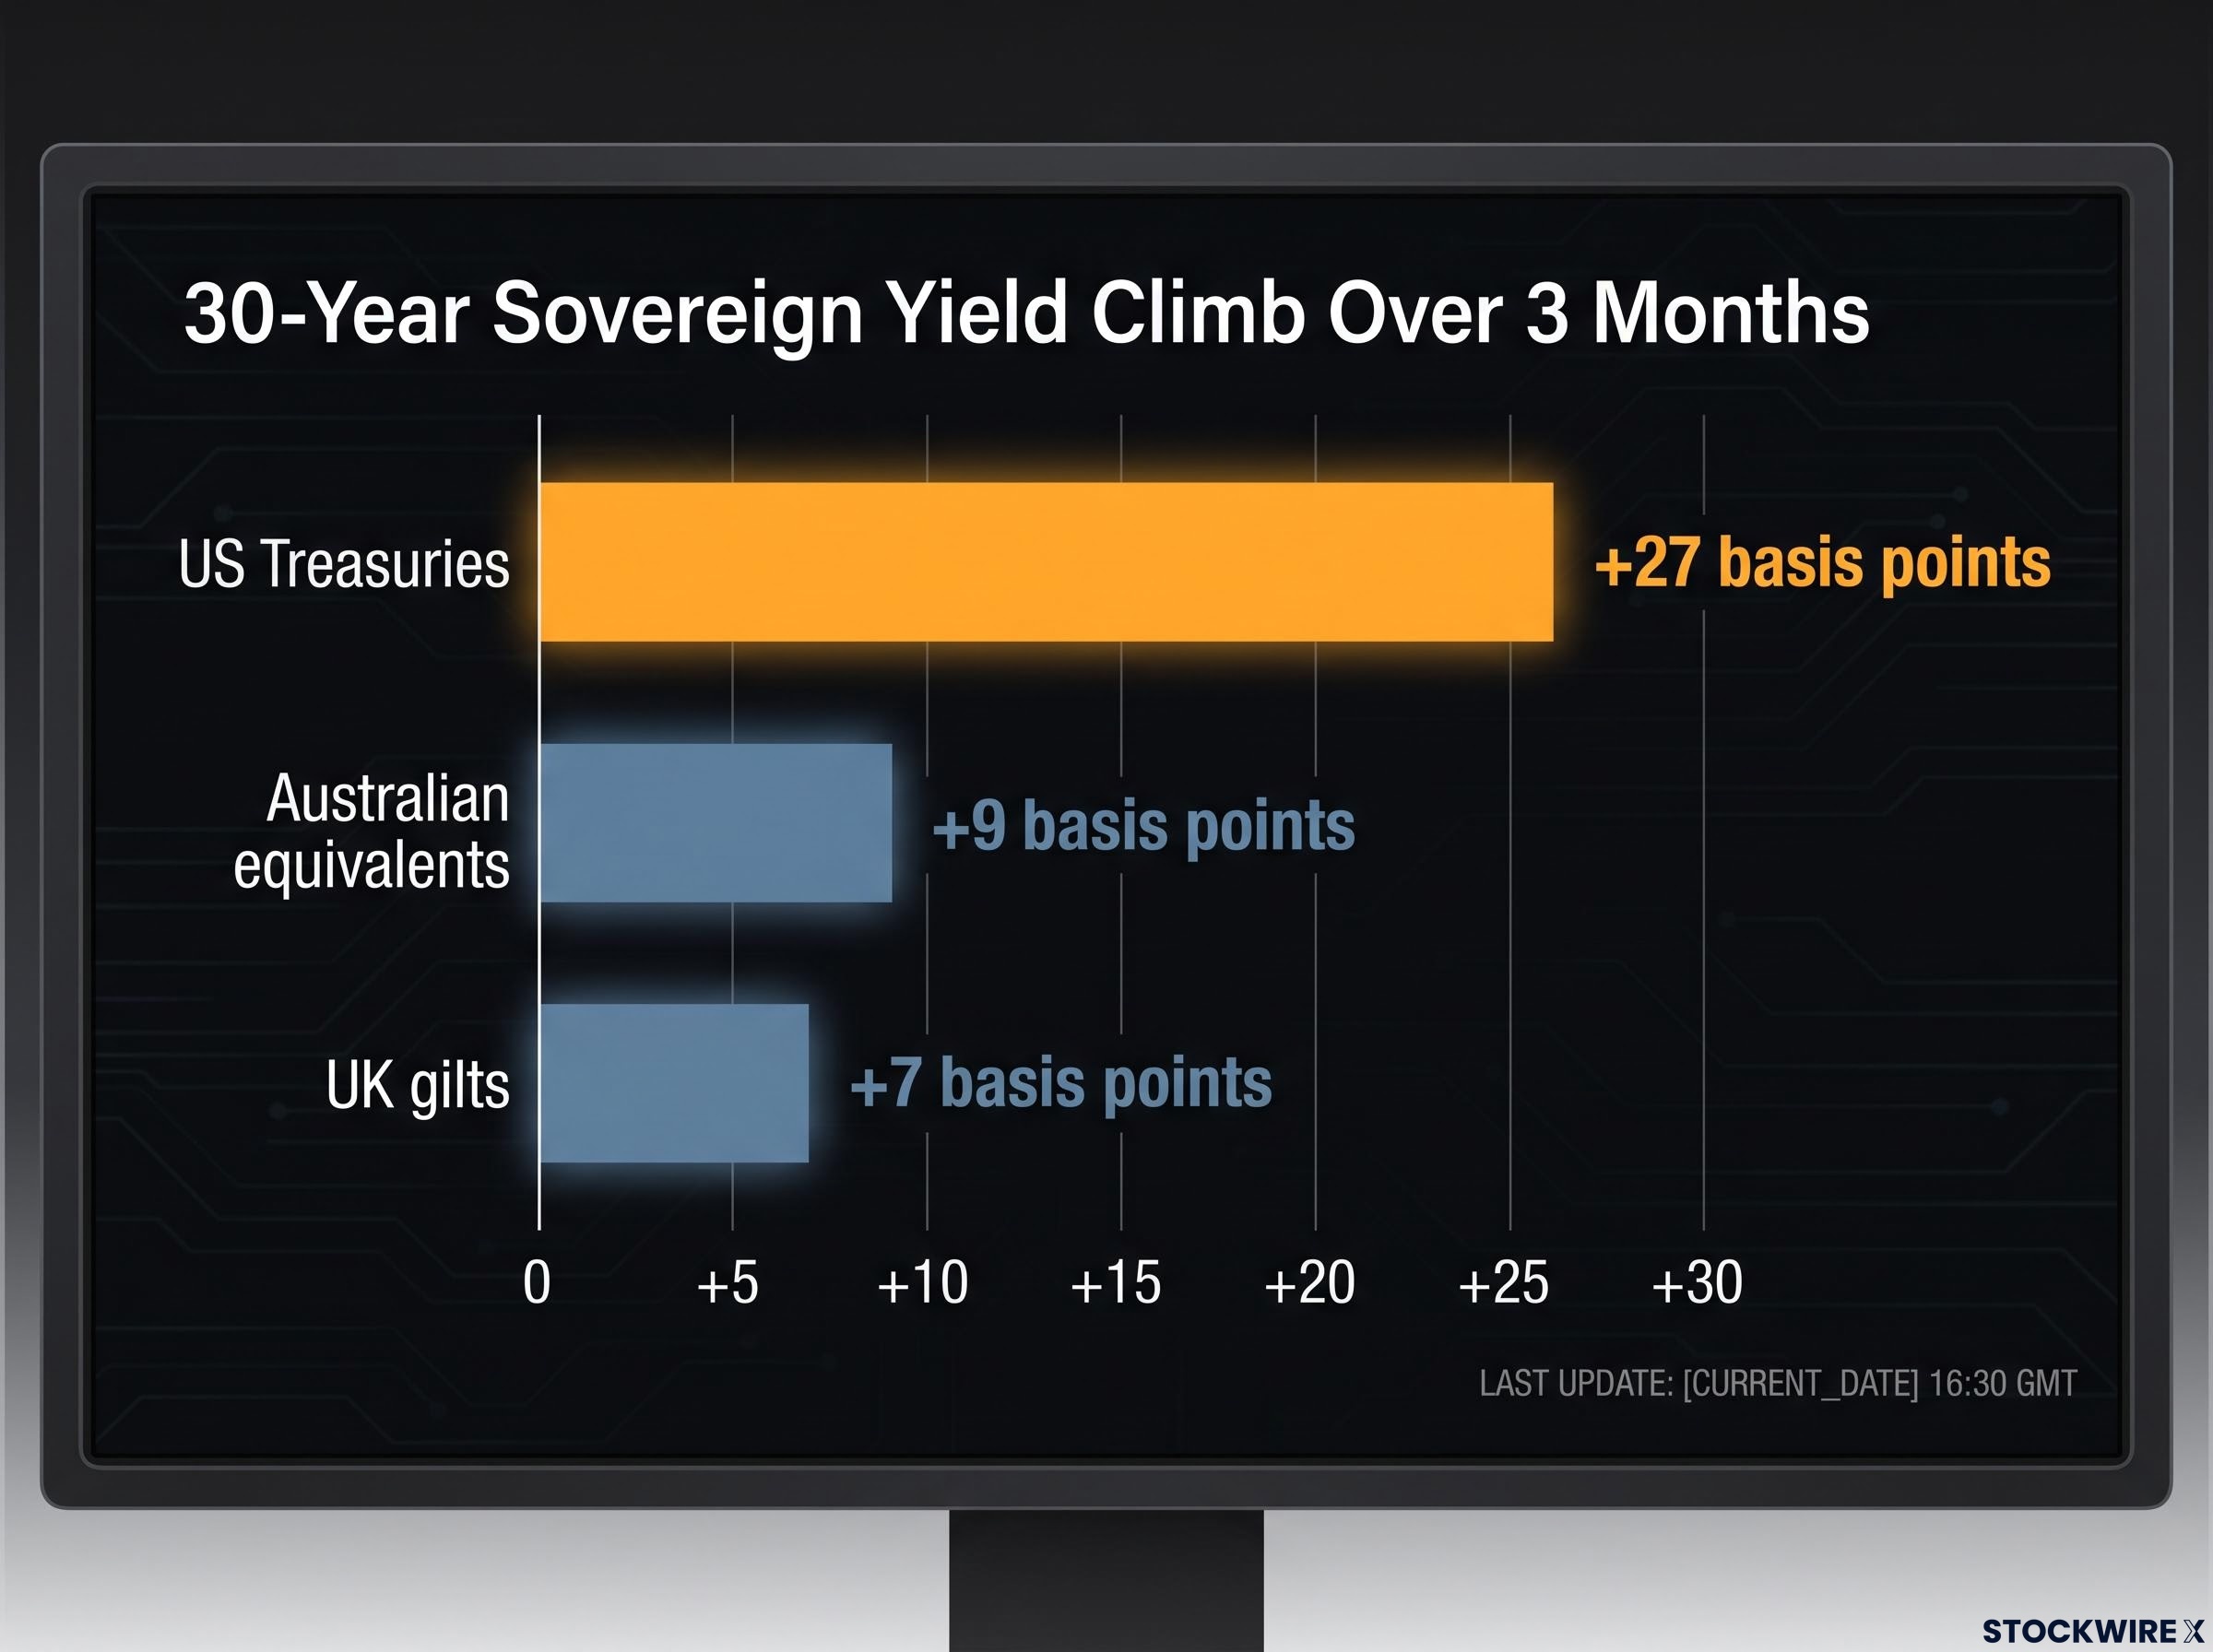
That yield-stability gap tells you the market is not pricing a generic global rate move. It is pricing a US-specific risk premium, built from fiscal uncertainty and doubts about the Fed’s willingness to act on inflation. If you are thinking about geographic diversification in fixed income, that distinction matters more than the headline yield number.
When big ASX news breaks, our subscribers know first
The fiscal floor has dropped: what the debt trajectory means for long-end pricing
PIMCO, managing approximately $2.33 trillion in assets, is not hedging its language. The firm explicitly cites a “deteriorating fiscal profile” and “US debt sustainability questions” as reasons to reduce exposure to long-term US government debt.
PIMCO describes its stance on long-term US debt as bearish because of “a deteriorating fiscal profile” and “US debt sustainability questions.”
The Congressional Budget Office (CBO) projects multi-year annual deficits above $2 trillion, a figure referenced by both BlackRock and Vanguard in consecutive allocation guidance updates. Those deficits need to be funded, and funding them means additional heavy issuance at the long end of the curve.
The US fiscal deficit trajectory has attracted convergent warnings from BlackRock, JPMorgan, Goldman Sachs, and Bridgewater, all of which have independently reduced exposure to long-duration nominal Treasuries and rotated toward real assets, a positioning shift that reinforces the structural case behind the current institutional rotation.
The mechanism compounds in three steps:
- Larger deficits require more Treasury issuance, particularly at longer maturities
- Additional supply depresses bond prices and pushes yields higher
- As the traditional buyer base of central banks and reserve managers retreats, the marginal demand shifts to price-sensitive private investors who require higher yields to absorb that supply
Western Asset’s analysis documents this shift in buyer composition directly. Long-end yields increasingly embed compensation for fiscal and inflation risk rather than simply reflecting expectations for future short-term interest rates. For an investor holding 20-30-year Treasuries, the implication is uncomfortable: the yield you are receiving may not be static compensation but rather the floor of an upward repricing process. The price risk of holding long duration here is asymmetric to the downside.
Where the rotation is going: the geography of the trade
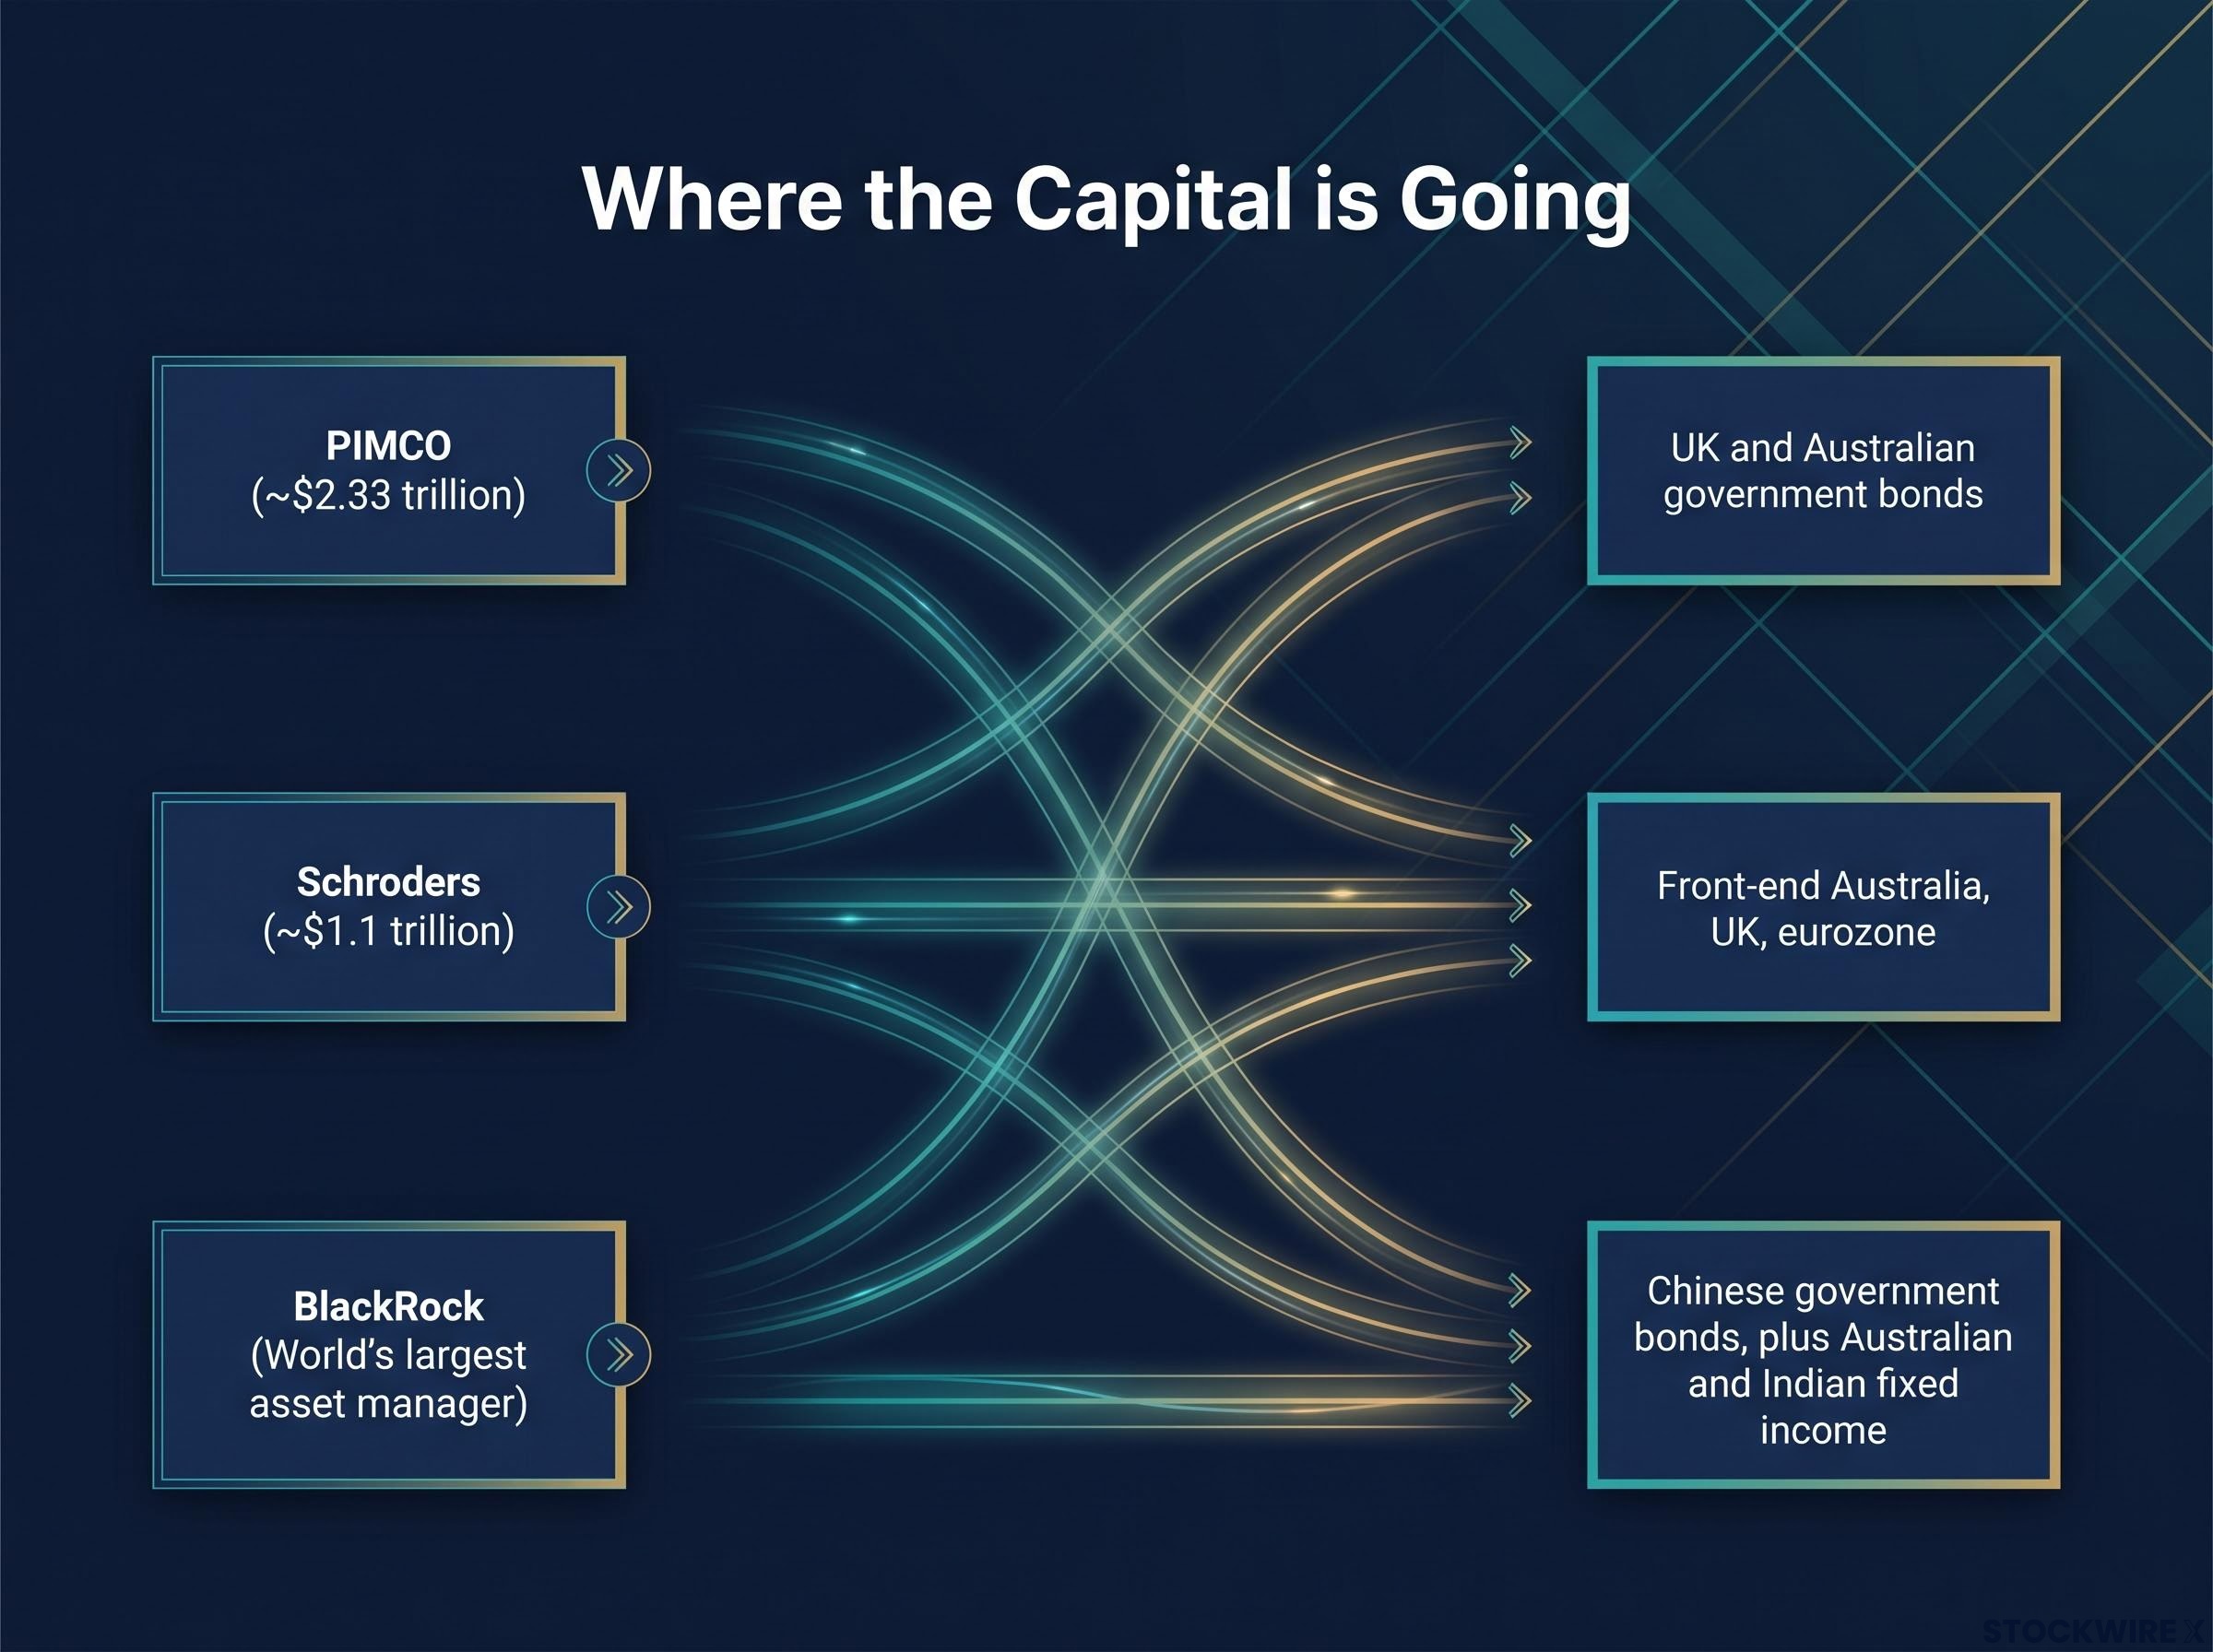
The managers exiting long-dated Treasuries are not scattering capital randomly. The destination markets follow a coherent pattern organised around three selection criteria: policy credibility, fiscal quality, and duration discipline.
| Manager | AUM / Scale | Direction | Preferred Destinations |
|---|---|---|---|
| Schroders | ~$1.1 trillion | Increasing bearish Treasury positions | Front-end Australia, UK, eurozone |
| PIMCO | ~$2.33 trillion | Reducing long-dated US duration | UK and Australian government bonds |
| Gama Asset Management | Global macro fund | Cutting long-dated Treasury exposure | Australia, South Korea, Singapore, Norway |
| BlackRock | World’s largest asset manager | Cutting recommended US gov bond allocations | Chinese government bonds, plus Australian and Indian fixed income |
| Jupiter Asset Management | Strategic bond fund | Fully liquidated US Treasuries | European sovereigns, emerging-market debt |
| AkademikerPension | Danish pension fund | Exited ~$100M Treasury portfolio | Non-US sovereign allocation |
| ABP | Europe’s largest pension fund | Cut Treasury holdings by ~€10B over 2025 | Diversified sovereign portfolio |
The front-end developed-market tier, Australia, the UK, and the eurozone, attracts the bulk of the rotation from Schroders, PIMCO, and Jupiter. These are markets where central banks are seen as running credible inflation-targeting regimes and where fiscal positions look stronger relative to the US.
Why policy credibility is the new primary allocation variable
Gama Asset Management’s Rajeev De Mello has been building sovereign positions across Australia, South Korea, Singapore, and Norway, a portfolio constructed explicitly around central banks perceived as more reliably inflation-targeting at this stage of the cycle: the Reserve Bank of Australia (RBA), Bank of Korea, Monetary Authority of Singapore (MAS), and Norges Bank.
The contrast is direct. With inflation at 3.5%, the Fed opted to hold rates unchanged rather than tighten further. The RBA and Bank of England are seen as running more responsive, if sometimes cautious, frameworks. When managers as different as PIMCO, Gama, and AkademikerPension converge on similar destination markets, this is not idiosyncratic positioning. It is a structural reassessment of where sovereign credit quality, central bank credibility, and real yield competitiveness intersect.
What Japan’s intervention adds to the supply equation
Most investors reading the Treasury rotation story will not connect it to what happened in the yen market. They should.
Ahead of the Bank of Japan’s (BOJ) rate decision on 31 July 2026, the Japanese yen recorded its sharpest intraday advance against the US dollar since December 2023, surging as much as 3.3% before settling at 159.53 yen per dollar, with Japanese authorities stepping into the market to support the currency.
Over the preceding quarter, Japan deployed a record approximately ¥11.73 trillion (approximately US$73.2 billion) in yen-buying operations funded from its foreign currency reserves.
Japan’s yen intervention campaign, which reached a record approximately 11.7 trillion yen across 2026 and still failed to prevent USD/JPY hitting its weakest level since 1986, illustrates precisely why the Treasury supply consequence of these operations persists: funding yen purchases requires liquidating dollar reserves that include substantial US government bond holdings.
The mechanism matters because it feeds directly into Treasury supply:
- Japan sells US dollars from its foreign currency reserves to purchase yen and support the currency
- Those reserves include significant holdings of US Treasuries, meaning the intervention draws down or liquidates long-dated US government bonds
- The resulting net Treasury supply must be absorbed by price-sensitive private investors, who require higher yields to take on the exposure
The BOJ held its policy rate unchanged at its 31 July 2026 meeting, coming after the prior month’s rate increase had pushed the benchmark to its highest point since 1995. For a reader holding long-dated Treasuries, Japan’s intervention is not a geopolitical footnote. It is a supply-side event that compounds the fiscal issuance pressure already pushing long-end yields higher, creating a two-front challenge for anyone positioned at the long end of the curve.
Understanding duration risk and why it cuts deeper in a fiscal-inflation environment
Duration measures how sensitive a bond’s price is to changes in yield. The longer the maturity, the more the price moves for every basis point of yield change. A 30-year bond loses significantly more in price per basis-point rise than a 5-year bond, and this sensitivity is not linear; it accelerates with maturity.
That 27-basis-point rise in the 30-year Treasury yield over three months translates into a material price loss for holders, one that is not recoverable quickly from coupon income alone. The conditions driving that move, persistent inflation above target and heavy fiscal issuance, have not reversed.
The duration risk mechanics driving these losses are not abstract; the Bloomberg US Aggregate Bond Index fell 13.0% in 2022 and long-dated zero-coupon Treasuries dropped 39.2% in the same year, providing a concrete historical baseline for the price consequences that now accompany the 27-basis-point yield move documented across the current three-month period.
The characteristics of short versus long Treasuries look sharply different in this environment:
- Price sensitivity: Short-term (2-7 year) bonds move modestly per basis-point shift; long-dated (20-30 year) bonds amplify losses considerably
- Inflation risk exposure: Front-end bonds mature before long-run inflation uncertainty fully compounds; long-dated paper absorbs the full weight of any inflation surprise
- Fiscal risk exposure: Short maturities roll over into prevailing rates and adjust; long maturities lock the holder into a fixed coupon while the fiscal backdrop deteriorates
- Demand base: Short- and intermediate-dated Treasuries retain strong institutional and central bank demand; long-end demand increasingly depends on price-sensitive private buyers
How managers are constructing the front-end tilt in practice
DoubleLine, PIMCO, and TCW are executing a barbell or front-end tilt: underweighting or shorting 20-30-year Treasuries while overweighting 2-10-year maturities in the US and preferred non-US markets. This approach captures income in high-grade assets while limiting exposure to the tail risks concentrated at the long end, where fiscal dynamics and inflation uncertainty converge most acutely.
What the rotation signals about Treasuries’ long-term role in global portfolios
The most conservative institutional investors globally, major pension funds and large sovereign bond allocators, are repositioning away from the same asset, at the same time, for the same reasons. PIMCO, Schroders, Gama, BlackRock, DoubleLine, TCW, Jupiter, AkademikerPension, and ABP have all moved in the same direction. That convergence is the signal.
The safe-haven assumption underpinning long-dated US Treasuries is being stress-tested by the institutions that relied on it most heavily.
Long-dated Treasuries are no longer being treated as the default allocation. They are being evaluated on the same risk-return and policy-credibility criteria as any other sovereign market. For a reader building or reviewing a fixed income allocation today, that is the shift to internalise: evaluating US Treasury exposure now requires the same framework you would apply to Australian, UK, or eurozone government bonds, considering fiscal trajectory, central bank credibility, and real yield competitiveness rather than assumed safe-haven status.
Whether the rotation reverses depends on two specific conditions:
- Tangible improvement in the US fiscal trajectory, meaning deficit reduction that markets can verify, not just projection revisions
- Renewed evidence that the Fed has both the commitment and the capacity to deliver and maintain its 2% inflation target
Until those conditions materialise, the direction of institutional capital is clear. Policy credibility, not yield levels alone, is the variable to watch.
This article is for informational purposes only and should not be considered financial advice. Investors should conduct their own research and consult with financial professionals before making investment decisions. Past performance does not guarantee future results. Financial projections are subject to market conditions and various risk factors.