One hundred dollars per barrel. For most investors, the number triggers a specific kind of dread, a flashback to fuel crises, recessions, and collapsing portfolios. The instinct is understandable. It is also, in most cases, wrong.
The last time oil spent several consecutive years above $100, from 2011 to 2014, the global economy kept expanding. When Russia launched its full-scale Ukraine invasion in early 2022, Brent crude climbed to around $133, yet global economic expansion continued without being derailed. The fear is rooted in the 1970s, but the economy of 2026 is structurally different. Once you account for inflation, $100 today carries roughly the purchasing-power burden of $75 in 2019 money, which changes what the number actually means for economic activity.
Here is how to assess whether energy-price headlines deserve the weight investors are giving them right now, and what the evidence shows about when oil prices affect stocks in ways that matter, and when the fear outstrips the damage.
Three years above $100, and the world kept growing
Oil sat above $100 a barrel for the entire 2011 to 2014 period. Four years. No global recession. No equity market collapse. Brent peaked at approximately $133 in the immediate aftermath of Russia’s invasion of Ukraine in early 2022, and the global economy absorbed the shock and kept growing.
The S&P 500’s performance across the three modern episodes when oil crossed $100 tells a more complicated story than the headlines would suggest.
| Episode | Approx. Peak Oil Price | S&P 500 12-Month Return | Primary Driver |
|---|---|---|---|
| 2008 | ~$145 | ~-40% | Banking crisis, housing collapse |
| 2011 | ~$125 | ~+3% | Arab Spring disruptions, limited contagion |
| 2022 | ~$133 | ~-8% | Russia-Ukraine shock, inflation, rate hikes |
All three episodes produced returns below the long-run equity average of roughly 10%. But only one was a genuine crash, and the worst damage in 2008 was driven overwhelmingly by what was happening in credit markets, not by the price of crude.
The JPMorgan finding on median S&P 500 gains following historical oil shocks sits alongside a competing data set: every episode of crude crossing $100 in 2008, 2011, and 2022 produced 12-month returns well below the index’s long-run average, a divergence that underscores how much the surrounding macro context determines the outcome.
Over the six calendar years in which oil spent meaningful time above $100, the S&P 500 rose in three and fell in three.
That split record tells you something important: $100 oil is not a reliable predictor of equity direction. It is a headwind, not a verdict.
When big ASX news breaks, our subscribers know first
Why $100 today is not the $100 that haunts investors
The fear most investors carry around triple-digit oil traces directly back to the 1973-1974 embargo and the stagflation that followed. But the $100 of 2026 is not the same number in any economically meaningful sense.
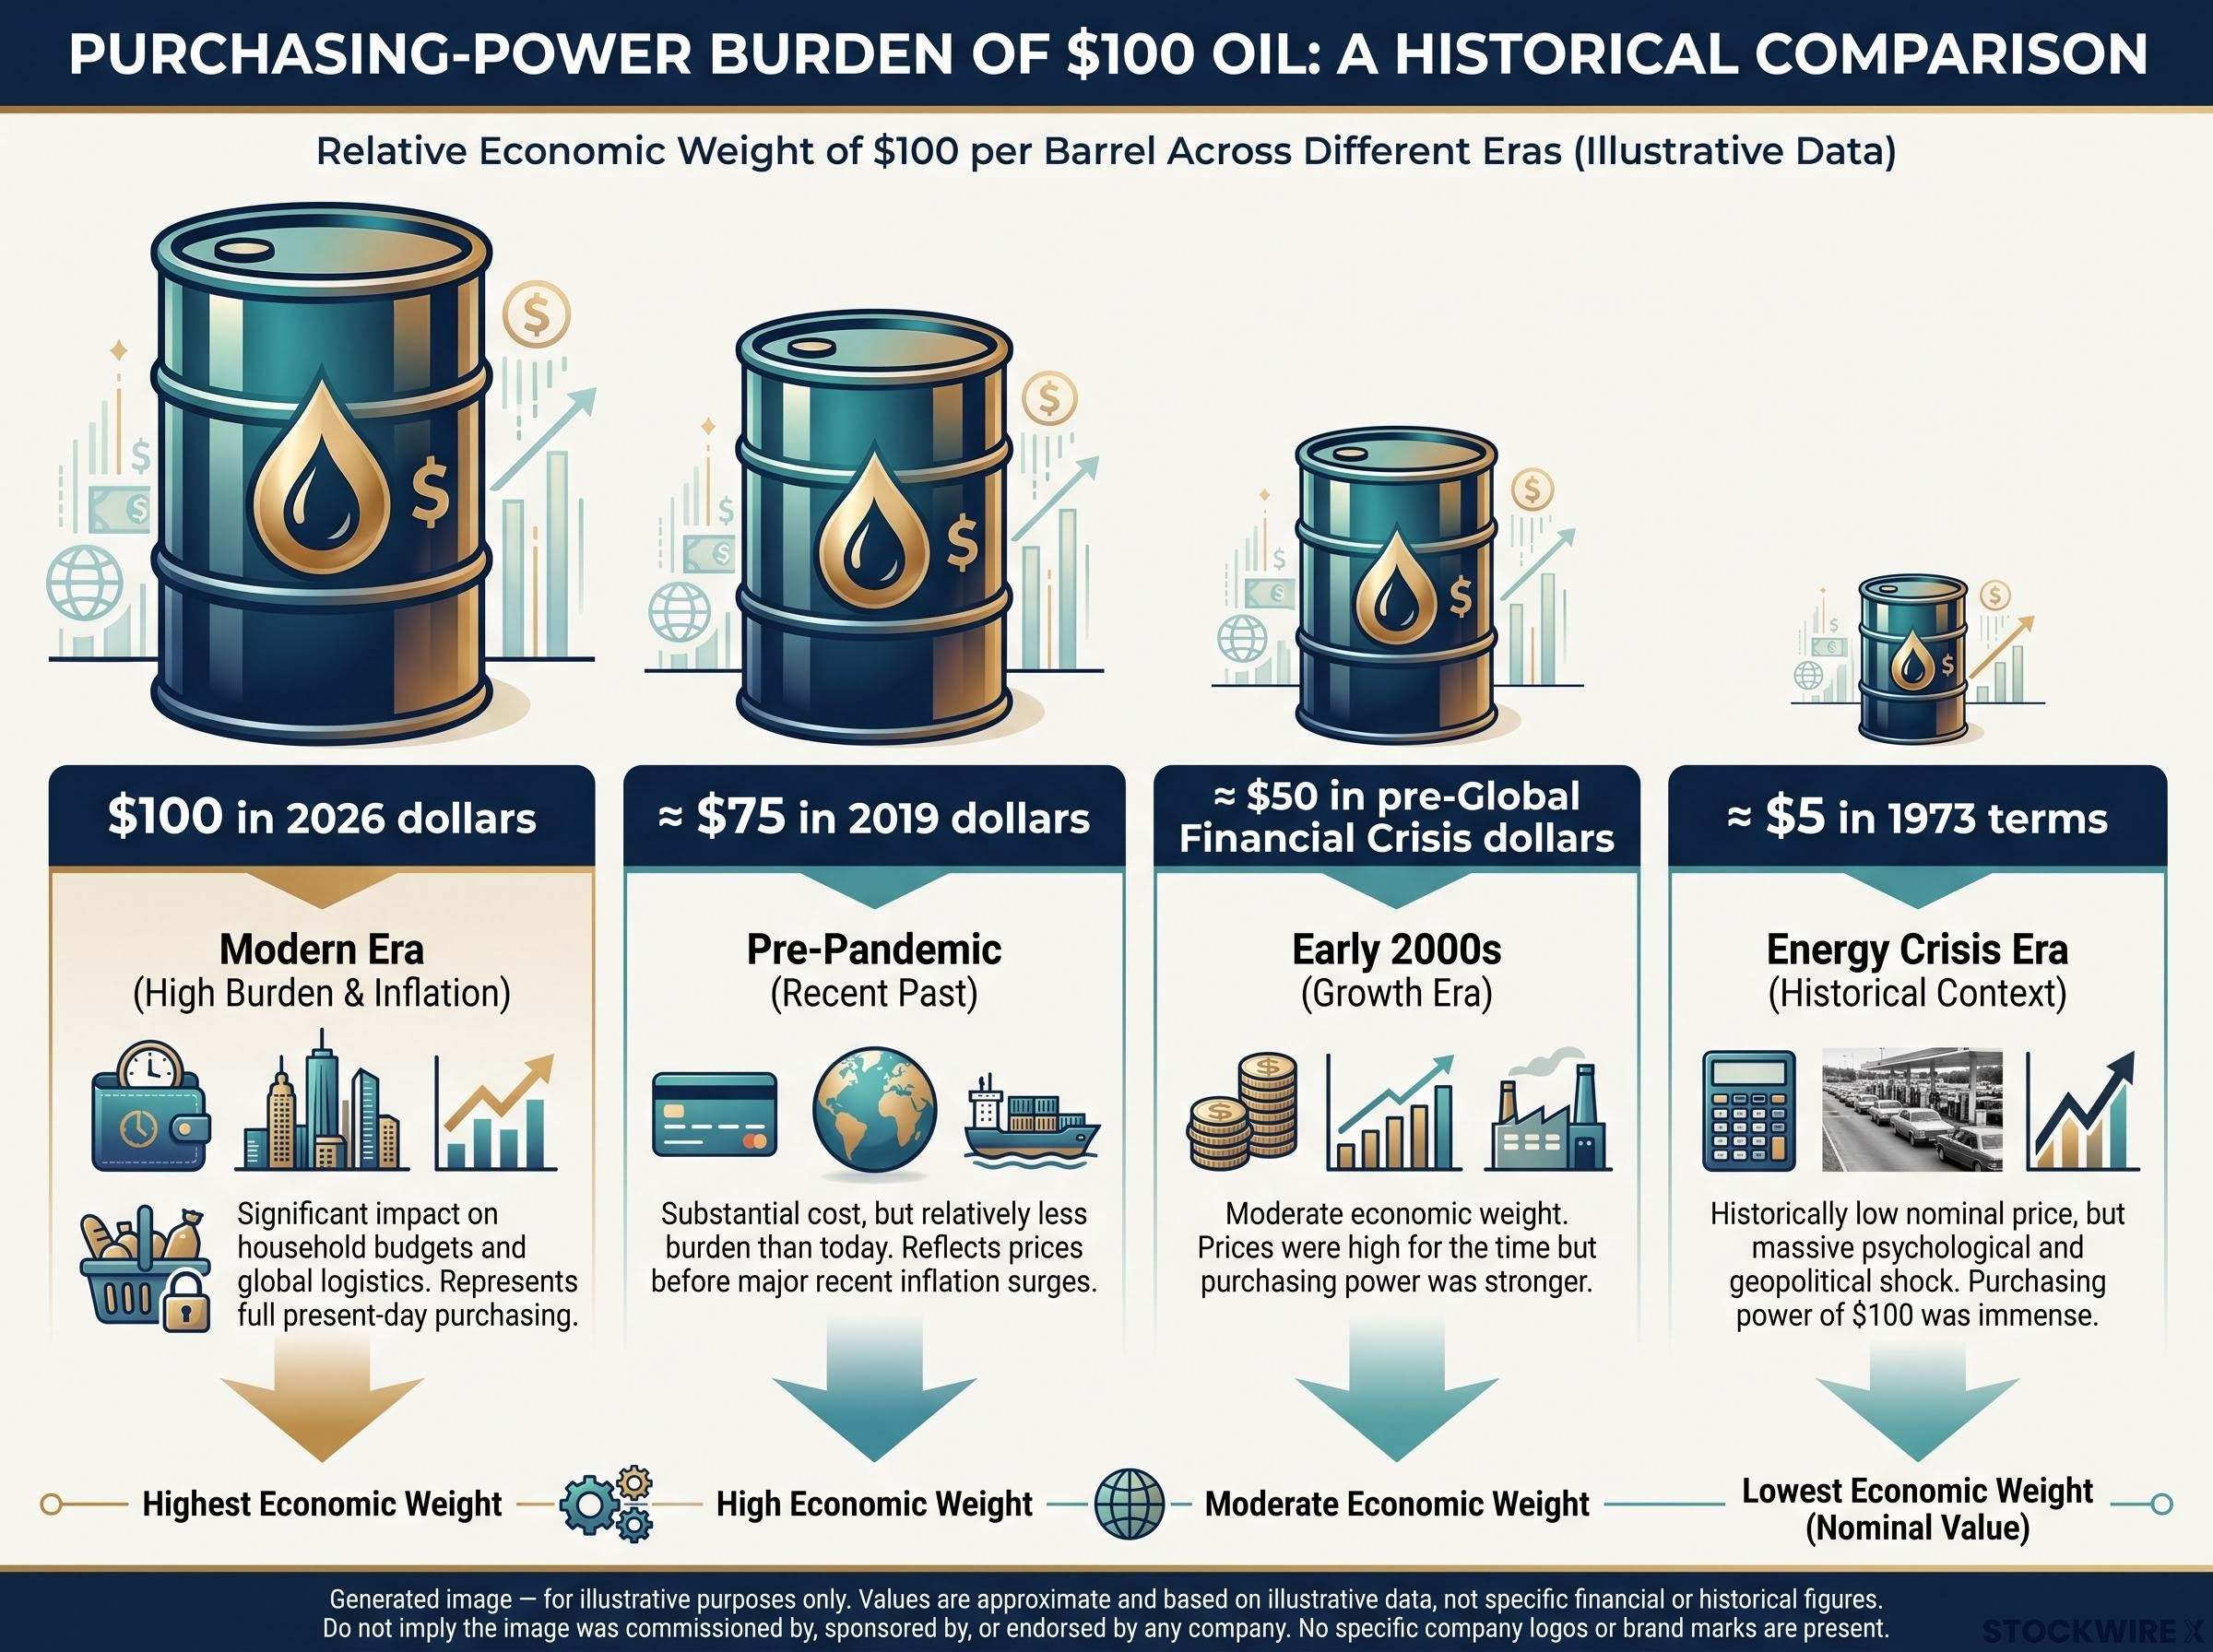
Adjusting for inflation puts the threshold in perspective:
- $100 in 2026 dollars ≈ $75 in 2019 dollars
- $100 in 2026 dollars ≈ approximately $50 in pre-Global Financial Crisis dollars
- By some estimates, $100 today carries roughly the macroeconomic burden of approximately $5 oil in 1973 terms, though that extreme comparison should be treated as directional rather than precise
The psychological power of the round number is real. The economic weight behind it has been shrinking for decades.
An economy that needs far less oil than it used to
The structural reason is straightforward. Compared with the 1970s, the US and EU economies today consume roughly two-thirds to three-quarters less oil per unit of GDP produced. More efficient engines, a larger share of services in total output, and accelerating electrification trends all mean that each dollar per barrel of crude price increase causes less economic damage than it did fifty years ago. The 1970s template is the wrong lens for a structurally lighter economy.
Columbia University’s oil intensity research quantifies the scale of this structural shift, finding that global oil intensity fell by 56% between 1973 and 2019, meaning the economy today generates substantially more output per barrel consumed than at any point during the era that shaped investor fears around triple-digit crude.
When high oil actually does become dangerous
None of this means oil price spikes are harmless. It means the damage depends on specific conditions, and understanding those conditions is the difference between a measured response and a panic.
The data distinguishes between oil as a headwind and oil as a crisis trigger. Six-month S&P 500 returns when oil was above $100 averaged approximately -6.9%, but roughly half of those periods were still positive. When oil was below $100, six-month returns averaged approximately +7%, with nearly 80% of periods positive. That is a distribution shift, not a cliff edge.
The genuinely destructive episodes share three features:
Supply-side constraints in the current episode carry a structural character that distinguishes it from several prior $100-oil periods: Saudi output fell to a 36-year low in April 2026, SPR releases failed to arrest inventory drawdowns running at 8.5 million barrels per day, and the IEA projected no rebalancing before October 2026, conditions that matter for assessing whether the current spike is brief or a sustained repricing.
- A large and sustained price move, not a brief spike
- Aggressive central bank tightening in response to the oil-driven inflation
- Pre-existing economic vulnerabilities, such as financial fragility, elevated inflation, or a credit bubble already under strain
The 1973-1974 episode remains the clearest case study: the S&P 500 fell approximately 48%, but the crash was tied to the oil embargo combined with stagflation and serious policy missteps. That combination of factors is not easily replicated in today’s less oil-intensive economy.
Some analysis suggests recession and major market-crash risk rises meaningfully only when oil approaches $150 to $200 per barrel and stays there, though that threshold should be treated as a directional reference rather than a precise trigger.
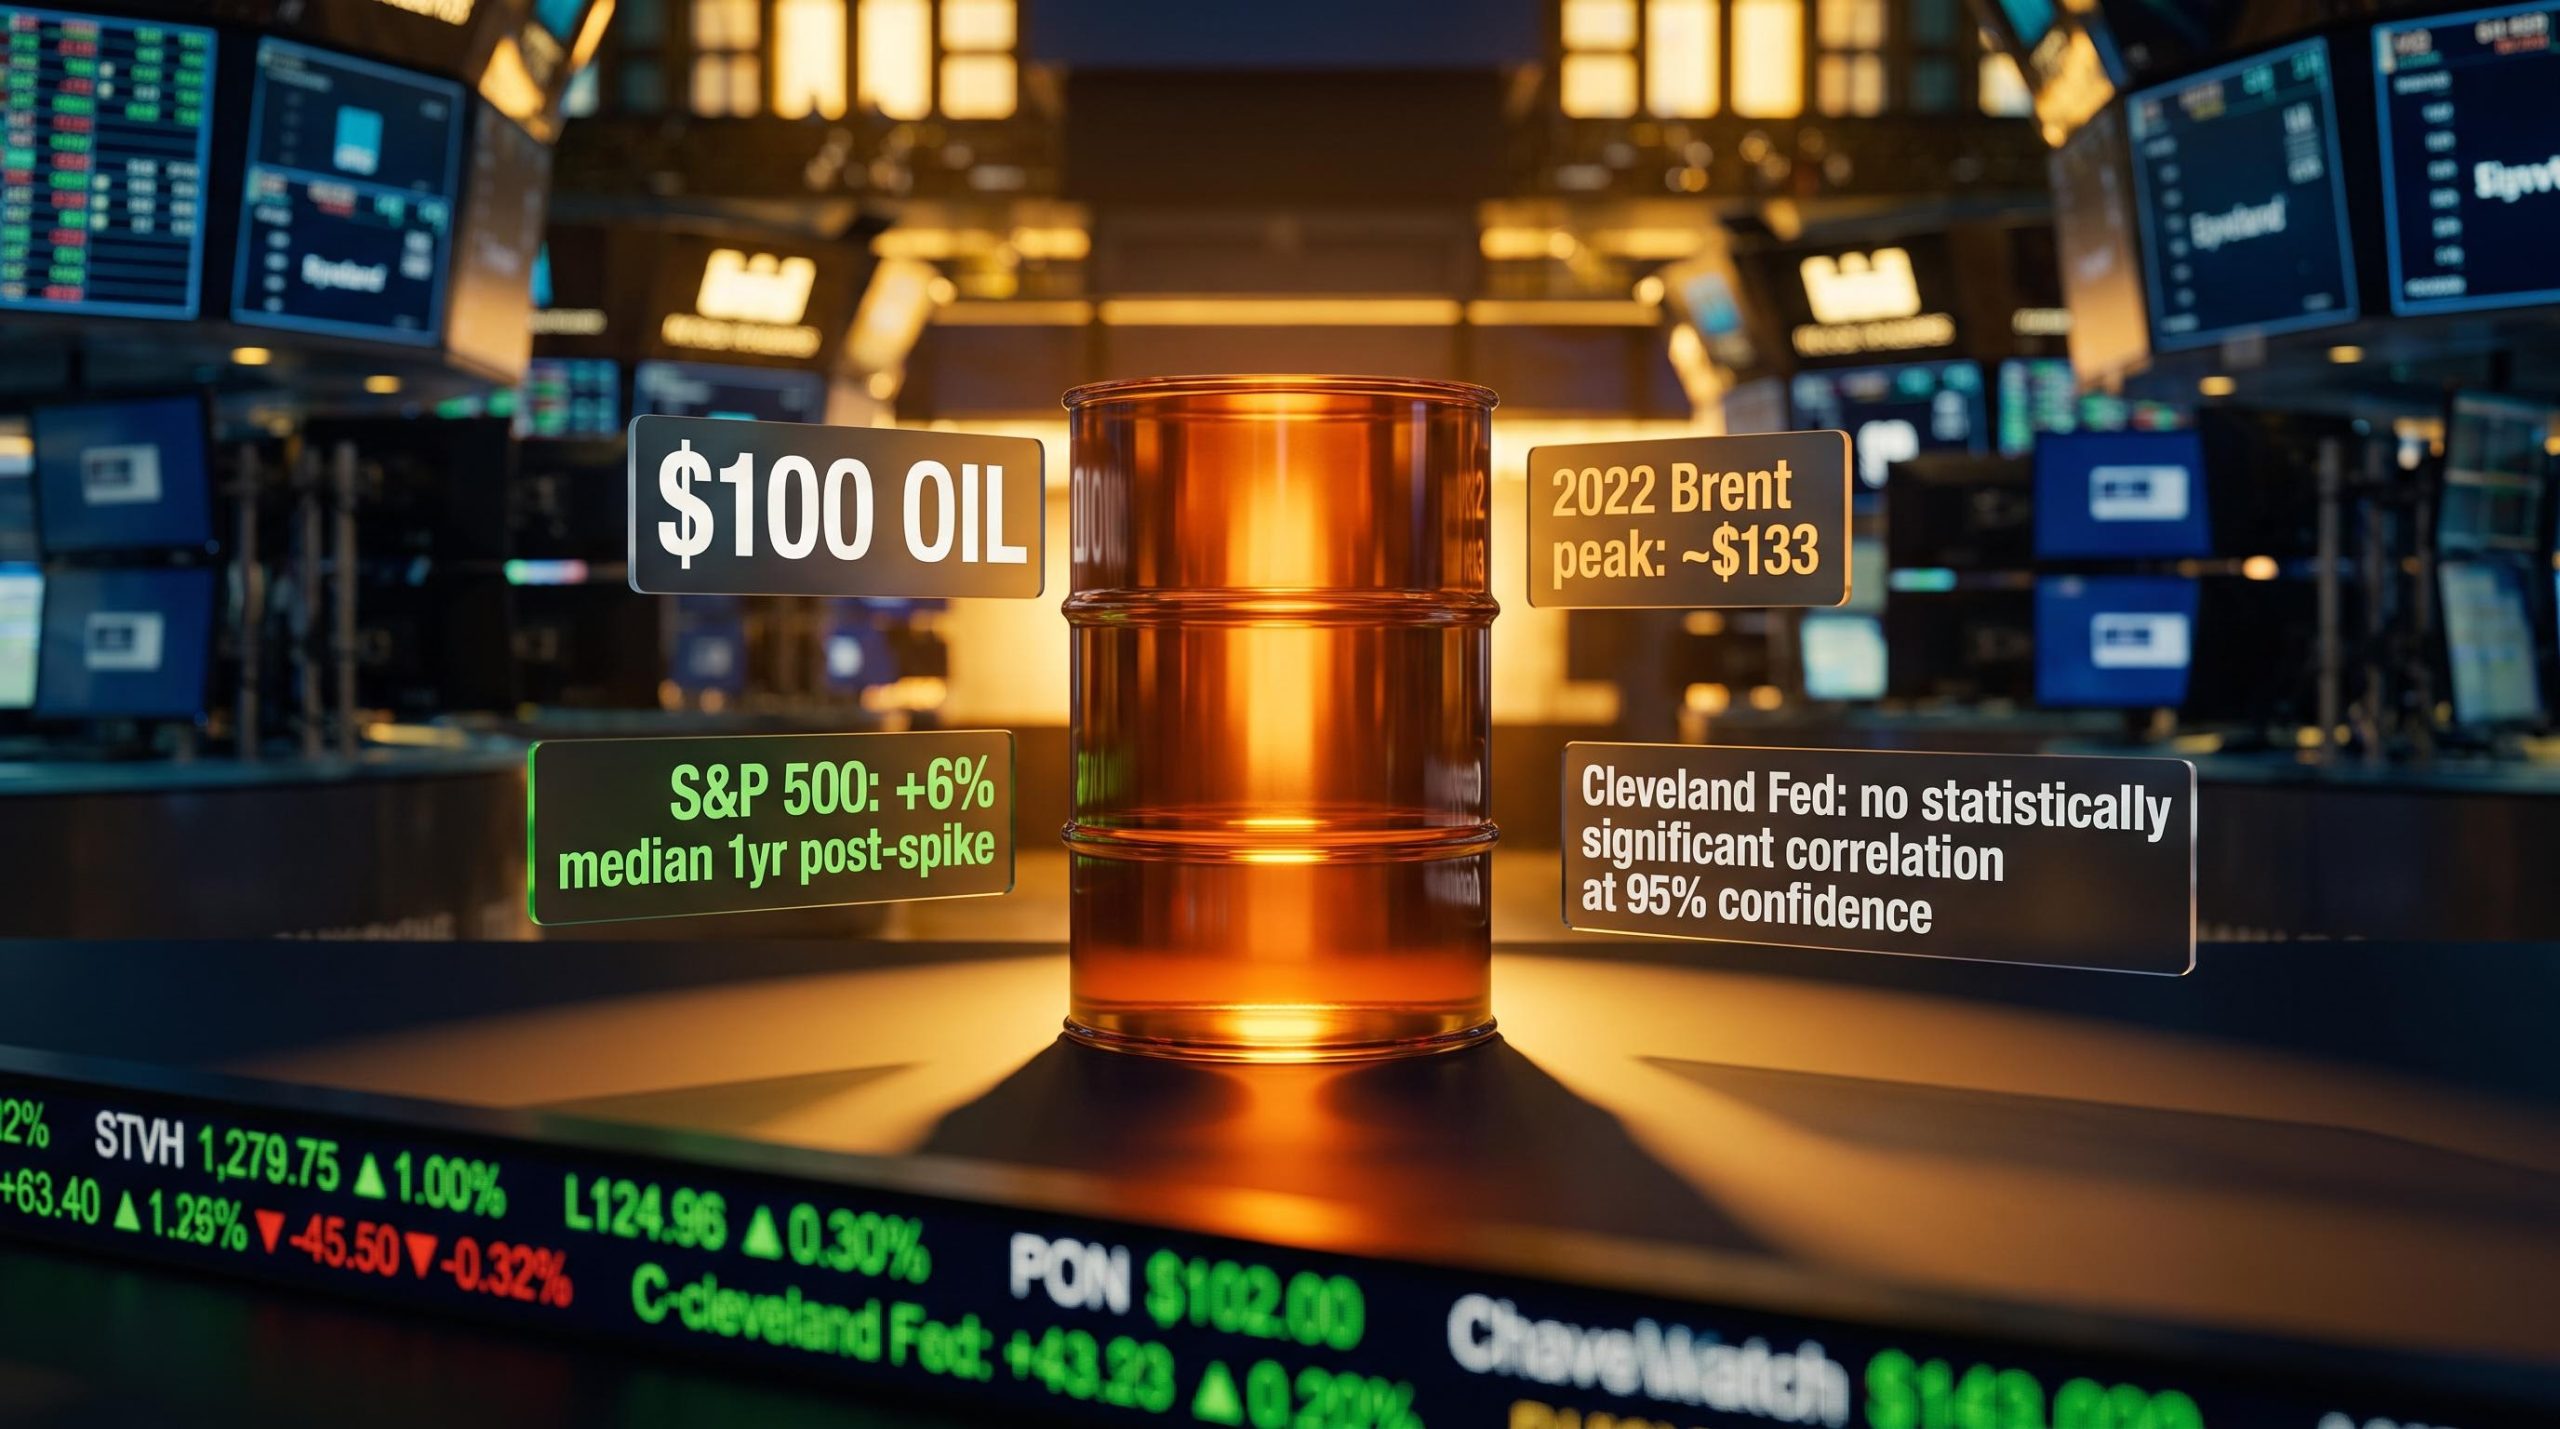
A Federal Reserve Bank of Cleveland study found no statistically significant correlation between oil prices and broad stock indices at the 95% confidence level.
That finding is the single most important data point in this discussion. Oil is one macro variable among many. Treating it as a standalone predictor of market direction is a systematic analytical error, and it is the error most investors make when crude crosses a round number.
How conflict-driven oil shocks play out across markets over time
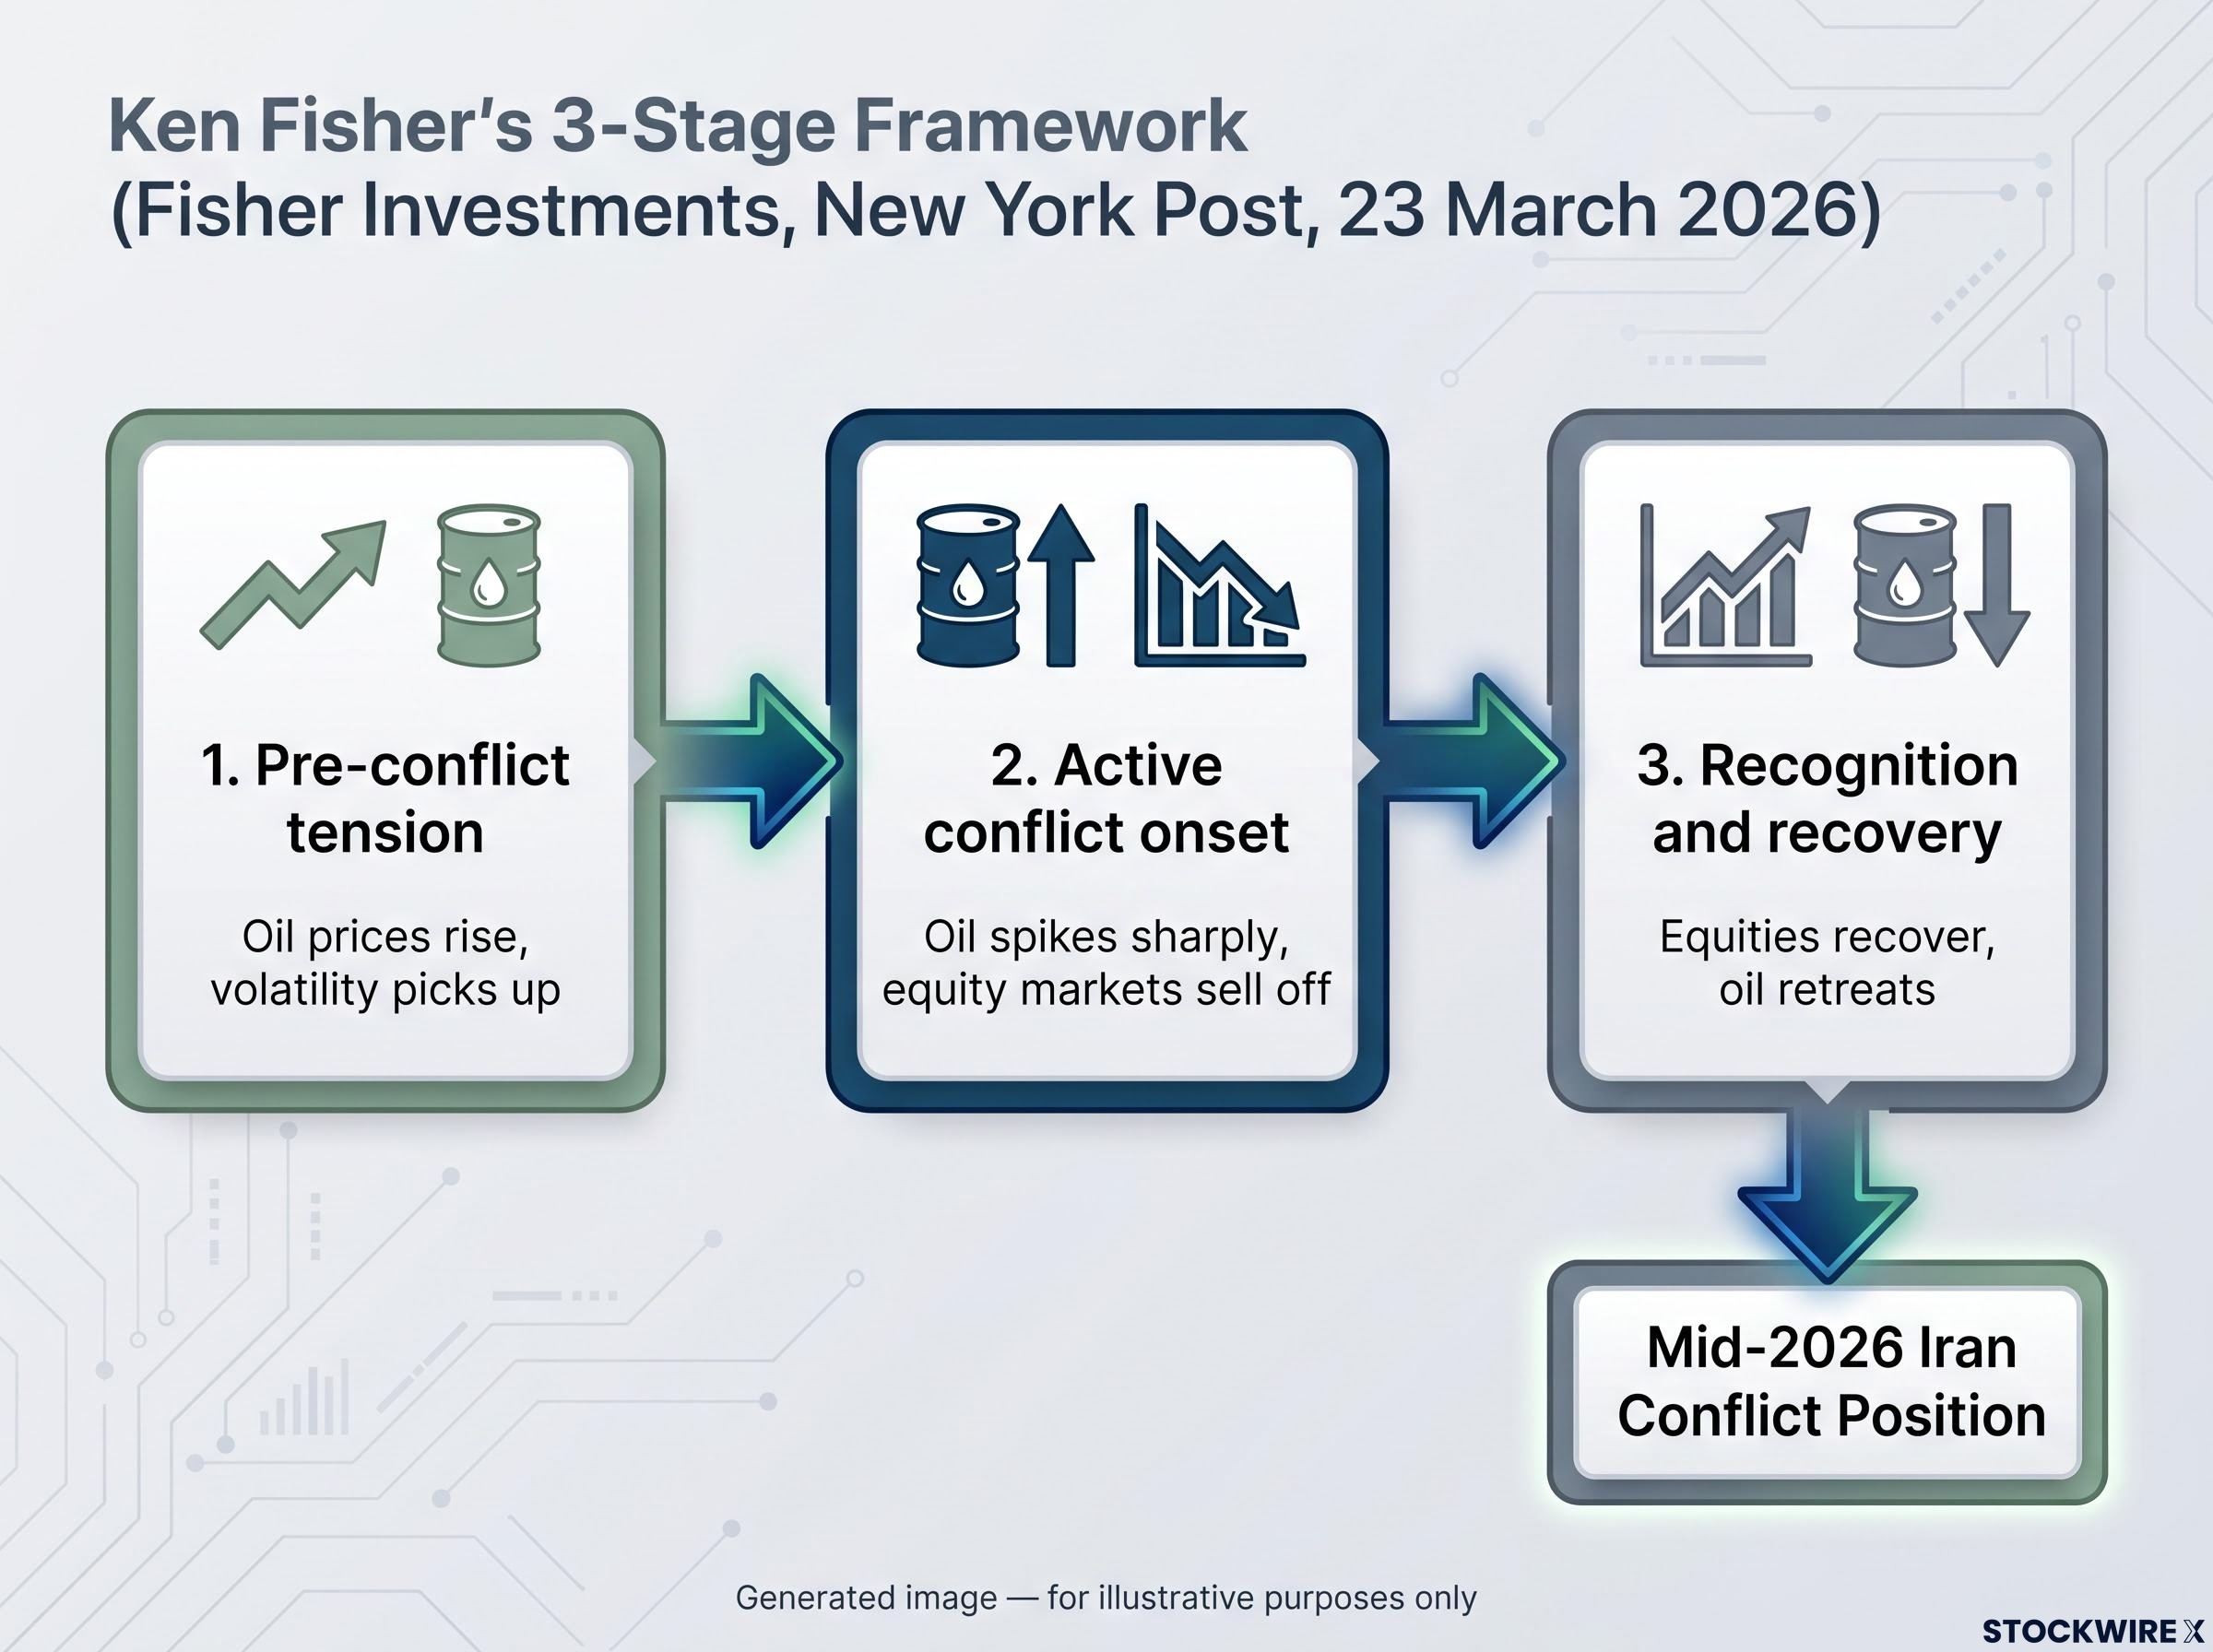
Ken Fisher, founder and Executive Chairman of Fisher Investments, described a three-stage sequence through which equity markets tend to move during energy-focused conflicts (originally published in the New York Post, 23 March 2026). Understanding the sequence is useful because it gives investors a framework for locating where the current situation sits relative to where it is likely heading.
- Pre-conflict tension: As geopolitical friction builds ahead of open conflict, oil prices begin rising and market volatility picks up. The uncertainty itself drives the initial price moves.
- Active conflict onset: Once fighting breaks out, investors reprice for worst-case scenarios. Oil spikes sharply and equity markets sell off. Fear is at its highest point.
- Recognition and recovery: Over time, markets absorb the reality that regional conflict carries limited and temporary economic consequences. Equities begin to recover and oil retreats, often well before hostilities end.
Where the Iran conflict fits in the pattern today
By mid-2026, the Iran conflict’s ability to move global stock markets has been visibly fading with each new development. Each fresh ceasefire breakdown has had a smaller market impact than the last, which reflects the well-established principle that markets react most strongly to genuine surprises, and the pattern of intermittent fighting has become broadly anticipated by participants. That diminishing reaction is itself a signal: it is consistent with the third stage of Fisher’s framework, the recognition and recovery phase. If you are still pricing in worst-case oil scenarios, you may be a stage behind where markets actually are.
Not all stocks feel $100 oil the same way
The phrase “oil hurts stocks” collapses a complicated reality into a misleading headline. The equity market contains both oil losers and oil winners, and the aggregate index effect masks divergent sector movements that change the risk calculus for a diversified portfolio.
| Sector Category | Typical Response to $100 Oil | Why |
|---|---|---|
| Energy Producers | Positive | Higher crude prices flow directly to revenue and margins |
| Transport / Fuel-Intensive | Negative | Fuel is a major input cost with limited short-term pass-through |
| Broad Market (S&P 500) | Weakly negative on average | Aggregate effect nets out sector divergence; context-dependent |
Analysis of past episodes suggests that large energy names including ExxonMobil, Chevron, ConocoPhillips, Occidental, and Enbridge tended to rise each time crude topped $100, with some, notably Occidental, posting gains above 50% in certain episodes.
Energy equities as inflation hedge instruments have gained renewed analytical attention in the current episode: NBER research associates an oil inflation shock with a 4.0 percent increase in energy sector returns, and many integrated majors entered 2026 budgeted around $75-$80 oil, meaning sustained prices above $95 generate free cash flow upgrades absent from pre-conflict consensus estimates.
A JPMorgan study of episodes since 1974 when oil prices jumped more than 100% found the S&P 500 posted a median gain of approximately 6% one year later, though this finding should be treated as one data point rather than a definitive pattern.
That post-spike recovery pattern, combined with analysis suggesting shock-driven oil spikes have historically shown mean reversion within approximately 4 to 5 months, points to a practical reality: a diversified portfolio with energy exposure already contains a partial natural hedge against oil price spikes. The risk calculus changes when you stop looking at the index-level headline and start looking at what is happening underneath it.
What the evidence actually demands from investors right now
The core distinction is worth stating plainly: $100 oil is a headwind, not an automatic crisis signal, and the difference matters enormously for whether de-risking is the right response.
Three diagnostic questions separate a manageable headwind from a genuine threat:
- How large and sustained is the oil move? A spike that mean-reverts in a few months carries different implications than a structural repricing that holds for a year.
- What is the central bank doing in response? Aggressive tightening in response to oil-driven inflation is historically where the real damage comes from, not from the oil price alone.
- Are there pre-existing financial or macro vulnerabilities? Credit stress, financial fragility, or an economy already at the edge of recession amplify the shock. A healthy economy absorbs it.
The Cleveland Fed’s finding, that oil’s long-run correlation with stock returns is not statistically significant at the 95% confidence level, reinforces a straightforward conclusion: treating $100 as a mechanical sell signal is exactly the kind of fear-driven, poorly timed decision the evidence suggests investors have historically made and then regretted. Round numbers attract disproportionate attention. The 1970s experience still anchors expectations in ways that no longer match a less oil-intensive economy.
For investors wanting to stress-test their portfolios against more severe oil outcomes, our full explainer on Brent $120 as a planning scenario covers Goldman Sachs’s base-case Q4 2026 estimate, Hormuz flow data, and the specific bypass infrastructure constraints that make rapid supply normalisation structurally difficult.
This article is for informational purposes only and should not be considered financial advice. Investors should conduct their own research and consult with financial professionals before making investment decisions. Past performance does not guarantee future results.
The gap between what $100 oil signals and what it delivers
The psychological threat of the $100 threshold has historically been larger than the realised economic damage it actually delivers. That gap, between what the number signals and what it does, is where most investor mistakes happen.
Oil is a genuine macro variable that warrants monitoring. The evidence does not dismiss the risk; it calibrates it. Inflation-adjusted, $100 carries roughly three-quarters of the real economic weight it did just seven years ago. The US economy needs far less oil per unit of output than it did when the 1970s experience burned the $100 fear into investor memory. And Fisher’s three-stage conflict framework suggests that markets pricing in the current Iran situation have already moved past peak fear.
Knowing the difference between a headwind and a crisis is a practical skill. The evidence exists to develop it. The question is whether investors will use it, or whether the round number wins again.
—