Switzerland has a population smaller than London’s, yet it is home to several of the largest listed companies in Europe by market capitalisation. Nestlé, Roche, and Novartis alone carry more combined market value than the entire listed equity markets of most European nations. And here is the detail that reshapes how you think about them: the majority of their revenues come from outside Switzerland, making them global businesses that happen to list in Zurich.
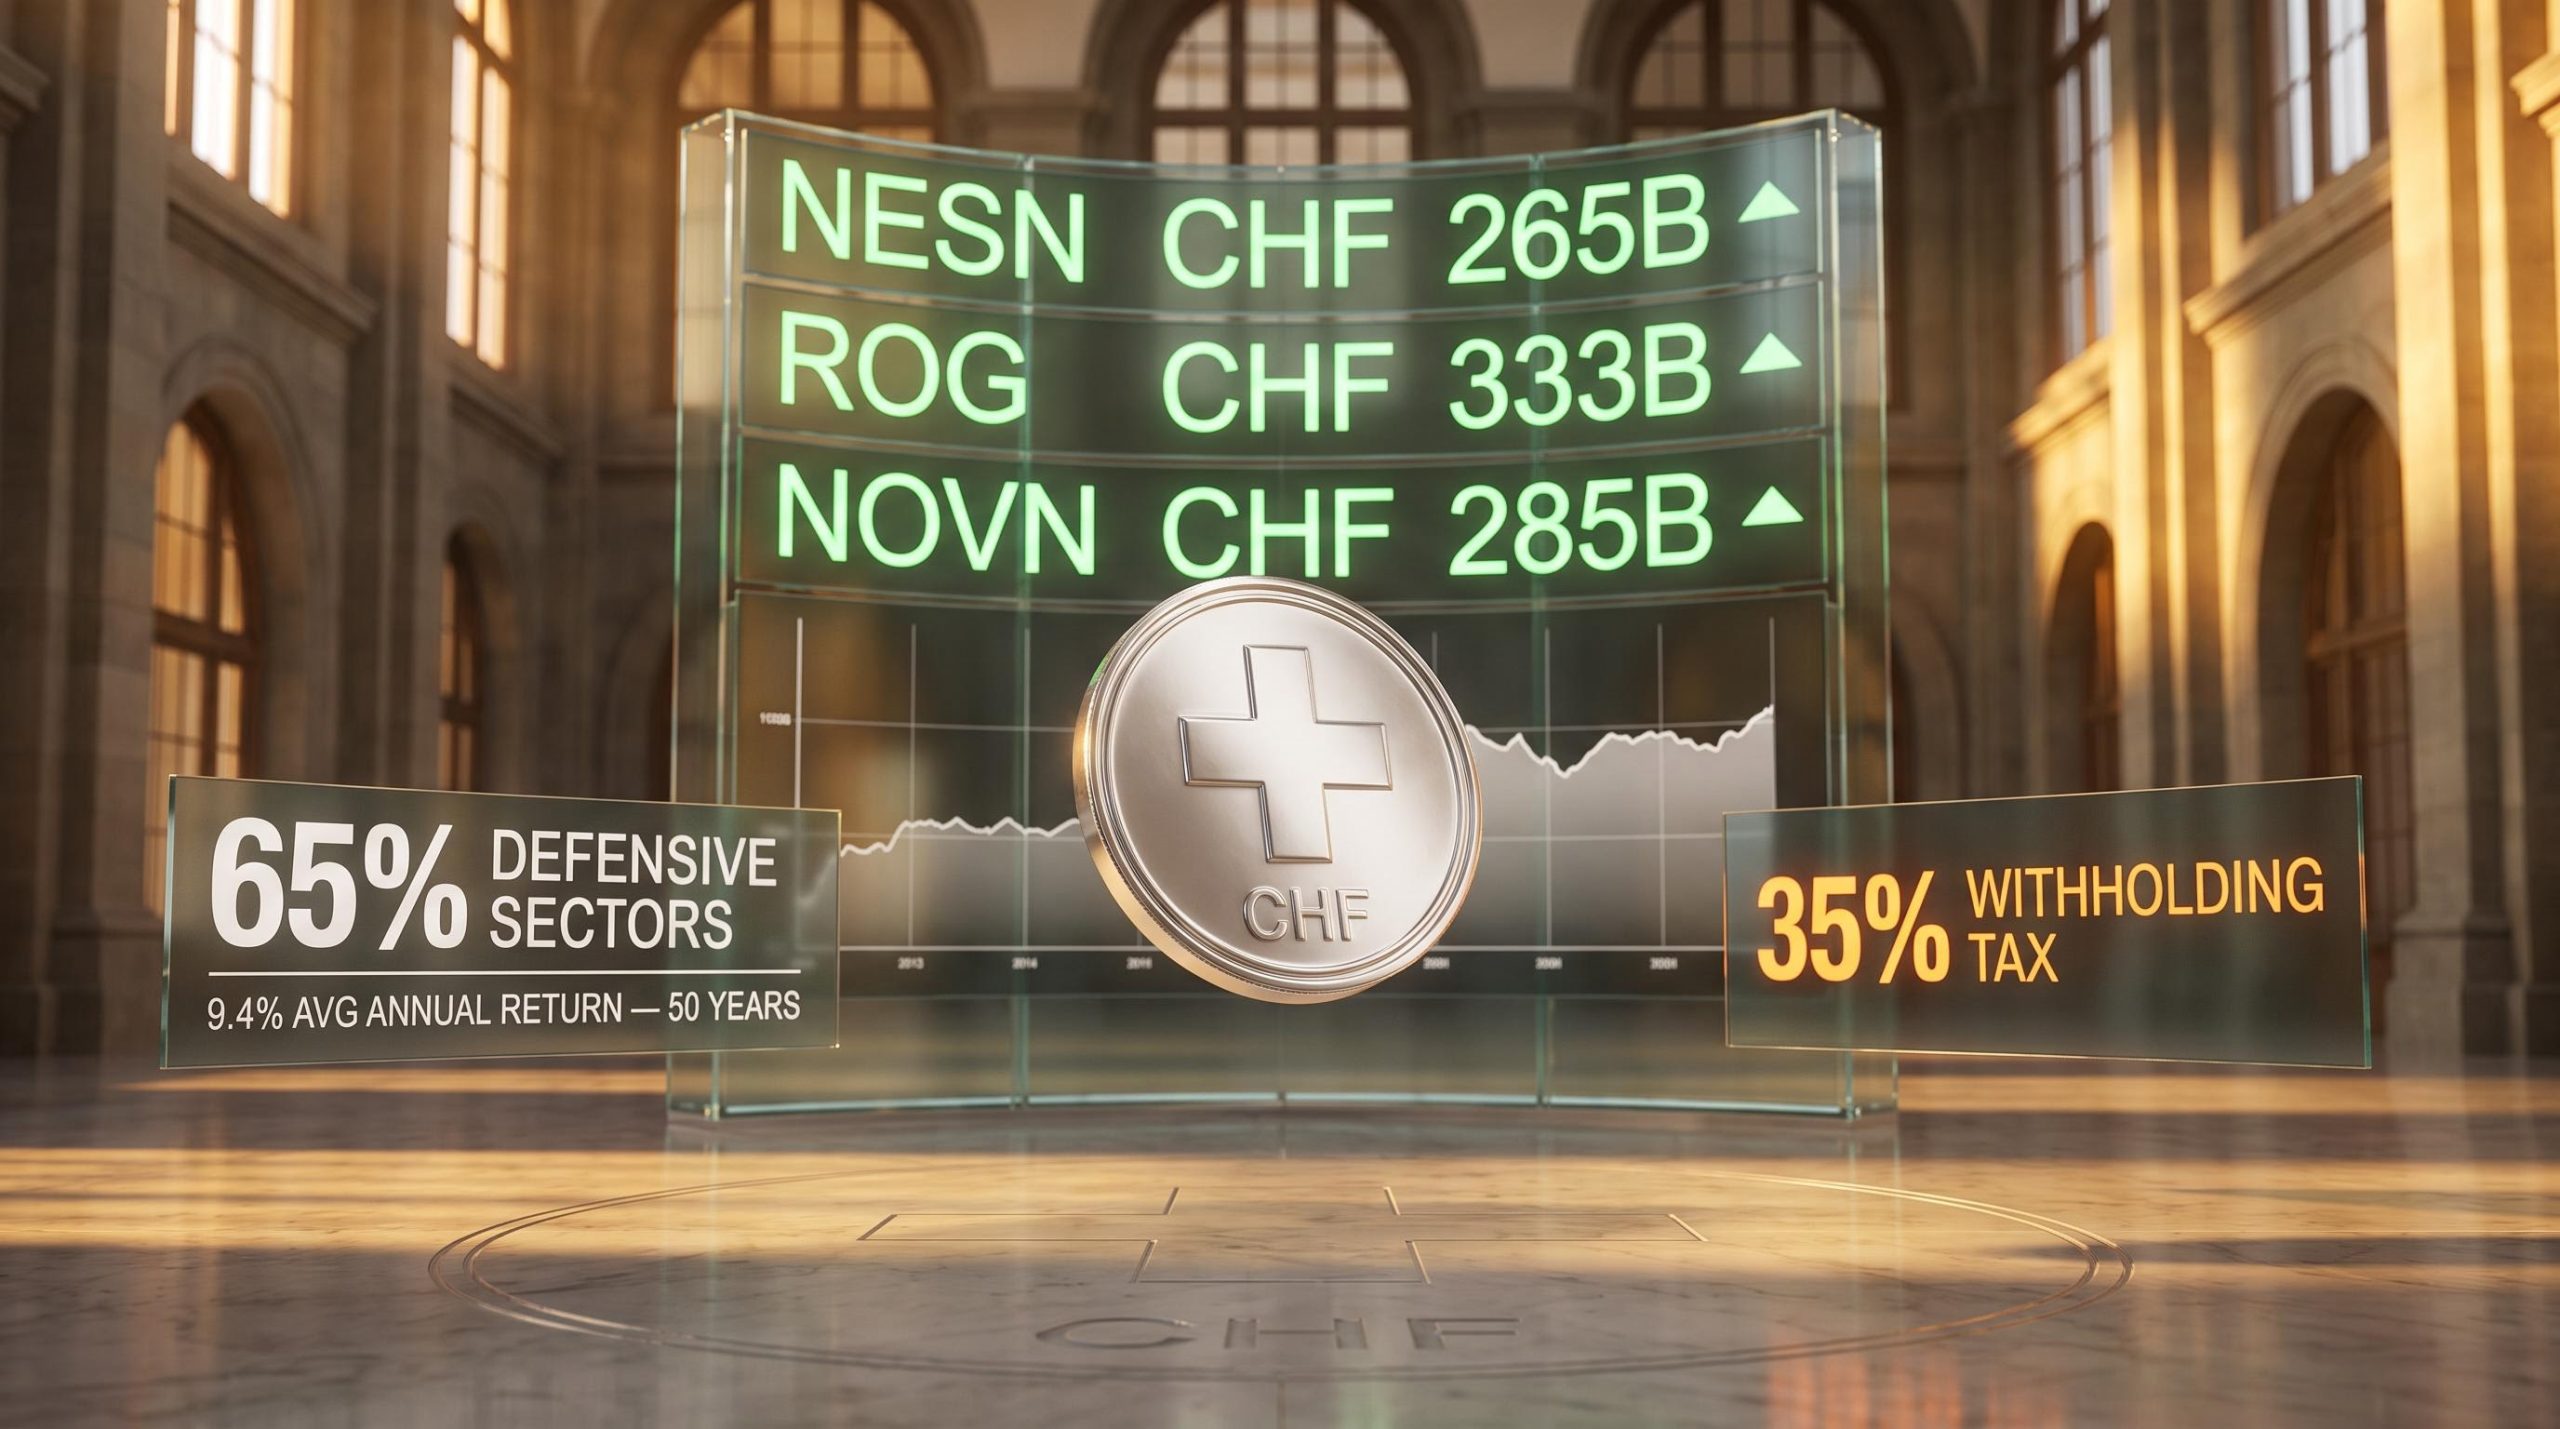
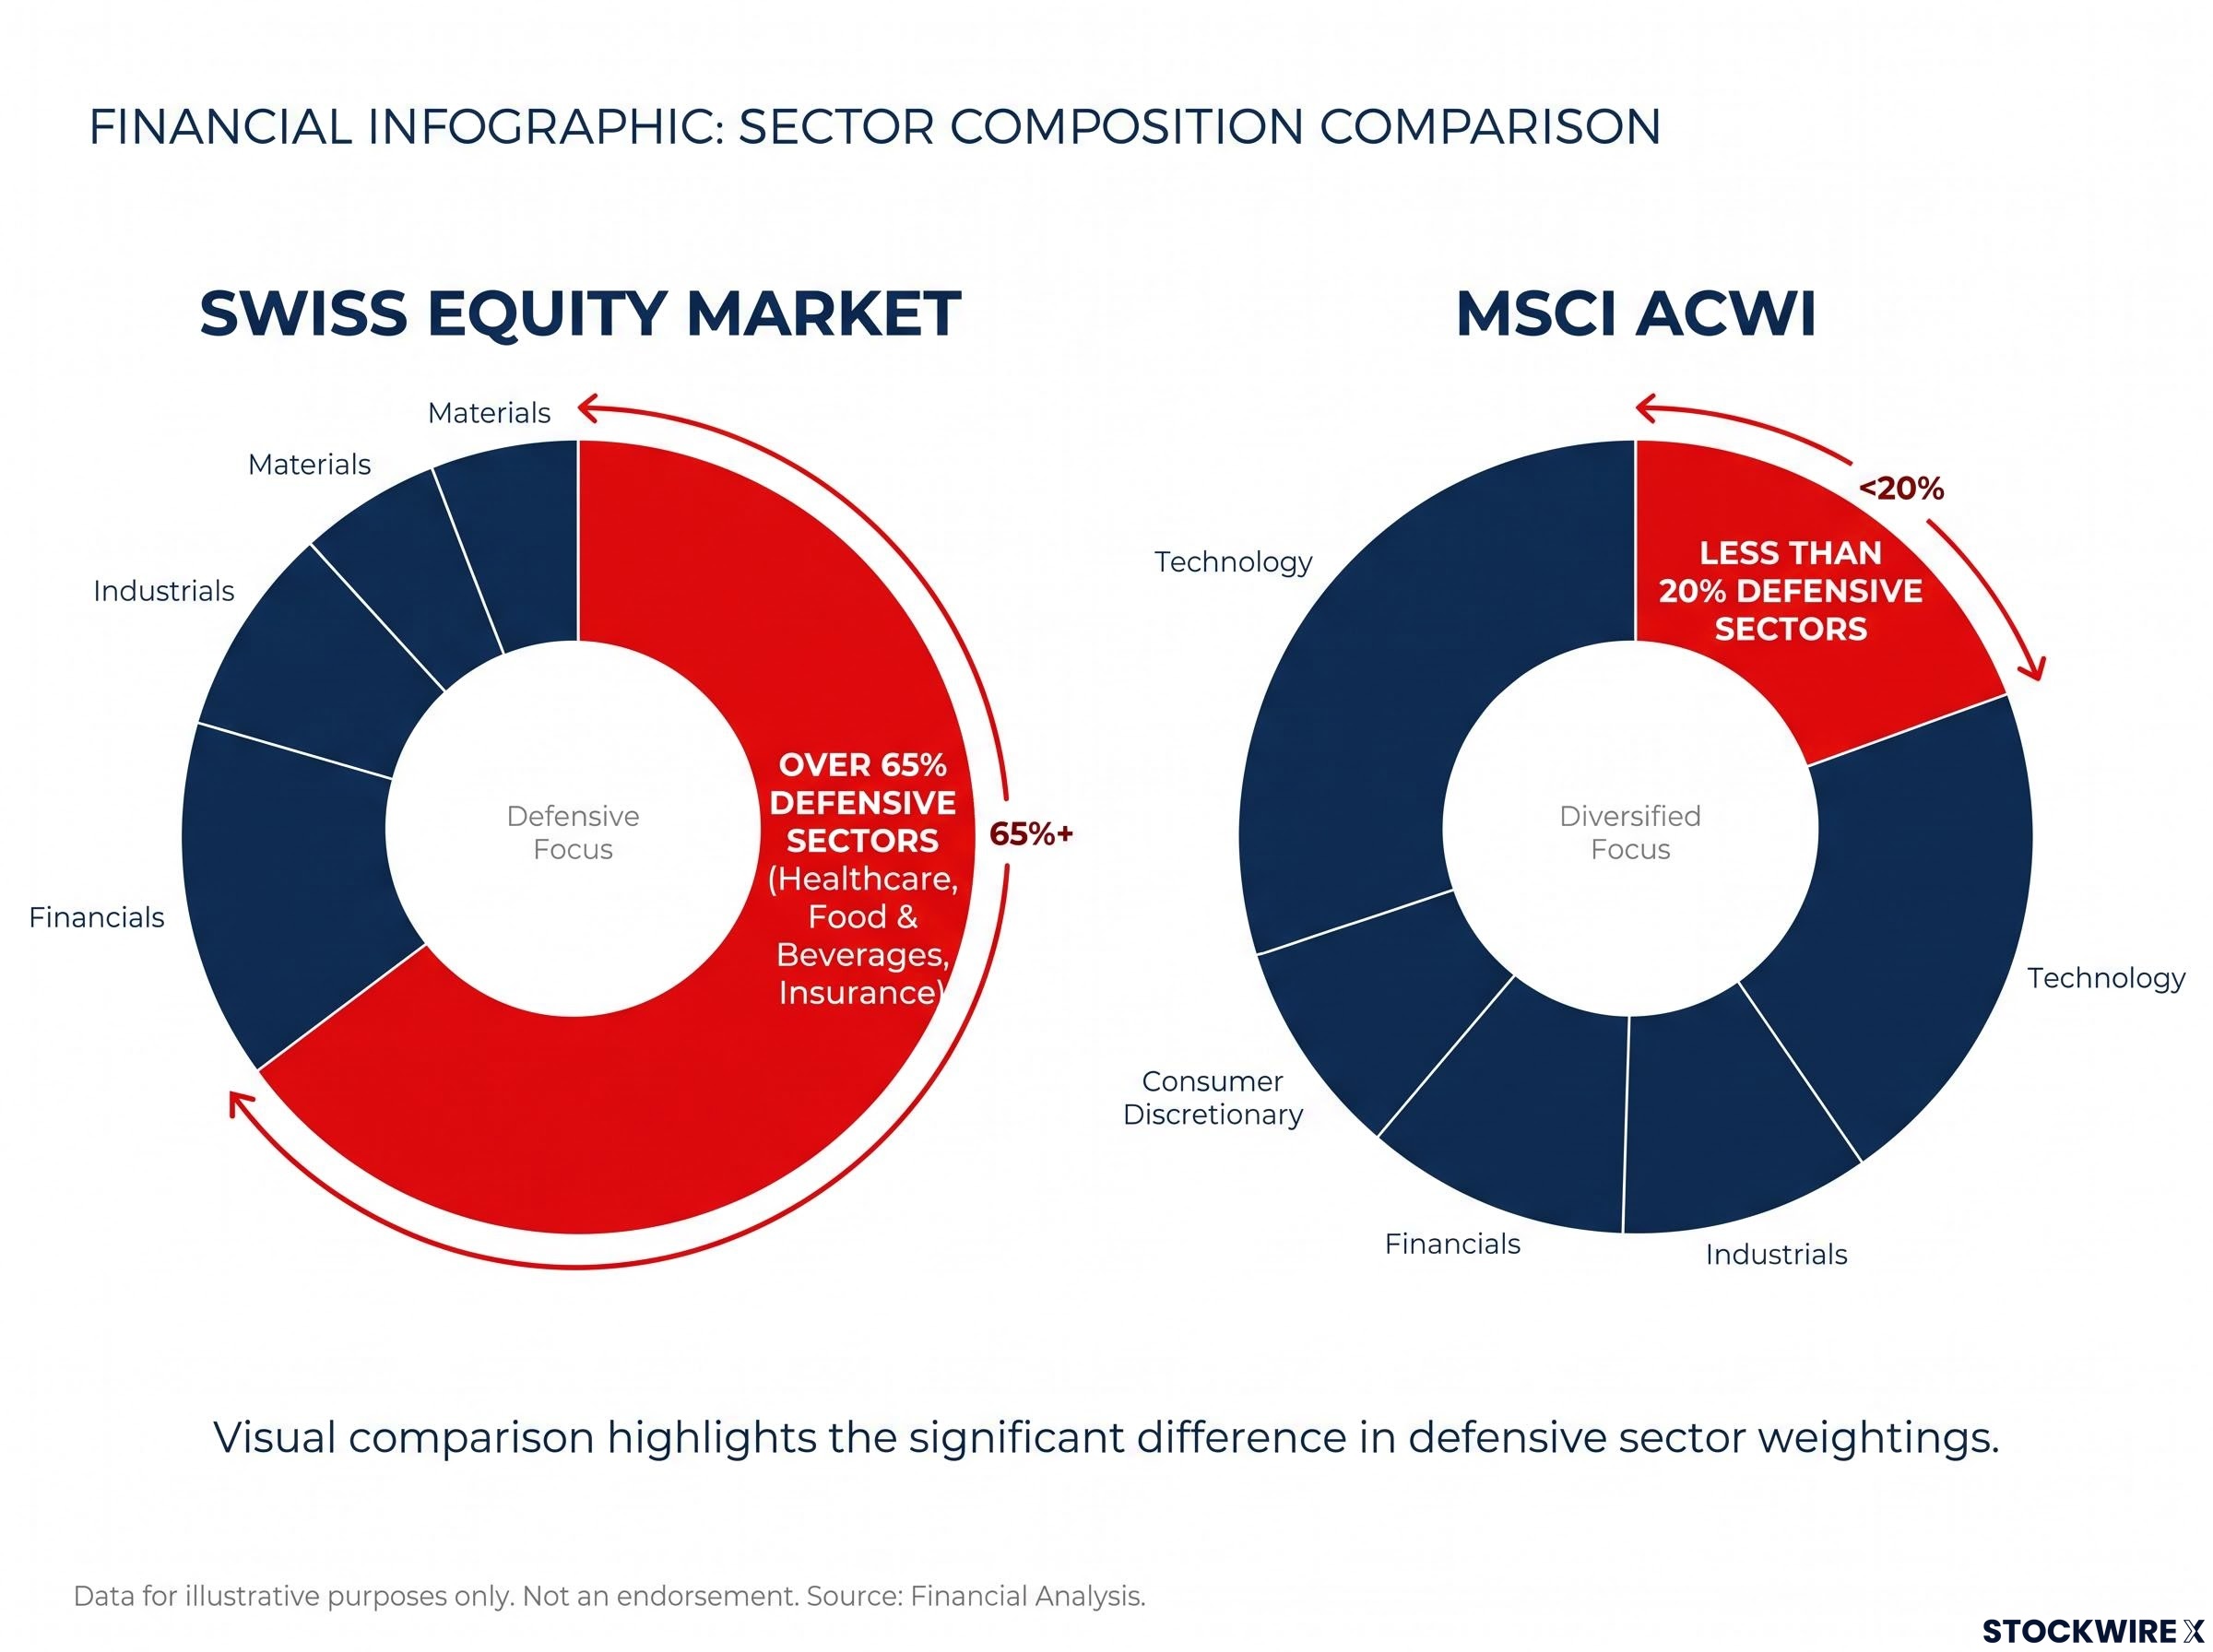
That matters right now. The Swiss Market Index hit record highs during 2026, at a moment when retail investors globally are rethinking how much of their portfolio sits in technology-heavy benchmarks. Switzerland’s equity market carries over 65% weighting in defensive sectors, compared with less than 20% in the MSCI ACWI. That is not a marginal difference. It is a structurally different portfolio composition.
Here is what this guide covers: the companies that define Swiss blue-chip investing, how the main index works (and the concentration trade-off embedded in it), the diversification case, the specific risks, and the withholding tax mechanics that affect the cash you actually receive from Swiss dividends. By the end, you will know whether a Swiss allocation fits your portfolio, and what to check before committing capital.
What makes the Swiss equity market structurally different
Most investors bucket Switzerland with the rest of Europe. That is a mistake. The Swiss equity market behaves differently from virtually every other developed market because of what it holds and where its constituent companies earn their money.
Swiss blue chips generate the majority of their revenues outside Switzerland. When you buy an SMI tracker, you are not making a bet on the Swiss domestic economy. You are buying a basket of globally dominant franchises, denominated in Swiss francs, with defensive sector characteristics that look nothing like a typical global index.
The structural distinctions worth understanding:
The mechanics behind defensive sector allocation matter for understanding why over 65% of the Swiss market in healthcare, staples, and insurance behaves differently from cyclical-heavy benchmarks: defensive sectors serve essential demand regardless of where the economy sits in the cycle, which is the source of their low correlation to growth-driven indices.
- Defensive sector dominance: Over 65% of the Swiss equity market sits in healthcare, food and beverages, and insurance, compared with less than 20% in the MSCI ACWI
- Global revenue generation: Flagship companies earn the bulk of their income internationally, giving you worldwide economic exposure through a single market
- Institutional stability: Switzerland’s deep-rooted commitment to political neutrality, disciplined public finances, and strong record of innovation output together underpin its appeal to long-term capital
- Innovation intensity: Continuous high levels of research and development spending in pharmaceuticals, biotechnology, and precision engineering have enabled companies in these fields to build enduring global leadership positions
Over 65% of the Swiss equity market is weighted toward defensive sectors, compared with less than 20% in the MSCI ACWI. That is the single largest structural gap between Switzerland and the global benchmark.
Over roughly 50 years, Swiss equities have delivered average annual returns of approximately 9.4%, nearly matching US equities at approximately 9.6%. The near-parity in long-term returns, combined with a far more defensive sector mix, tells you that Switzerland has delivered roughly equivalent wealth-building power with a smoother ride. That distinction is the core of its diversification case.
When big ASX news breaks, our subscribers know first
The companies that define the Swiss market
Seven companies anchor the Swiss blue-chip universe, and the sectoral spread across them is wider than most investors expect. You are not buying a healthcare-only market. You are buying six distinct economic drivers through a single geography.
Roche, with an approximate market capitalisation of $333 billion in mid-2026, and Nestlé at approximately $265 billion, rank among Europe’s largest publicly listed businesses. Both generate the overwhelming majority of their revenues outside Switzerland: Roche through global oncology and diagnostics demand, Nestlé through worldwide consumer spending on food, coffee, and pet care.
Novartis adds a second pharmaceutical heavyweight with deep exposure to immunology and advanced therapies. After absorbing Credit Suisse, UBS now stands as Switzerland’s pre-eminent bank and a major force in global wealth management. Richemont brings concentrated exposure to the high-end luxury segment through its ownership of Cartier and Van Cleef & Arpels. ABB broadens the mix into industrial automation and electrification. Zurich Insurance rounds out the defensive income profile with a consistent dividend track record.
| Company | SIX Ticker | Sector | Global Role |
|---|---|---|---|
| Nestlé | NESN | Food & Beverages | World’s largest food company |
| Roche | ROG | Pharmaceuticals | Global leader in oncology and diagnostics |
| Novartis | NOVN | Pharmaceuticals | Major immunology and advanced therapies franchise |
| UBS | UBSG | Banking & Wealth Management | Largest Swiss bank, global wealth manager |
| Richemont | CFR | Luxury Goods | Owner of Cartier and Van Cleef & Arpels |
| ABB | ABBN | Industrial Automation | Global electrification and automation leader |
| Zurich Insurance | ZURN | Insurance | One of the world’s largest insurers |
That spread, healthcare, staples, luxury, banking, industrials, and insurance, means a Swiss blue-chip allocation gives you exposure to six distinct economic drivers, not a concentrated bet on any one.
How the Swiss Market Index works, and what concentration means for you
The Swiss Market Index (SMI) is structured around the 20 most capitalised and actively traded companies on the SIX Swiss Exchange. It is designed to be UCITS-compliant and easily replicable, which is why it serves as the default access route for most passive investors.
The SMI’s 20 names represent the large majority of Swiss equity market capitalisation. Sources vary on the precise figure: some cite above 90% of total market capitalisation, while others cite approximately 70-85% of free-float adjusted market capitalisation. The difference reflects measurement methodology rather than a factual dispute. What is not in question is that the Swiss listed market is heavily top-weighted.
That top-heaviness is the concentration issue you need to price in. The index’s three dominant names, Nestlé, Roche, and Novartis, each carry enough individual weight that their fortunes can shift the entire benchmark. Purchasing an SMI ETF in the belief that you hold a broadly spread Swiss portfolio overlooks the reality that a handful of businesses account for an outsized portion of your exposure. A single earnings miss from Roche, or a strategic misstep from Nestlé, moves the entire index. That is a feature to understand, not an oversight to ignore.
Beyond the SMI: broader exposure options
If that concentration does not suit your portfolio, three alternatives widen the aperture:
- Swiss Performance Index (SPI): Covers the total Swiss listed market, including small and mid-cap names, giving you the broadest Swiss equity exposure available
- Swiss Market Index Mid (SMIM): Focuses on the 30 largest mid-cap stocks, capturing the companies below the SMI’s 20 blue chips
- Direct holdings via international broker: Allows you to select specific Swiss names without inheriting the index’s concentration weighting, though this requires more active management
Why Swiss blue chips reduce concentration risk in a global portfolio
The diversification case for Swiss equities builds from three layers, each compounding the one before it.
The first layer is sector composition. When technology sells off, as it periodically does with force, portfolios concentrated in the MSCI ACWI or the S&P 500 absorb that drawdown fully. A Swiss allocation weighted over 65% toward defensives, healthcare, staples, and insurance, historically performs differently during those corrections. Swiss equities do not move in lockstep with technology-driven benchmarks, and that low correlation is precisely what diversification requires.
The second layer is currency. Major Swiss multinationals carry CHF-denominated reporting while their revenues span the globe, meaning the equity comes bundled with a currency that has historically acted as a refuge in uncertain markets. When global stress has risen, the CHF has tended to firm against the euro and the US dollar, which has generally worked in favour of investors holding from outside Switzerland. That currency layer works on top of, not instead of, the equity return.
The third layer is the honest counterpoint. Swiss equities underperformed the MSCI World over the past decade, largely because global indices benefited from technology sector strength that Switzerland lacks. That underperformance is not a reason to avoid Swiss equities; it confirms their role. They are the allocation that held its ground while tech soared, and they are the allocation that will matter when tech corrects sharply.
European diversification extends beyond Switzerland, with the broader MSCI Europe Index trading at roughly a 31% discount to the S&P 500 on forward earnings multiples, a valuation gap that gives the geographic case a quantitative foundation beyond sector mix alone.
Over roughly 50 years, Swiss equities returned approximately 9.4% annually, compared with approximately 9.6% for US equities. Most investors would not have predicted near-parity from a market this defensive.
The three diversification benefits, summarised:
- Sector mix: Over 65% defensive weighting versus less than 20% in the MSCI ACWI
- Currency layer: CHF safe-haven characteristics that have historically benefited non-CHF investors over full cycles
- Low correlation: Different performance pattern during technology-driven rallies and corrections
Understanding the unique risks of Swiss blue chips
The defensive profile does not eliminate risk. It changes its shape. Here is what you are taking on.
Index concentration is the most direct risk. Because the SMI is so heavily weighted toward its top names, a handful of single-stock events can move the benchmark by a meaningful margin. An adverse regulatory decision affecting Roche’s oncology pipeline, or a sustained revenue decline at Nestlé, does not just affect one position. It moves the benchmark.
Valuation premium is the risk most investors underestimate. Swiss blue chips trade at a premium to global equities, reflecting stable earnings quality, strong balance sheets, and consistent cash-flow generation. That premium is earned, but it is not permanent. A shift in sentiment, a period where quality stocks fall out of favour relative to growth or cyclical names, can compress the valuation multiple even without any operational deterioration. Paying a quality premium works until sentiment shifts, and you should understand that stable earnings do not insulate against multiple compression.
Currency and return-regime considerations
CHF movements can amplify or reduce your local equity returns depending on timing and direction. While the long-term tendency has favoured non-CHF investors, short-term volatility is real and can cut both ways over quarters or even years.
The decade of underperformance versus the MSCI World is best understood as a regime-specific outcome: global indices benefited from technology sector strength that Switzerland structurally lacks. That is not a flaw; it is the mechanism by which Swiss equities provide diversification. But it does mean periods where your Swiss allocation trails your global one, and that requires patience.
The risk categories to keep front of mind:
- Concentration: Three companies disproportionately drive SMI performance
- Valuation premium: Quality premiums can compress without operational deterioration
- Currency exposure: CHF movements create short-term return volatility for non-CHF investors
- Standard equity risk: Swiss share prices can decline as well as appreciate, regardless of defensive positioning
This article is for informational purposes only and should not be considered financial advice. Investors should conduct their own research and consult with financial professionals before making investment decisions.
Dividends, withholding tax, and what your net yield actually is
Well-established Swiss blue chips, including Nestlé, Roche, Novartis, Zurich Insurance, and Swisscom, have built reputations over many years for sustaining and progressively growing their dividend payments. That makes income a genuine part of the Swiss equity investment case. But the yield you see quoted is not the yield you receive.
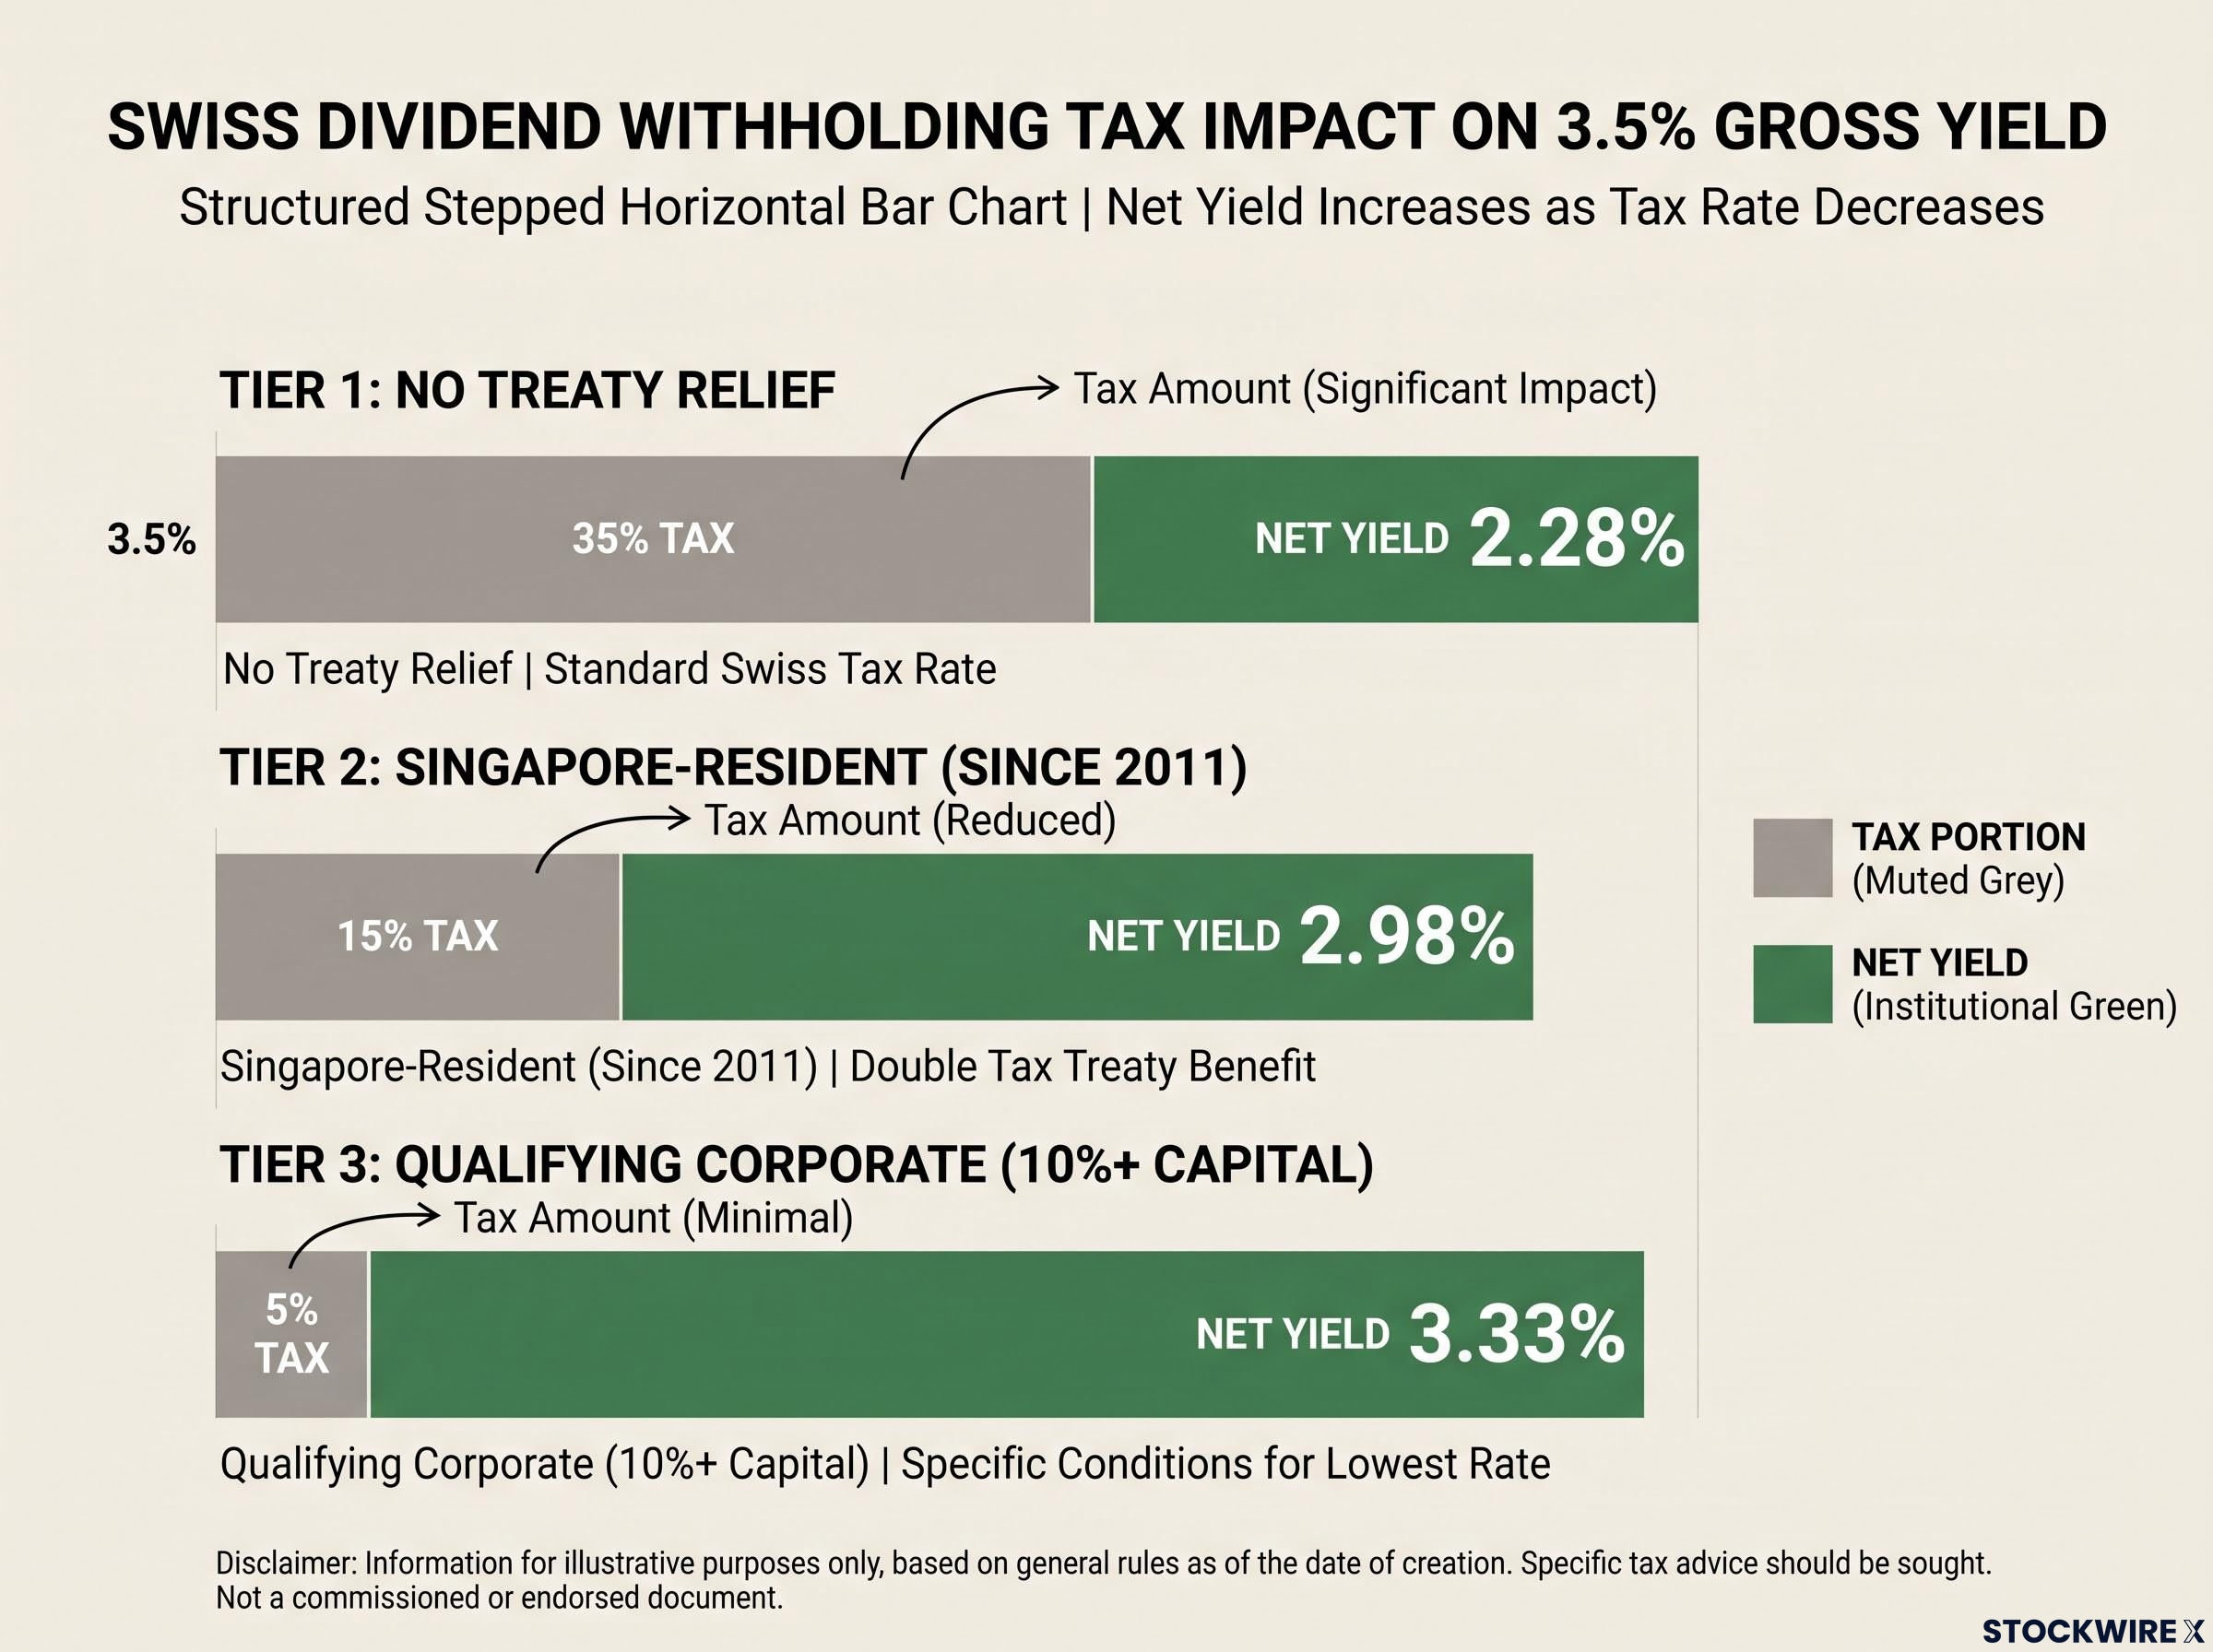
Swiss authorities levy a withholding tax of 35% on dividends before they leave the country. This is among the highest dividend withholding rates in developed markets.
That 35% rate applies to all non-resident investors by default and directly reduces the cash hitting your account. A stated dividend yield of 3-4% on a major Swiss name looks materially different after withholding.
Switzerland has an extensive network of double-tax treaties designed to reduce this burden. The applicable reduced rate depends on your jurisdiction, investor profile (individual versus corporate), shareholding percentage, and beneficial ownership status. To illustrate how the treaty framework operates in practice, individual investors resident in Singapore can typically access a reduced 15% rate on Swiss dividends, a benefit established under the bilateral tax agreement between Singapore and Switzerland that has been in effect since 2011. Qualifying corporate holders with at least 10% of the paying company’s capital may be eligible for a 5% rate.
| Scenario | Applicable Rate | Effective Net Yield on 3.5% Stated Yield |
|---|---|---|
| No treaty relief | 35% | 2.28% |
| Singapore-resident individual with treaty | 15% | 2.98% |
| Qualifying corporate holding with treaty | 5% | 3.33% |
In practice, many brokers apply the full 35% by default. Reclaiming the excess above your treaty rate typically requires filing with the Swiss Federal Tax Administration, a process that involves documentation of tax residence and processing time.
The bottom line: a stated dividend yield is not your dividend yield. You need to factor withholding tax, treaty relief availability, and administrative complexity into your net return calculation. Tax rules and treaty interpretations vary by jurisdiction and individual circumstances. Consult the Swiss Federal Tax Administration and your domestic tax authority, or seek qualified tax advice, before making decisions based on dividend yields.
The gap between stated and net yield that Swiss withholding tax creates is one instance of a broader principle: dividend yield vs total return are different measurements, and the yield figure that appears on a stock screener omits capital movement, tax drag, and sector concentration costs that only a total return lens captures.
Past performance does not guarantee future results. Financial projections are subject to market conditions and various risk factors.
Making a considered allocation to Swiss blue chips in a global portfolio
Swiss blue chips belong as a stabilising, quality complement inside a truly global portfolio. They add defensive sector exposure, CHF diversification, and globally generated revenues across healthcare, consumer staples, luxury goods, and banking. They do not replace global breadth. They balance it.
Investors who find the Swiss case compelling often find it useful to compare it against the Spanish and Italian alternatives: investing across European markets reveals that each exchange serves a structurally different portfolio role, with Switzerland as a defensive anchor, Spain as an income sleeve, and Italy as the higher-beta cyclical position.
Your access route depends on your preference for simplicity versus control:
- SMI ETF: Concentrated, low-cost exposure to the 20 largest Swiss names; suits investors comfortable with the top-three concentration trade-off
- SPI ETF: Broader Swiss market coverage including mid and small caps; suits investors who want wider diversification within Switzerland
- Direct holdings via international broker: Allows you to select specific names and control position sizing; suits investors who want Swiss exposure without inheriting index concentration
Before allocating, answer three questions:
- What is your current technology sector overweight? If your portfolio is heavily weighted toward tech-driven benchmarks, the Swiss defensive mix offers a genuine counterbalance.
- How does CHF exposure interact with your existing currency mix? Adding CHF-denominated assets changes your currency profile; understand whether that complements or duplicates other safe-haven positions.
- Are you evaluating dividend yield on a gross or net basis? The withholding tax gap between stated and received yield is material. Factor it into your return expectations before it surprises you.
The investor who walks away from this section should be able to articulate one specific reason Swiss blue chips fit or do not fit their portfolio today, not a generic view that Swiss stocks are good quality.
What the Swiss market’s record highs in 2026 change, and what they do not
The SMI at record highs is relevant context, but the structural case for Swiss equities does not depend on market timing. The defensive sector profile, the global revenue base, and the CHF diversification layer are characteristics that persist across valuation cycles.
What record highs do change is the entry-point maths. The premium you pay for quality is higher now. You should assess whether the diversification benefit justifies the current price rather than assuming it does. No allocation decision should rest on the assumption that what just hit a record will keep climbing.
The variables to monitor from here: CHF strength relative to your home currency, the Nestlé and Roche earnings cycle as proxies for SMI concentration risk, and the relative performance of defensive sectors globally as a signal for when Swiss equities are most likely to earn their keep in your portfolio. Those three data points will tell you more than the index level alone.