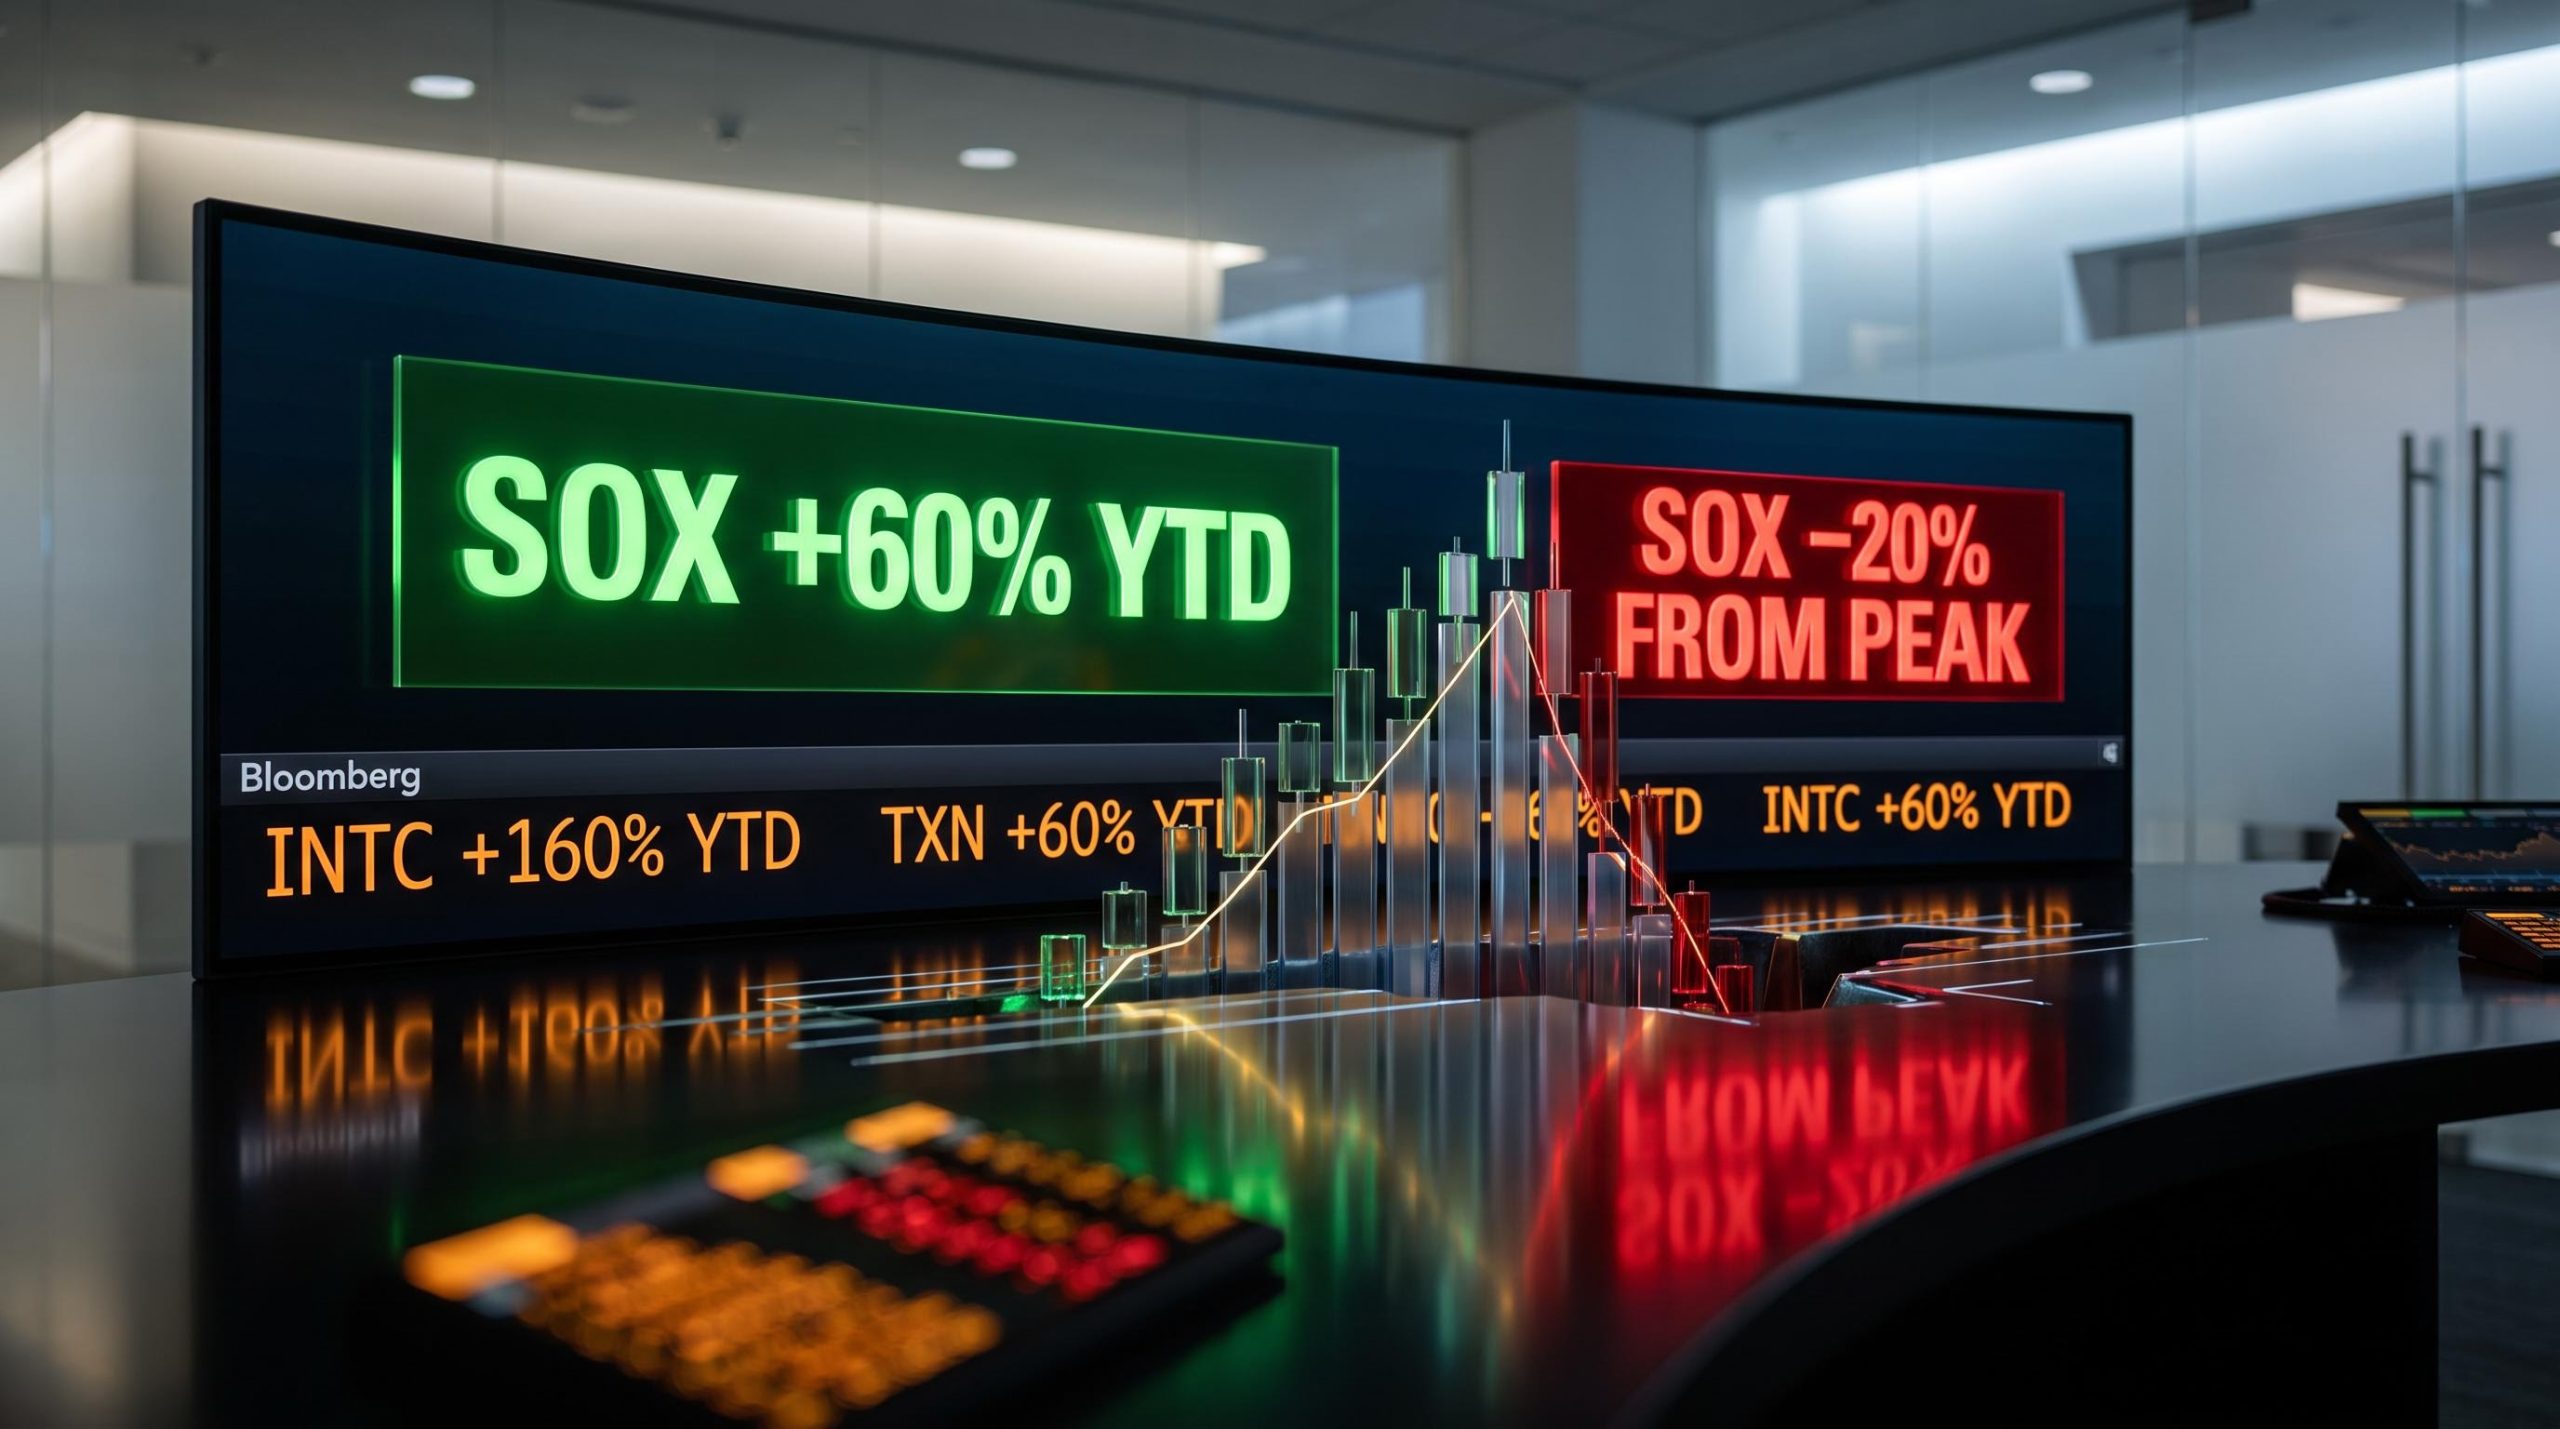
The Philadelphia Semiconductor Index (SOX) had shed more than 20% from its record peak set in late June. Yet the same index was still holding gains exceeding 60% for 2026 as a whole. Both numbers are accurate, both describe the same index at the same moment, and the tension between them is the single most important thing to understand about semiconductor stocks right now.
The timing sharpens the stakes. As of the week of 19 July 2026, chip stocks have crossed the conventional bear market threshold just as earnings season reaches one of its most consequential stretches. Intel and Texas Instruments report results in the coming days, with a field of over 80 S&P 500 companies scheduled to publish their figures across the same period. The question of whether the AI chip trade is intact or unwinding is not theoretical; it is being answered in real time.
Here is a clear map for reading the two performance numbers correctly, understanding the structural forces producing these swings, and knowing exactly what to listen for when Intel and Texas Instruments management take the microphone this week.
How the same index can be up 60% and in a bear market at the same time
The contradiction dissolves the moment you separate two different measurement windows that are both doing exactly what they are designed to do.
Year-to-date performance measures the change from 1 January to today. Peak-to-trough performance measures the change from the highest price reached in a given period to a subsequent low. They use different starting points, and that is why they can tell different stories about the same asset.
A worked example makes the mechanics concrete.
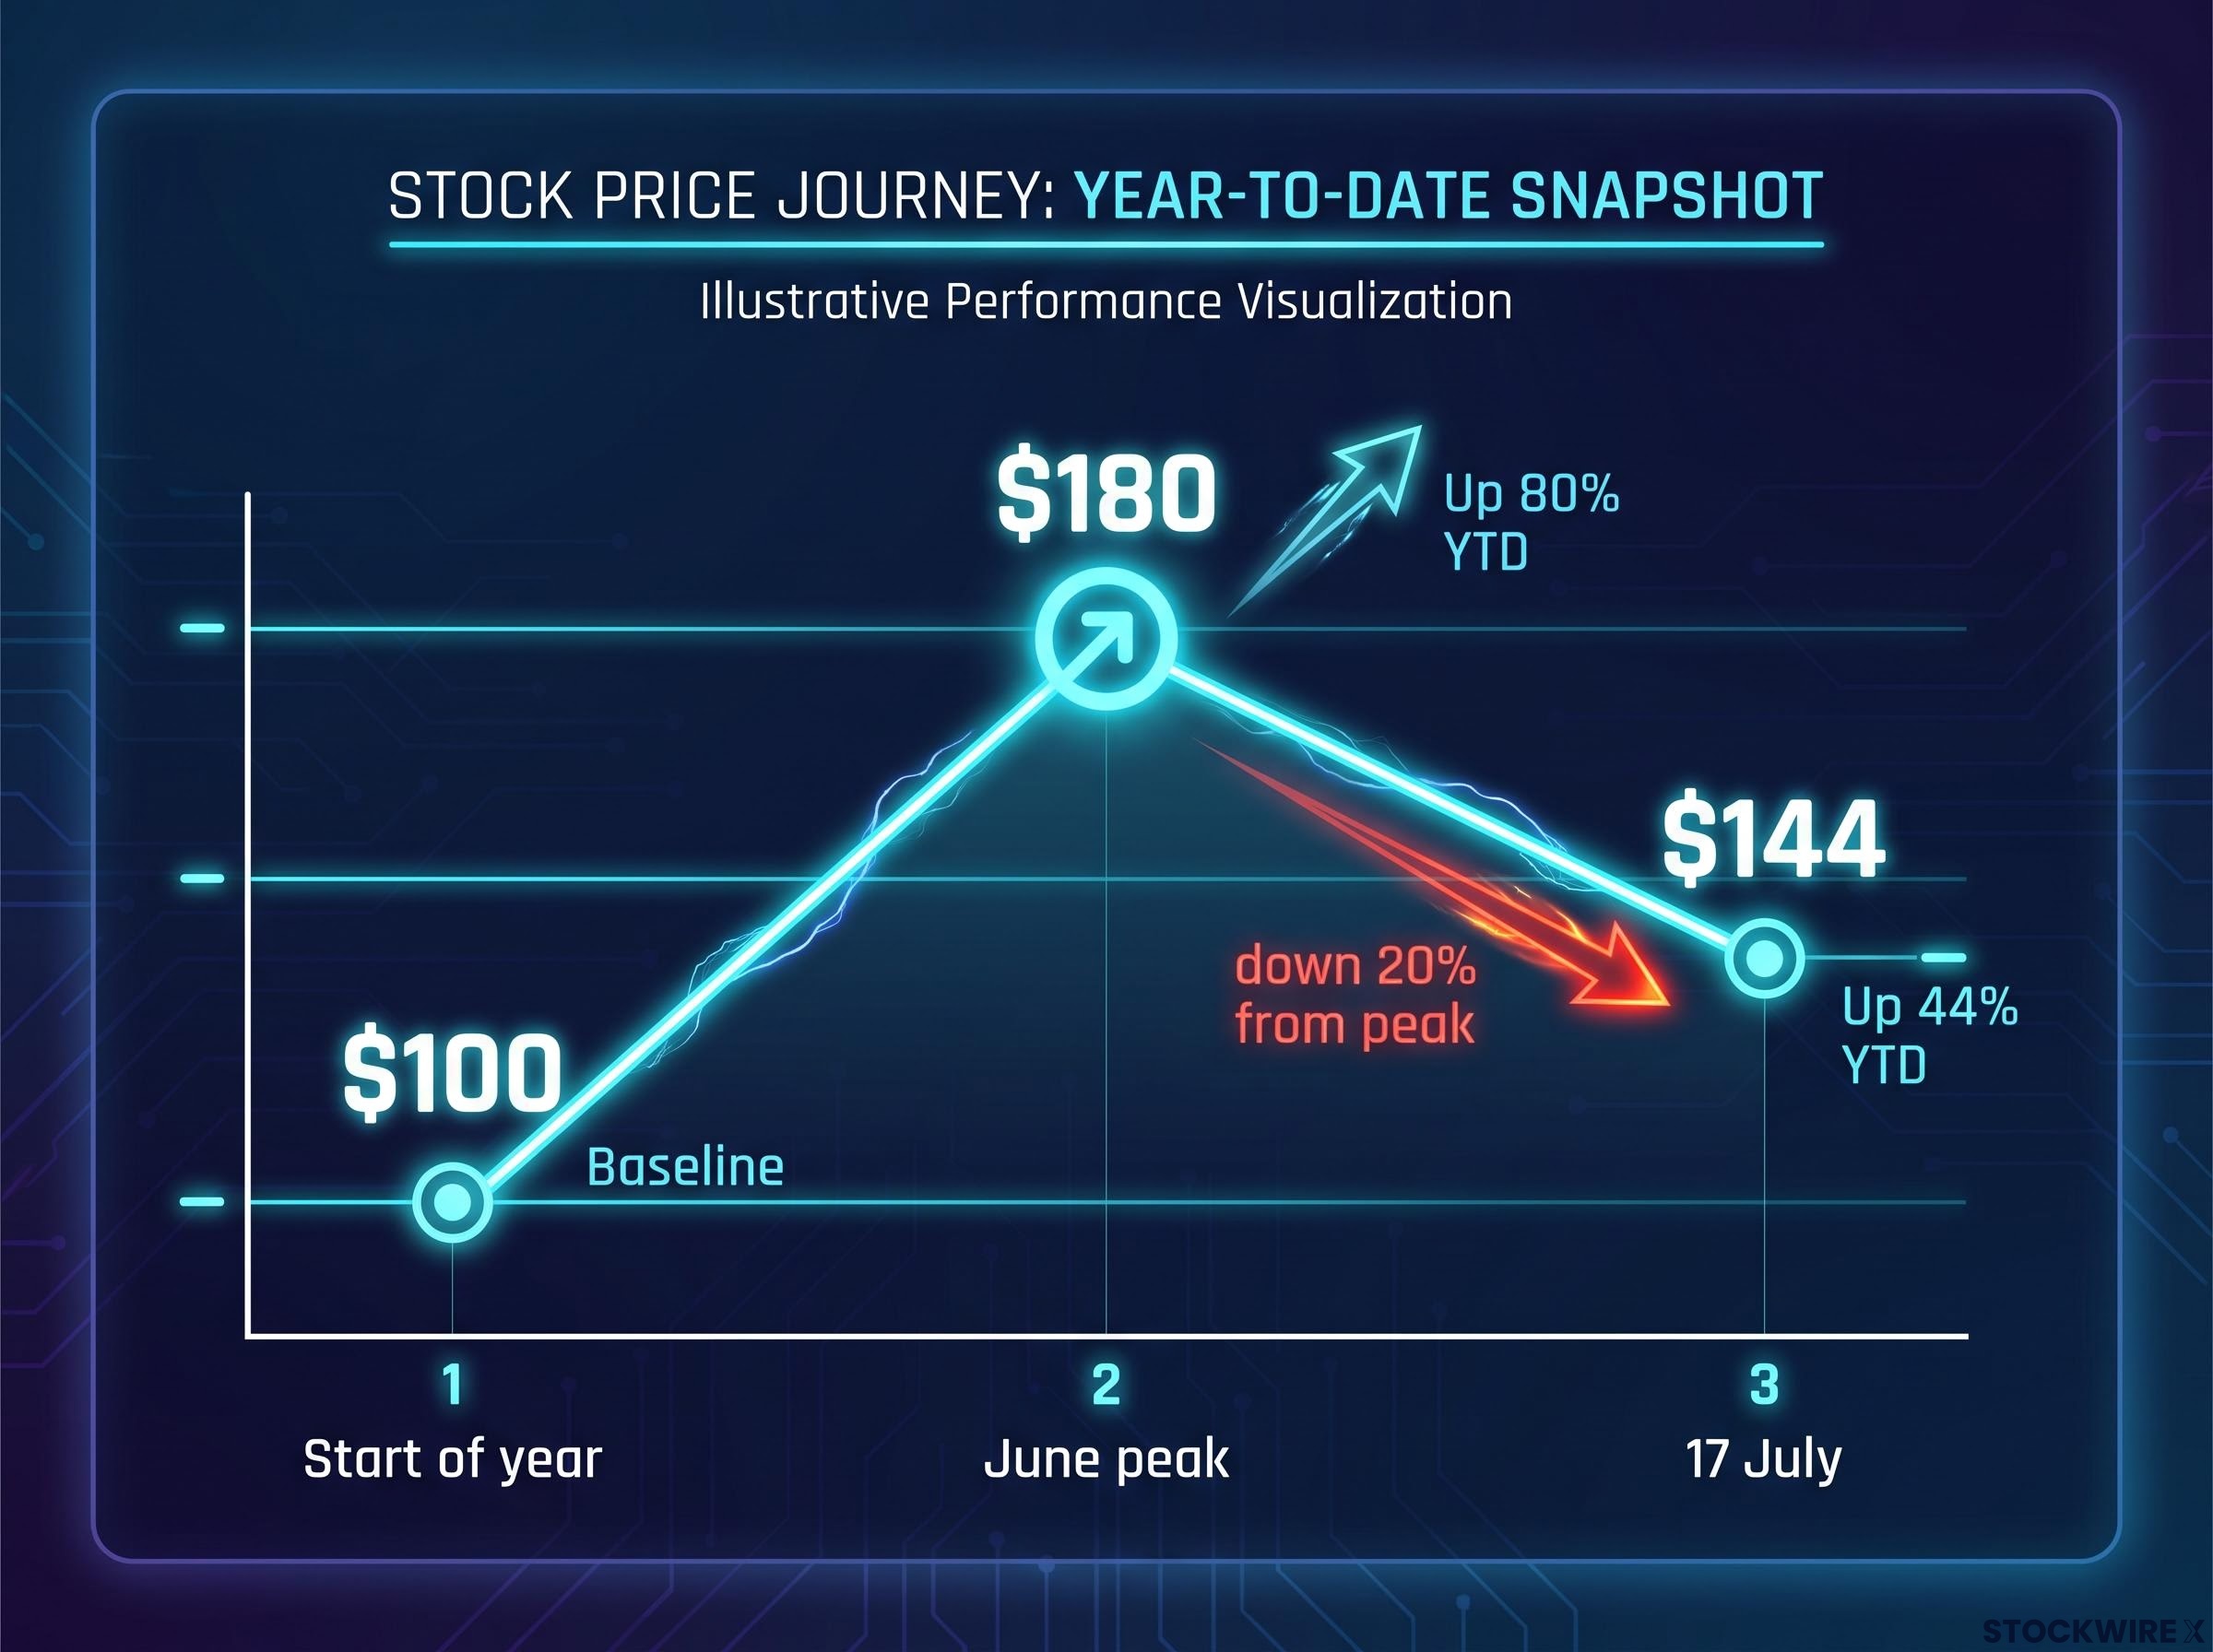
| Timeframe | Price | Performance label |
|---|---|---|
| Start of year | $100 | Baseline |
| June peak | $180 | Up 80% YTD |
| 17 July | $144 | Up 44% YTD; down 20% from peak |
At $144, this hypothetical stock is simultaneously in a bear market from its high and delivering a strong annual gain. The SOX is doing exactly this on a larger scale. Through the end of June, it had surged approximately 100% over six months, the strongest first-half performance on record in data going back to 1994. As of mid-July 2026, the index had retreated more than 20% from that peak, while remaining well over 60% ahead of where it started the year.
The SOX index methodology, published by Nasdaq, confirms the index’s inception date of December 1, 1993, at a base value of 100, providing the historical foundation against which the first-half 2026 surge can be measured as the strongest on record.
What this means depending on when you bought in
Which number feels real depends entirely on your entry point. If you bought chip stocks in January or February, you are sitting on substantial paper gains even after the drawdown. The bear market headline is uncomfortable but has not erased your position.
If you entered near the June peak, the maths is brutal. A 20% decline from your purchase price is a genuine drawdown, and the “up 60% on the year” headline describes someone else’s experience, not yours. Entry point is not a footnote in high-volatility markets. It is the variable that determines whether you perceive this sector as a success story or a disaster, and both perceptions are correct for the investor living them.
When big ASX news breaks, our subscribers know first
Why semiconductor stocks are built for extreme swings
The 20% drawdown is not a freak event. It is what the sector’s architecture produces. Three structural forces reinforce each other, and once you see them, the volatility stops looking random.
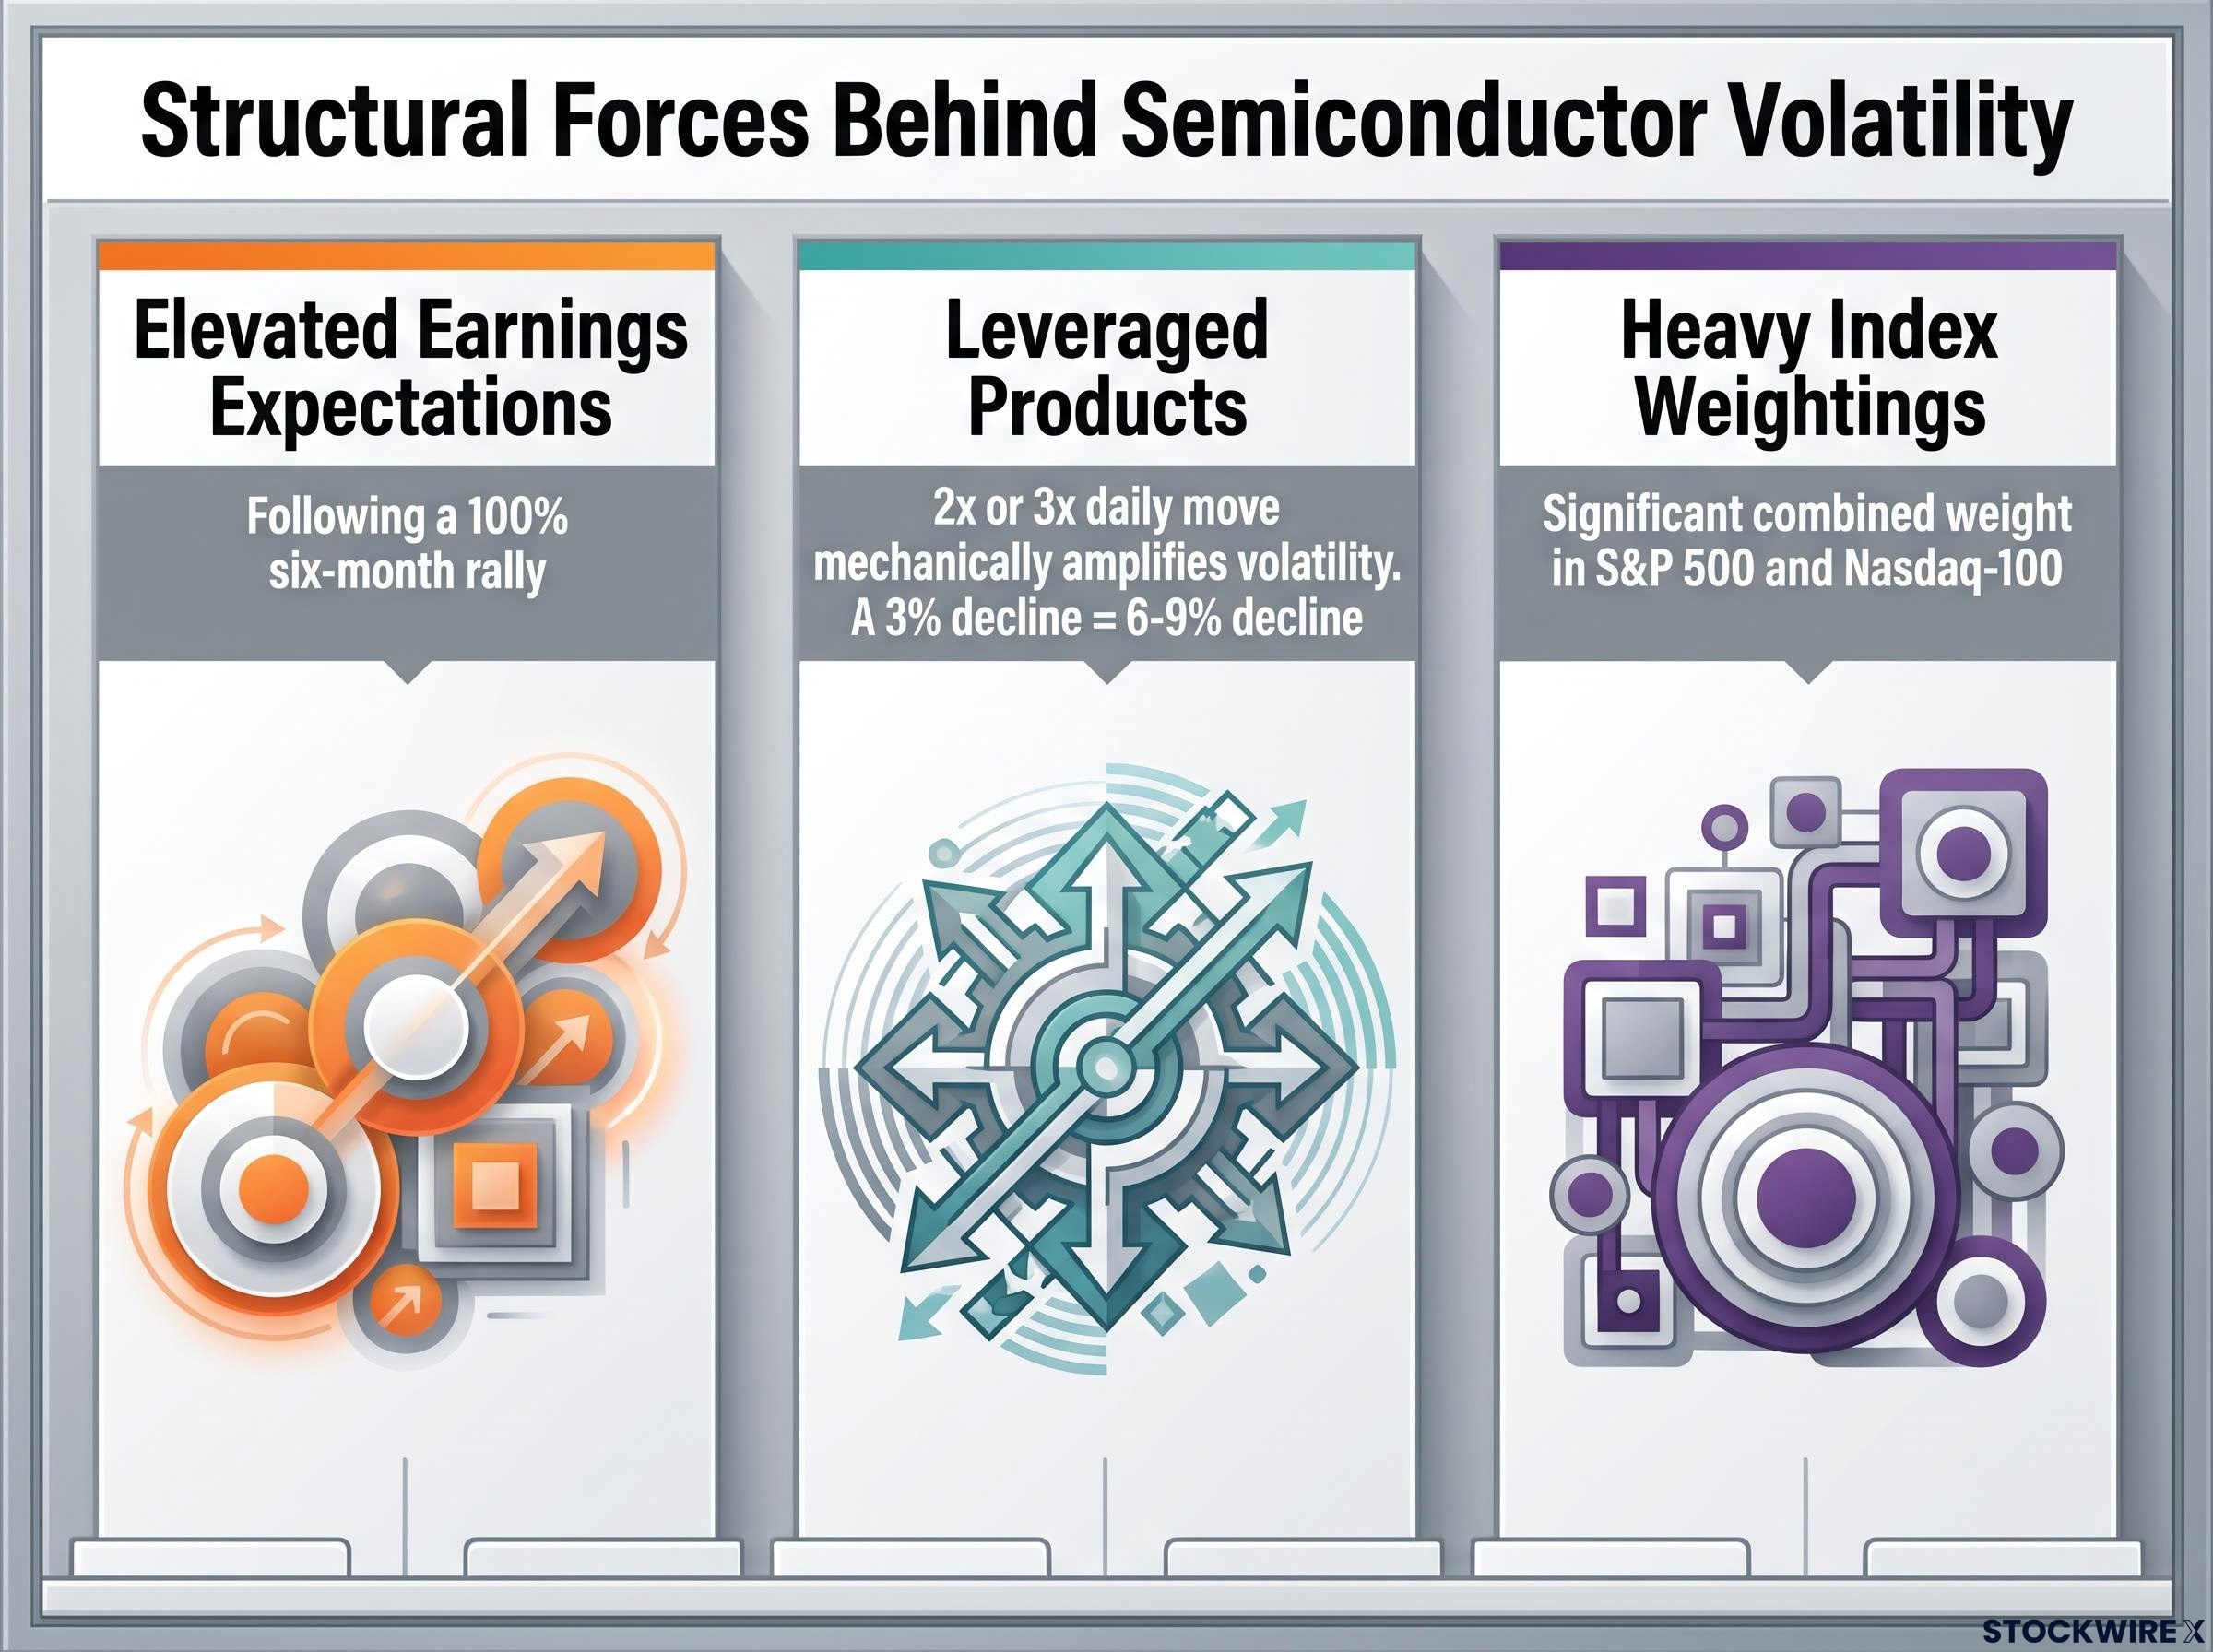
- Elevated earnings expectations: After a 100% six-month rally, the market is no longer pricing in good results. It is demanding “beat and raise” outcomes, where companies deliver large earnings beats and lift forward guidance, to justify valuations that already reflect aggressive AI growth assumptions.
- Leveraged and derivative products: Leveraged ETFs designed to deliver 2x or 3x the daily move of the SOX mechanically amplify every session. A 3% SOX decline can translate into 6-9% declines in those products in a single day.
- Heavy index weightings: Semiconductor companies carry significant combined weight in the S&P 500 and Nasdaq-100, meaning chip selloffs ripple directly into broad-market portfolios.
The earnings expectations dynamic was visible before the pullback began. The VanEck Semiconductor ETF posted its best first half on record alongside the SOX’s surge. Through mid-July 2026, Intel shares had climbed more than 160% for the year, while Texas Instruments had posted a year-to-date gain of around 60%. The subdued share price responses to otherwise strong quarterly figures from Samsung Electronics and TSMC made clear that the market had already priced in exceptionally high standards.
Michael Arone, Chief Investment Strategist at State Street Investment Management, identified leveraged products as a key amplifier of chip sector price moves in both directions during this period. These products rebalance daily to maintain target leverage, which forces additional selling into declining sessions, mechanically reinforcing intraday trends rather than dampening them.
Daily reset mechanics cause a 3x leveraged fund to lose 9% over two sessions when the underlying index falls just 1%, because alternating percentage moves compound asymmetrically under leverage, producing outcomes that diverge sharply from the simple multiplier most investors assume.
What this means for you: leveraged semiconductor products do not simply deliver “2x or 3x the index” over time. Daily rebalancing creates a compounding drag that diverges from that mental model, particularly in volatile stretches. If you hold these products without understanding the mechanics, your outcomes may look nothing like what you expected.
How index weighting turns a chip selloff into a broad-market event
On major down days for chips, semiconductor stocks have become one of the largest negative contributors to both the S&P 500 and the Nasdaq. The sector’s substantial combined weighting means a sharp chip selloff drags down broad-market ETFs held in retirement accounts and passive funds, even when other sectors are relatively stable.
If you hold broad index funds, your portfolio’s daily performance is more exposed to chip stock volatility than you may recognise. Understanding that exposure is the first step toward deciding whether it is intentional.
The geopolitical layer that earnings models cannot price
Beyond earnings and leverage mechanics, semiconductor stocks carry a structural risk layer that quarterly models struggle to incorporate.
Production of leading-edge chips is geographically concentrated in Asia. Many of the largest U.S. semiconductor companies depend on foundries in Taiwan and South Korea for their most advanced manufacturing. That concentration creates a supply chain vulnerability that sits outside normal business cycle analysis.
Taiwan supply chain concentration sits at the most acute point in decades: TSMC produces roughly 90% of the world’s leading-edge chips below the 5nm node, meaning a blockade or energy disruption affecting a single island could simultaneously halt production for AI accelerators, automotive systems, and consumer electronics with no credible alternative capacity available at scale.
The risk categories are specific and ongoing:
- Geographic supply chain concentration in a small number of Asian facilities
- Export controls and sanctions that can restrict revenue access to major markets
- Domestic industrial policy changes (including chip subsidies and manufacturing incentives) that alter sector economics
- Bilateral technology tensions between major economies that can shift regulatory frameworks rapidly
These factors can trigger sudden sentiment shifts beyond anything an earnings model prices. Export controls or a change in sanctions policy can alter a company’s revenue outlook faster than a quarterly reporting cycle can capture.
Geopolitical risk in semiconductors is not a background variable to note and move past. It is a permanent source of volatility that any investor holding chip exposure needs to account for in their risk model, not just their investment thesis. The sector can move sharply even when fundamentals appear stable and quarterly results are solid.
What the Intel and Texas Instruments earnings reports actually tell you
Earnings season arrives at the moment when the sector most needs clarity, and the signal worth listening for is not the headline number.
Whether Intel or Texas Instruments beats or misses consensus estimates matters far less than what management says about the road ahead. Forward guidance on AI accelerator demand, hyperscaler data-centre capital expenditure commitments, and margin trajectory carries the directional signal. That is where you learn whether the spending cycle powering this rally is accelerating, plateauing, or showing cracks.
Both companies matter because their combined exposure gives their guidance broad diagnostic value. Intel spans AI accelerator demand and leading-edge manufacturing. Texas Instruments provides a read on the industrial chip cycle and capital expenditure trends across a wider customer base. Together, their commentary offers a more complete view of semiconductor demand than any single company can provide.
| Company | Key signal to watch |
|---|---|
| Intel | Forward guidance on AI accelerator demand and manufacturing margin |
| Texas Instruments | Industrial chip cycle commentary and capital expenditure outlook |
| Alphabet | Hyperscaler data-centre spending commitment and durability |
Alphabet reports during the same week, and its commentary on data-centre spending durability matters as much as any chip company’s results. As one of the largest AI hardware customers, Alphabet’s capital expenditure commitments serve as a demand-side validation (or contradiction) of the supply-side guidance from Intel and Texas Instruments.
The muted reactions to strong results from Samsung and TSMC earlier this quarter are the leading indicator to keep in mind. Solid fundamentals were not enough to move prices higher, because expectations were already extremely elevated. That tells you the bar for positive surprise is high, and guidance language matters more than the headline EPS number.
For investors wanting a practical framework for applying these principles to Intel and Texas Instruments in real time this week, our dedicated guide to reading earnings reports walks through the four-layer analysis process, including how to separate guidance language from headline EPS, that professionals use when good results still send stocks lower.
Five principles for navigating semiconductor volatility without overreacting
These are analytical tools for making decisions, not reassurances designed to make you feel comfortable holding through a drawdown. The goal is clarity about risk.
- Examine both performance frames before drawing conclusions. A 20% peak-to-trough drop looks alarming. A 60%-plus YTD gain looks comfortable. Neither one alone tells the full story. Always place them side by side before making a decision. Headlines that report only one frame are incomplete, and decisions based on incomplete frames are reactive ones.
- Distinguish between stretched valuations and a broken thesis. A sector that rallied 100% in six months has a lot of good news priced in. That is a statement about valuation, not about whether the underlying demand for AI infrastructure has changed. Stretched valuations mean more risk if expectations disappoint. They do not, by themselves, mean the long-term case has collapsed.
- Treat leverage as a specific risk category, not a general caution. Leveraged semiconductor ETFs suit very short-term, actively managed trades. Daily rebalancing mechanics mean they amplify losses differently from a simple “2x or 3x” mental model, particularly across volatile multi-day stretches. They are not designed for long-term thematic exposure.
- Know your indirect chip exposure. Before adding a deliberate semiconductor position, check how much chip exposure you already hold through broad index funds. The sector’s significant weighting in the S&P 500 and Nasdaq-100 means many investors carry more concentration than they realise.
- Ask whether your original thesis has changed, not whether the price has. A 20% drawdown is uncomfortable. The question that matters is whether the evidence supporting your reason for holding the position has shifted, not whether the price has.
A 20% peak-to-trough drop does not, by itself, prove the long-term thesis is broken. It does mean that entry point matters, and it demands you revisit the evidence rather than react to the price.
Reading the next move: three variables that matter more than the index level
The SOX’s level on any given day is a lagging indicator. Three forward-looking variables carry more directional signal for where semiconductor stocks head from here.
- Earnings guidance quality from Intel and Texas Instruments (week of 21 July 2026). The headline beat-or-miss number fades quickly. What persists is management’s commentary on AI demand trajectory, data-centre spending pipelines, and margin sustainability. Listen for specificity and confidence in forward quarters, not just backward-looking results.
- Hyperscaler capital expenditure durability from Alphabet and peers. If the largest AI hardware customers reaffirm or increase their data-centre spending commitments, that validates the demand side of the semiconductor thesis. If they hedge or delay, it undermines it, regardless of what chip companies say about their own order books.
- U.S. export control or geopolitical policy shifts. Any change in export restrictions, sanctions frameworks, or bilateral technology agreements can alter sector revenue outlooks faster than any earnings report. This variable is less predictable but no less consequential.
Hyperscaler capex commitments have been running at a pace that gives chip company guidance a concrete demand anchor: the broader processor segment accelerated from 40% growth in Q4 2025 to a 67% rate in Q2 2026 guidance, a multi-quarter acceleration that distinguishes this cycle from typical consumer hardware demand spikes.
If management teams at Intel, Texas Instruments, and Alphabet collectively reaffirm AI infrastructure spending durability in late July, that combination of signals carries more weight for the semiconductor trade’s direction than any single index-level data point.
The SOX’s 60%-plus YTD gain and its 20%-plus drawdown from the peak are both real. Neither one alone tells you what happens next. The variables above are where the actual directional information lives, and this week’s earnings provide the first major data points.
This article is for informational purposes only and should not be considered financial advice. Investors should conduct their own research and consult with financial professionals before making investment decisions. Past performance does not guarantee future results. Financial projections and forward-looking statements are subject to market conditions and various risk factors.