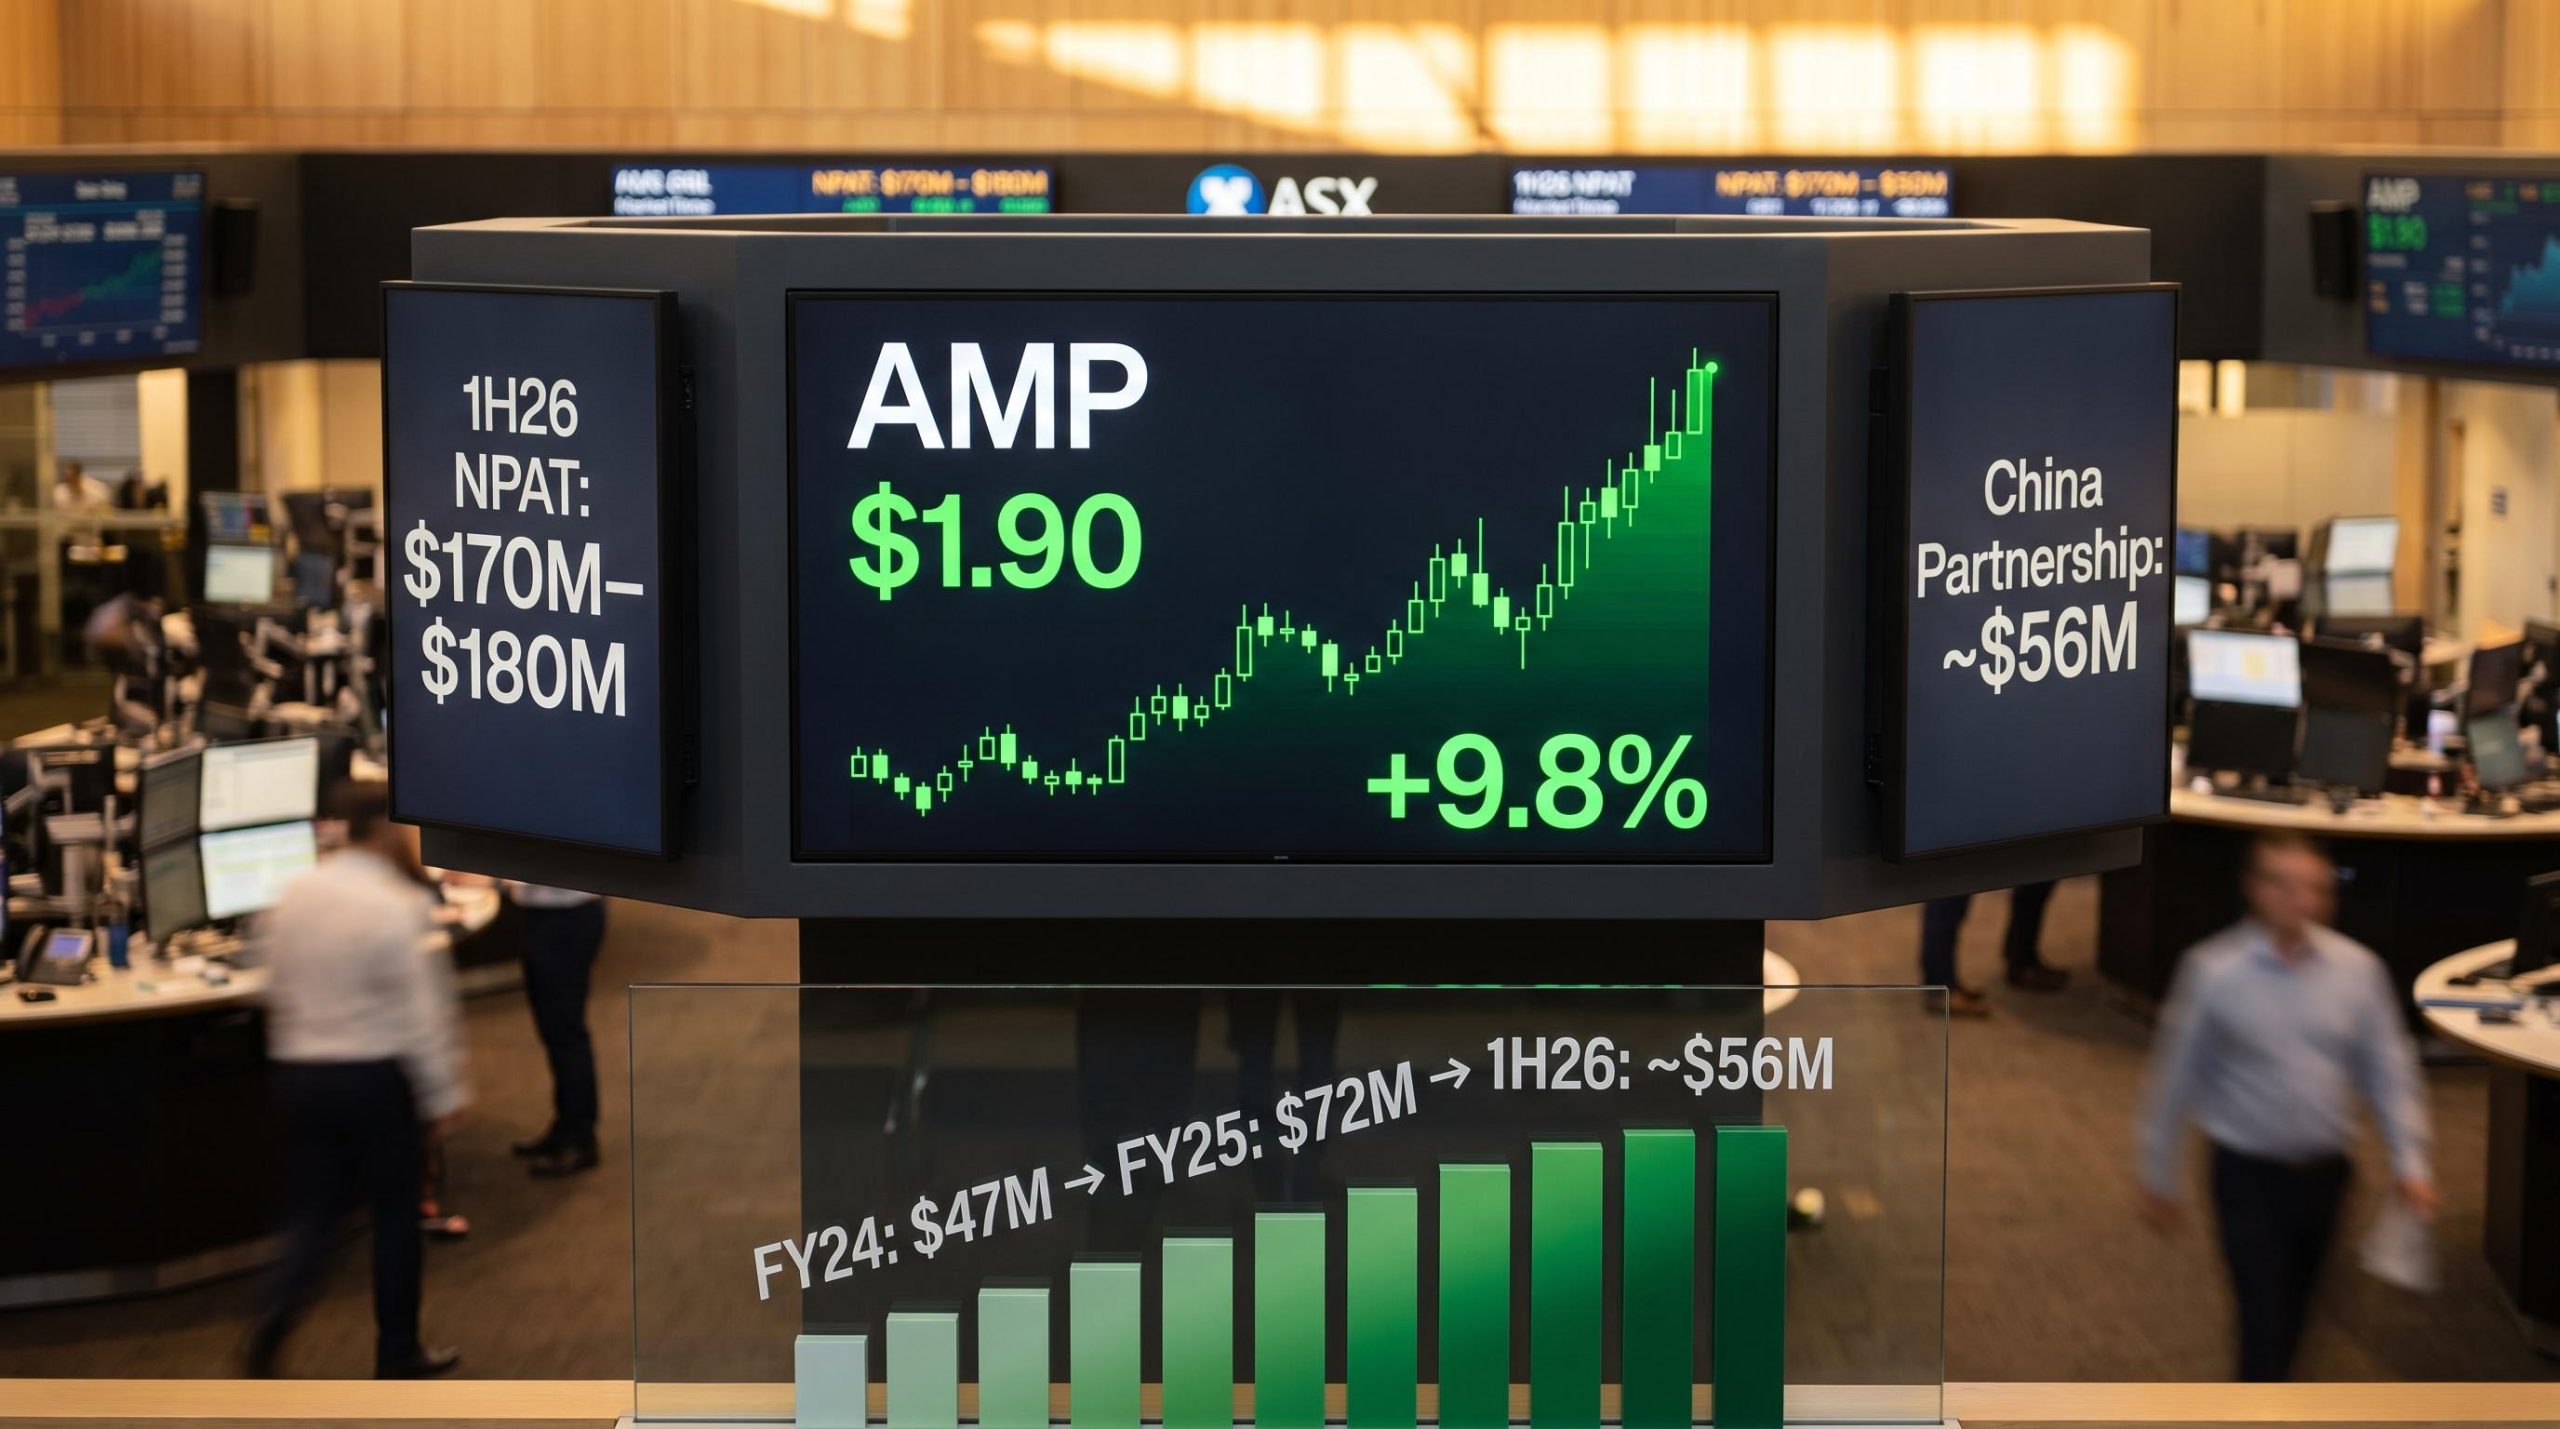
AMP’s share price just posted its best single day since 2024, a 9.8% surge that was not a short squeeze or a macro accident. It was driven by a specific guidance upgrade with a specific number attached, and a China partnership story that is compounding faster than most ASX investors have priced in.
The 16 July 2026 move pushed AMP to $1.90 and extended its one-month gain to 22.2% and its one-year gain to 26.7%, placing it among the ASX financials sector’s strongest performers on a day when the financials index itself rose 0.88% on rotational capital out of materials. The guidance upgrade, covering first-half 2026 underlying net profit after tax (NPAT) of $170 million to $180 million, puts AMP’s China partnerships at roughly one-third of that midpoint figure. That proportion reframes the company’s earnings story significantly.
Here is what the guidance numbers actually reveal, why the China partnership contribution is structurally significant rather than opportunistic, and what the remaining variables are before you can draw conclusions about AMP’s forward trajectory. By the end, you will know whether this re-rating reflects a durable shift or a single catalyst with a short shelf life.
What AMP’s guidance upgrade actually says about its earnings trajectory
The numbers arrived via company announcement on 16 July 2026, and they carried more weight than a typical trading update. The core figures:
- 1H26 underlying NPAT guidance: $170 million to $180 million (midpoint approximately $175 million)
- China partnership projected contribution for 1H26: approximately $56 million, up from roughly $45 million in 2H25
- Half-on-half growth rate: approximately 24%
- China partnerships as a proportion of NPAT midpoint: approximately one-third
That half-on-half growth rate is the headline. A 24% lift from one half to the next, in a business line that already grew 53.2% in FY25, tells you the compounding is accelerating rather than plateauing.
China partnerships are projected to account for approximately one-third of AMP’s 1H26 underlying NPAT at the midpoint of guidance.
That one-third proportion is the data point that explains the scale of today’s re-rating. AMP is no longer primarily a domestic wealth restructuring story. The earnings mix has shifted, and the market priced that shift in a single session.
When big ASX news breaks, our subscribers know first
How AMP’s China partnerships grew from a footnote to a core profit engine
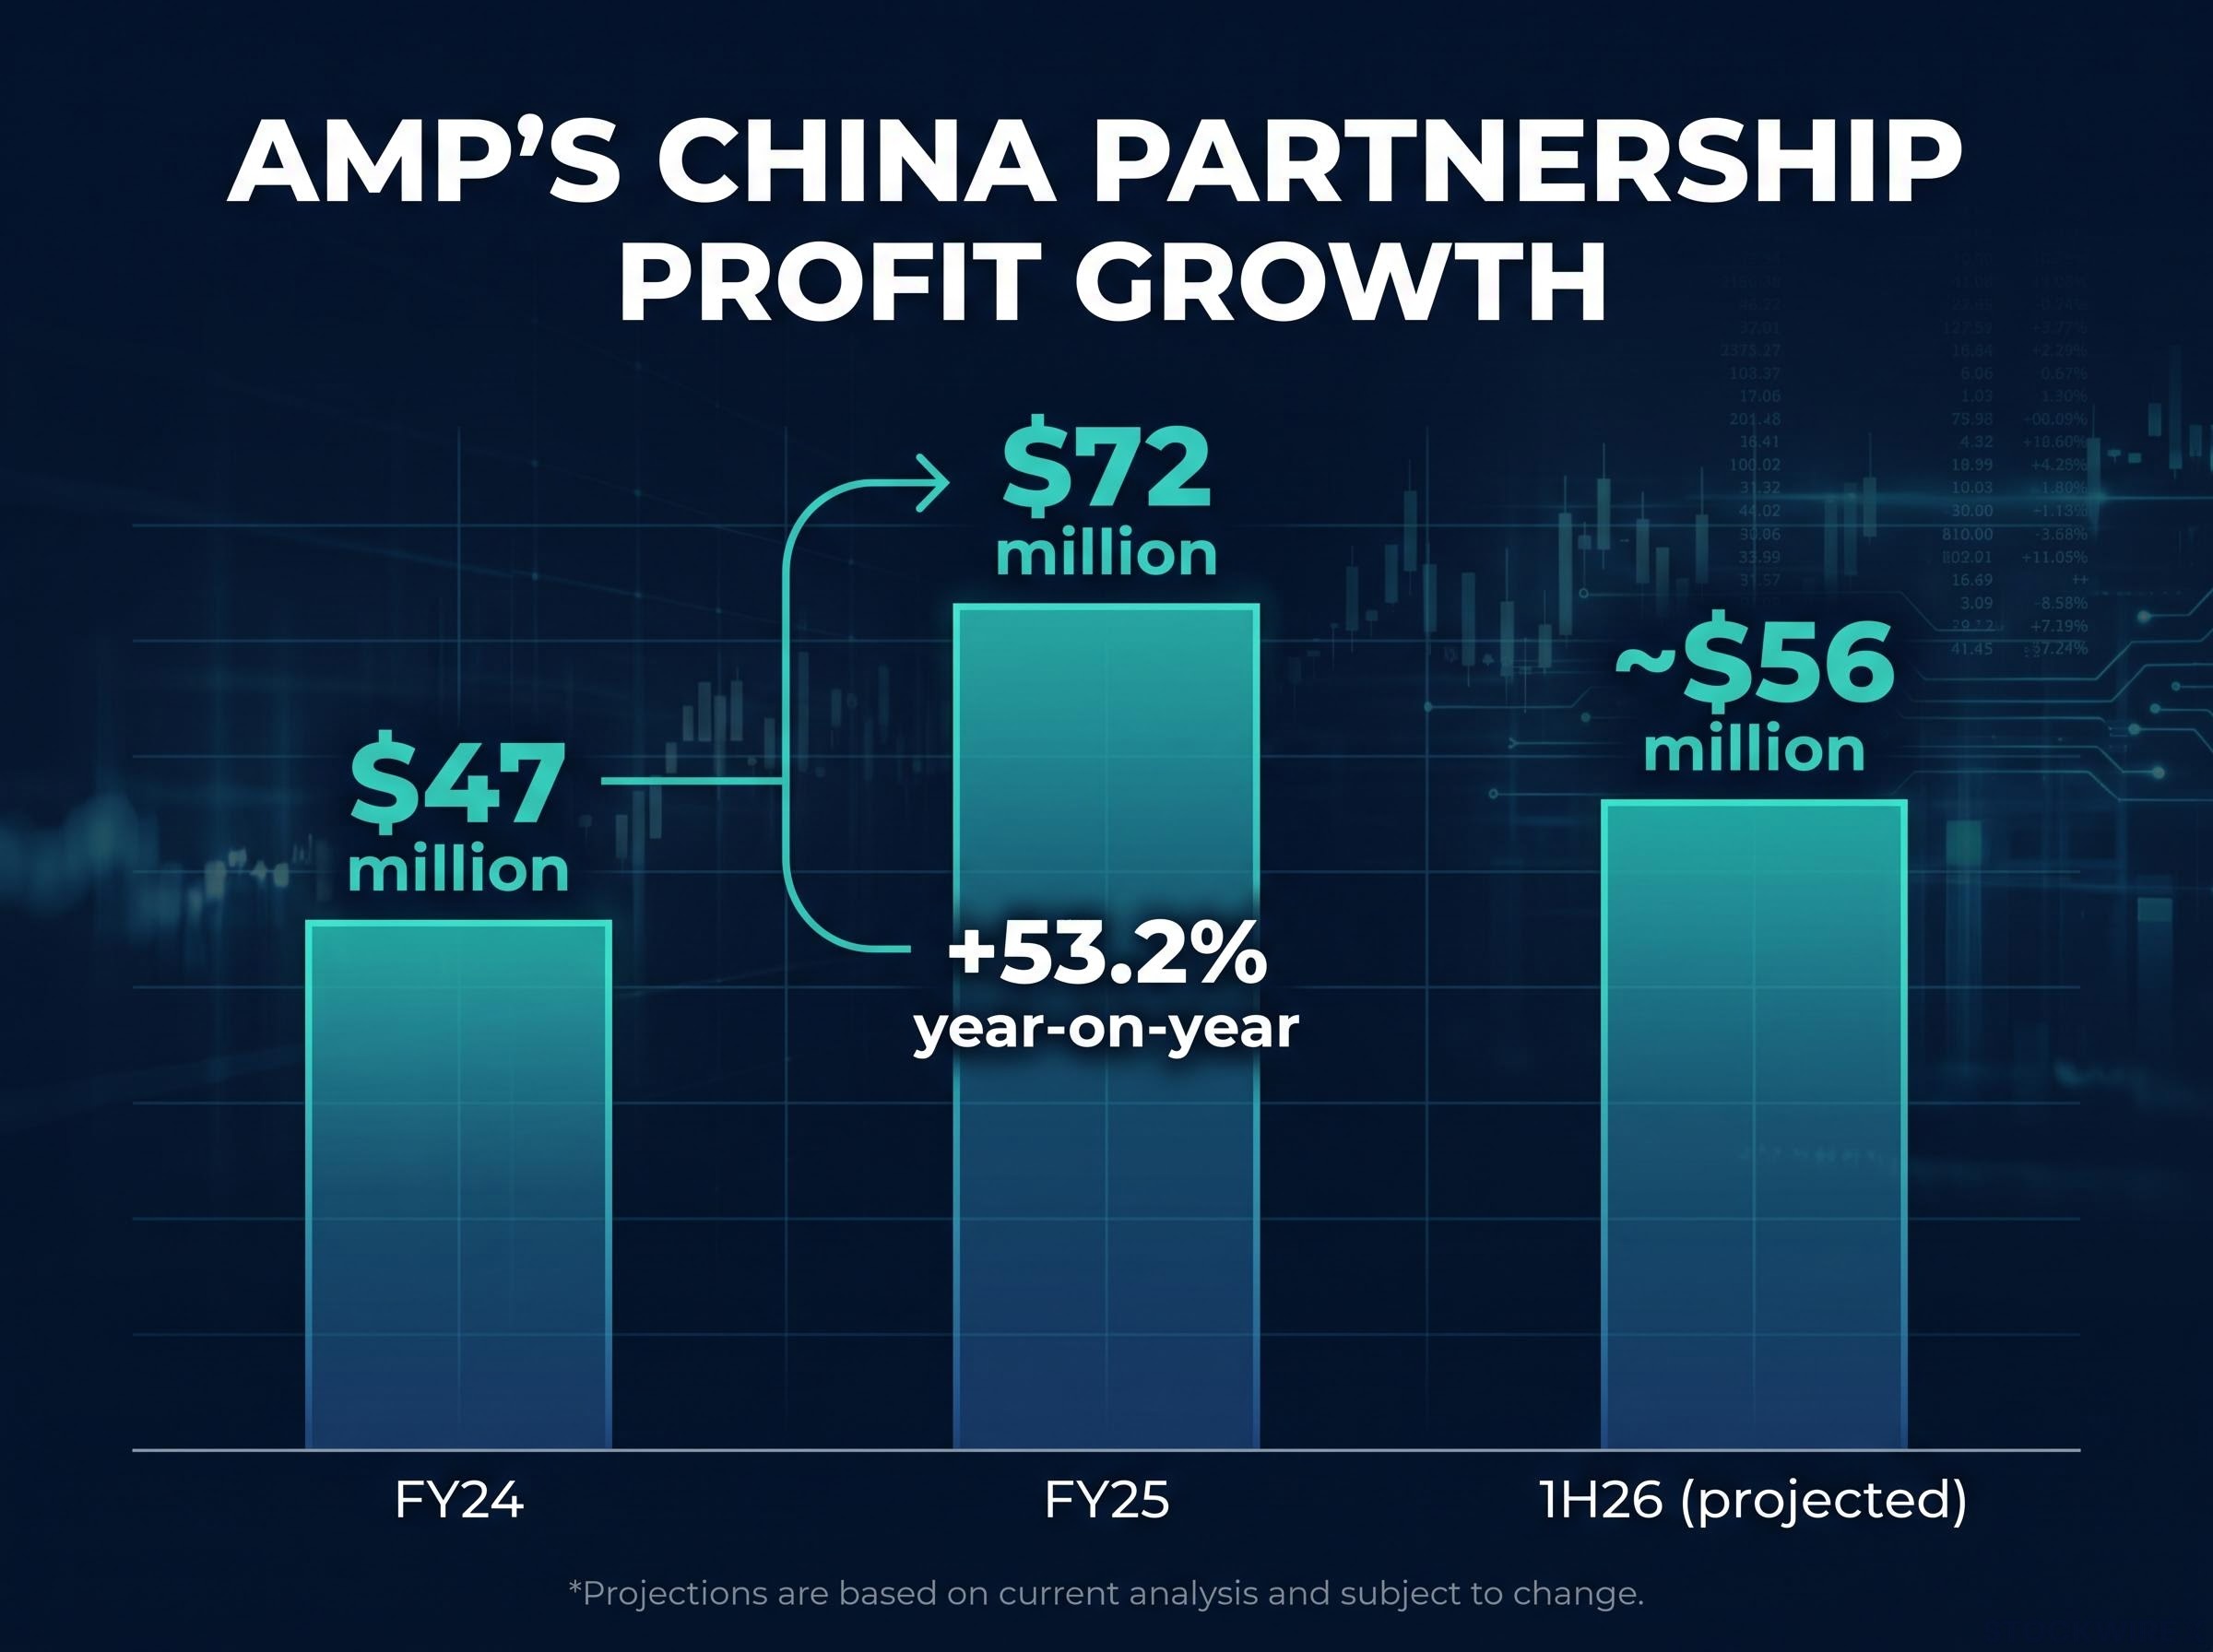
The trajectory is best seen as a sequence. In FY24, AMP’s China partnerships contributed $47 million to profit. In FY25, that figure rose to $72 million, a 53.2% year-on-year increase. The 1H26 projection of approximately $56 million puts the run rate well ahead of the prior full-year contribution just two years ago.
| Period | Profit contribution | Year-on-year growth |
|---|---|---|
| FY24 | $47 million | — |
| FY25 | $72 million | 53.2% |
| 1H26 (projected) | ~$56 million | 35% (1H25 YoY comparison) |
The growth rates have not been uniform, but they have all been large. The 1H25 contribution was up 35% year-on-year. FY25’s full-year jump of 53.2% built on that momentum. And the projected 1H26 figure implies the trajectory is steepening, not flattening.
The guidance upgrade also included approximately $13 million post-tax in carried interest recognition from a legacy infrastructure fund, following DigitalBridge’s early payment tied to the sale of a 51% interest in remaining assets, with further upside possible if the remaining 49% interest is sold.
The market behind the numbers: CLPC and China’s pension expansion
The underlying asset is China Life Pension Company (CLPC), in which AMP holds a 19.99% ownership stake. CLPC is a pension fund manager operating in China’s rapidly expanding retirement savings market.
At the end of FY25, CLPC’s pension assets under management (AUM), the total value of funds it manages on behalf of clients, stood at approximately RMB 2.4 trillion, which converts to roughly $515 billion in Australian dollar terms. That AUM grew by approximately RMB 350 billion (roughly $76 billion) during FY25 alone, representing approximately 17% growth in a single year.
The scale matters. CLPC’s AUM base is far larger than AMP’s domestic operations, and China’s pension reforms, rising household wealth, and structural savings demand provide the forward runway for continued AUM growth. AMP is capturing meaningful economics from a market that dwarfs its home footprint, which is the structural reason the profit growth rate can remain elevated for longer than typical domestic wealth manager cycles.
China’s pension reforms and rising household savings demand are generating the AUM growth that underpins AMP’s earnings trajectory, but they are occurring against a K-shaped macroeconomic backdrop where the export and technology sectors diverge sharply from a property sector still contracting after years of stress.
Capital-light economics and why China profit carries outsized valuation weight
The guidance numbers tell you what AMP earns from China. The structure tells you why each dollar of that income is worth more to the valuation than an equivalent dollar from domestic operations.
AMP participates in the China pension market via partnership economics, specifically fees and distribution income, rather than as a fully licensed onshore operator. It holds a 19.99% stake in CLPC. That means AMP captures profit without committing the balance sheet intensity that its domestic banking and legacy insurance operations require.
The contrast:
- China partnership model: capital-light, fee-driven, no direct balance sheet risk, minority stake participation
- Domestic banking and insurance: capital-intensive, regulated balance sheet requirements, higher cost of each incremental dollar of profit
The margin quality assessment here is an analytical inference based on the partnership structure rather than a directly disclosed figure. But the logic is straightforward: if the capital commitment is low relative to the profit generated, the return on equity from China is likely to be materially higher than from domestic segments.
For anyone evaluating whether today’s 9.8% move is justified, the question is not just how much China earns but how much capital AMP deployed to earn it. The answer, based on the partnership model, is considerably less than comparable domestic profit streams. If investors are pricing the China contribution at a higher multiple than domestic operations, the re-rating has analytical logic behind it.
Where AMP’s move fits inside the ASX financials rally on 16 July 2026
AMP was not the only financial stock that had a strong day. The broader sector provided a tailwind, but the company-specific catalyst did the heavy lifting.
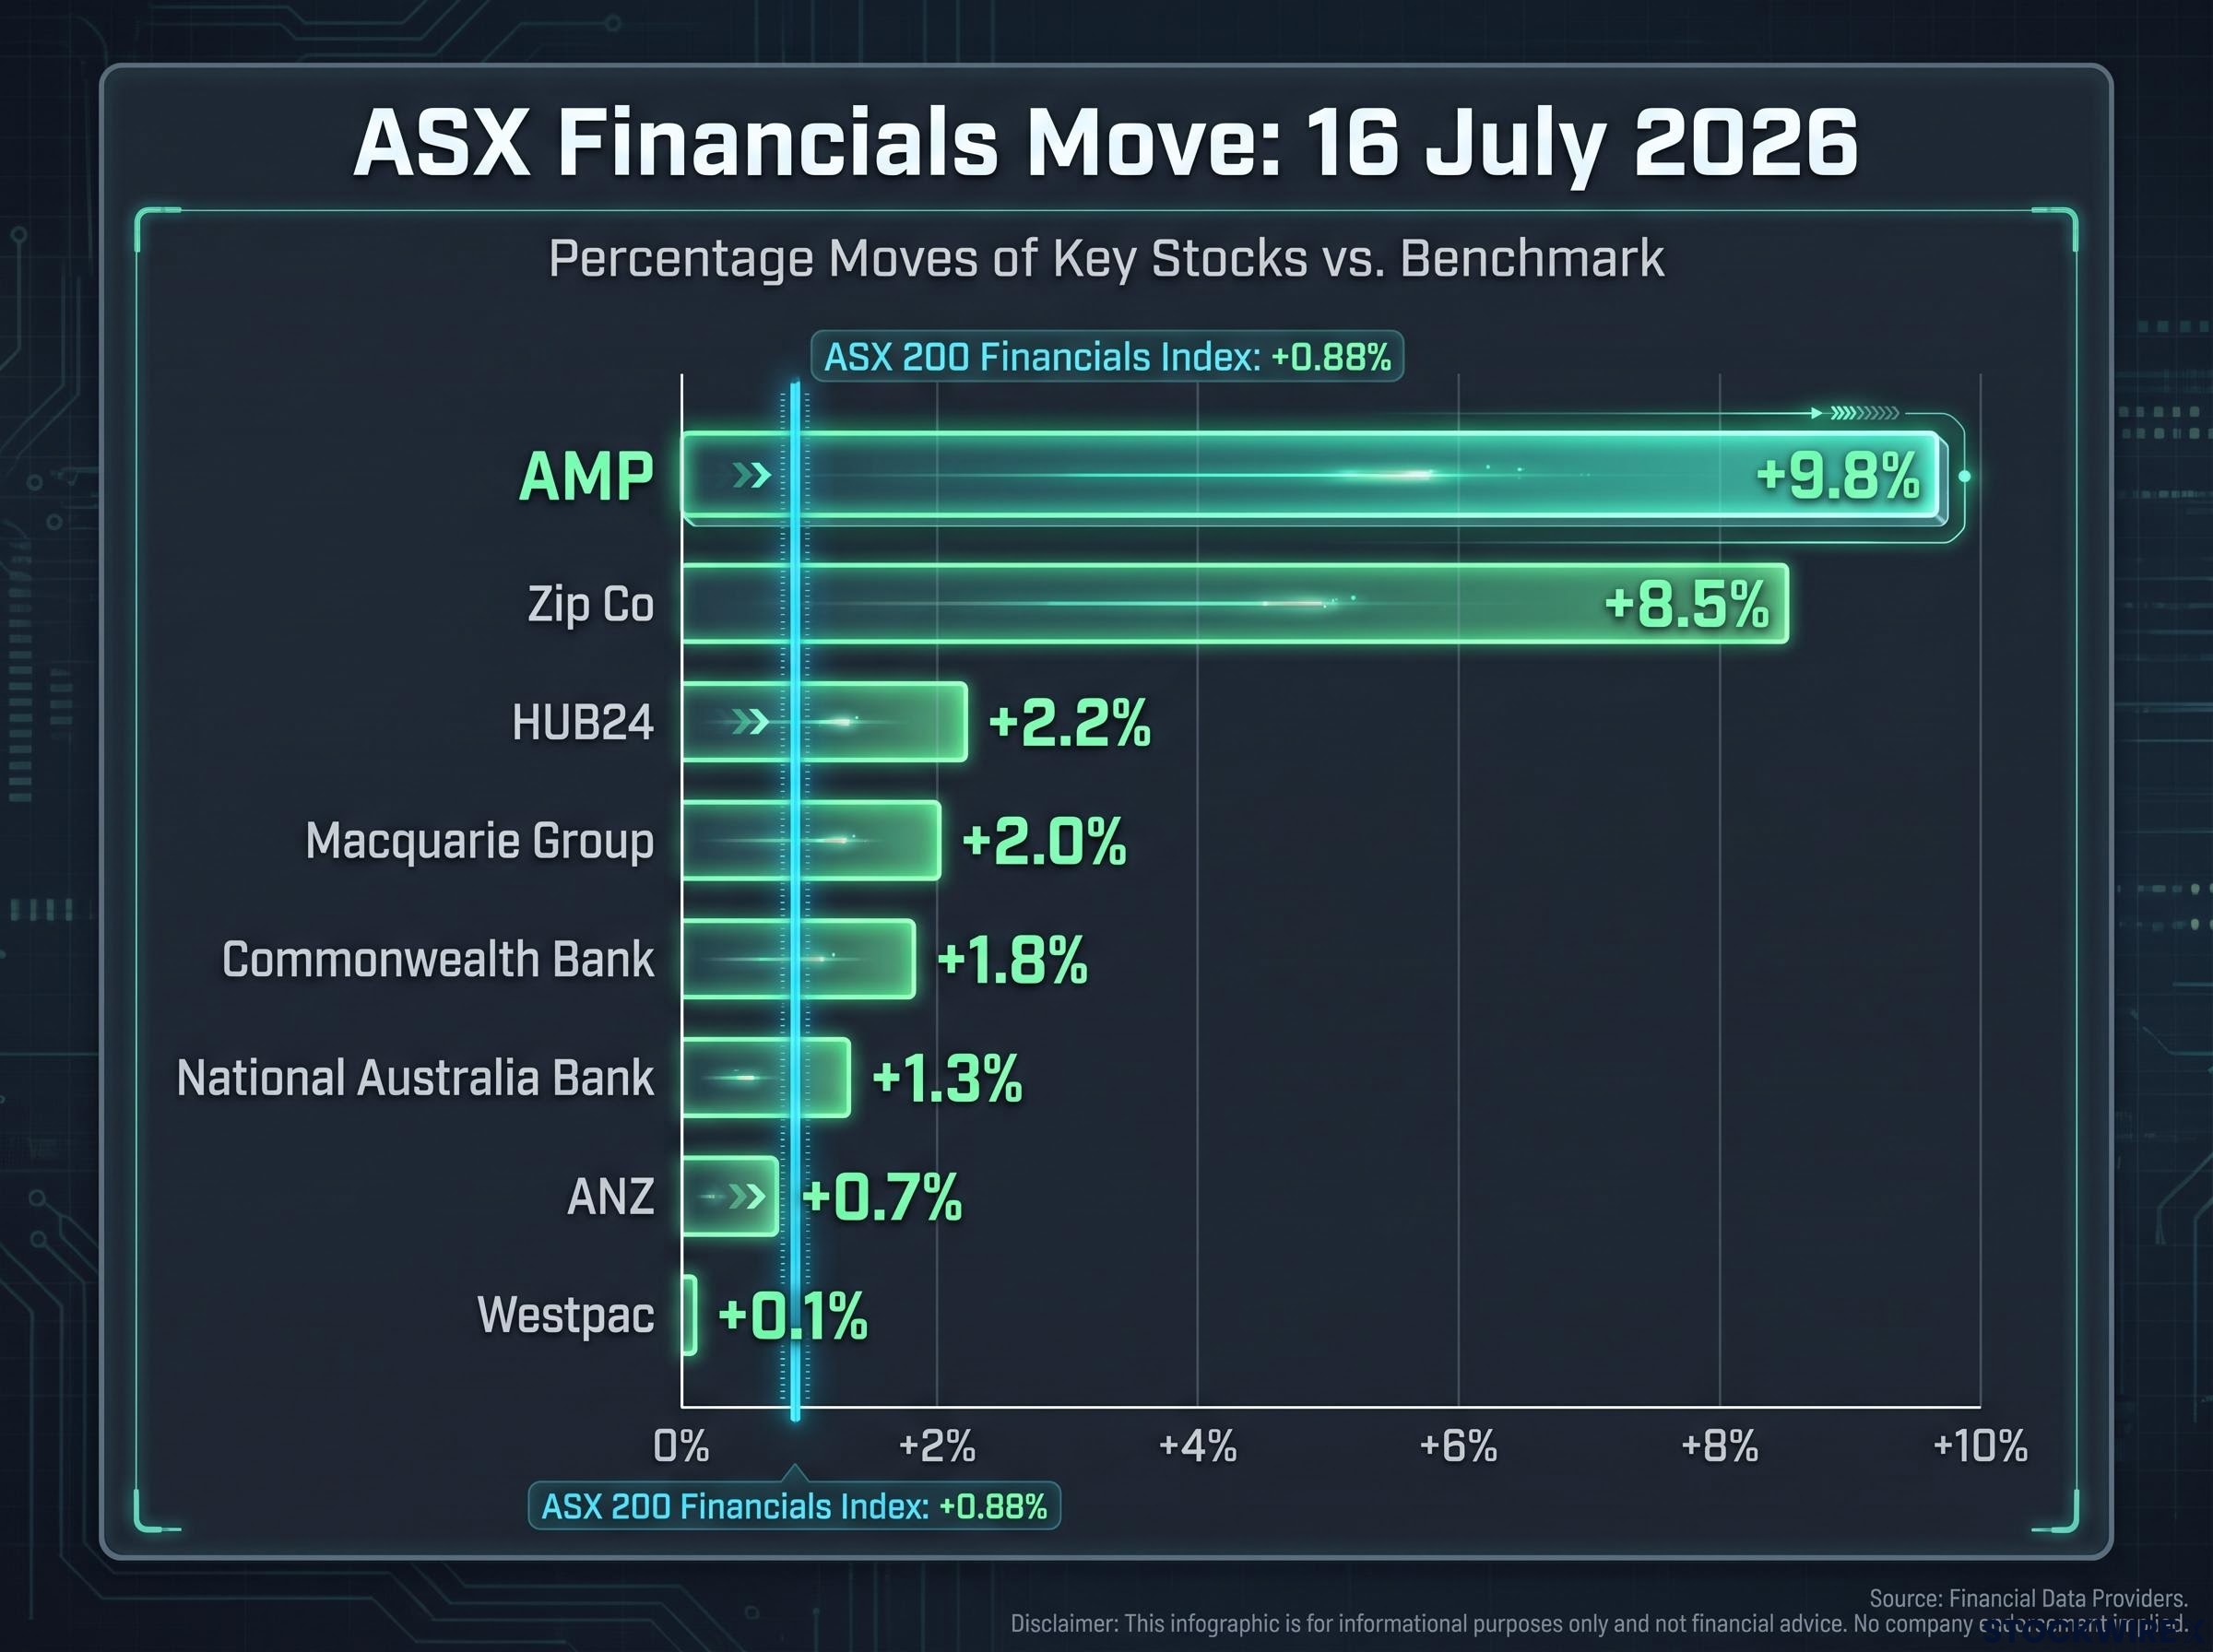
| Stock / Index | Move | Price / Level |
|---|---|---|
| ASX 200 Financials Index | +0.88% | 9,698.3 |
| Commonwealth Bank | +1.8% | — |
| National Australia Bank | +1.3% | — |
| ANZ | +0.7% | — |
| Westpac | +0.1% | — |
| Macquarie Group | +2.0% | All-time record high |
| HUB24 | +2.2% | — |
| Zip Co | +8.5% | — |
| AMP | +9.8% | $1.90 |
The financials index posted a 0.88% advance, with the sector drawing in funds that moved out of materials. Macquarie hit a record high. Zip Co surged 8.5%. The sector had broad strength.
But the sector’s best performers topped out at roughly 2% among the major banks. AMP’s 9.8% move was nearly five times the sector average. That gap tells you the guidance upgrade was the primary driver, with the macro rotation providing a favourable backdrop rather than the cause.
The broader ASX financials sector has been producing differentiated outcomes across individual stocks in 2026, with Challenger, Macquarie, and QBE each reaching 52-week highs in the same week the index fell 0.4%, driven by entirely separate structural catalysts rather than uniform sector momentum.
Separately, the S&P/ASX 200 Consumer Discretionary Sector Index climbed 1.09% to 4,036.1, with the Melbourne Institute’s June 2026 inflation expectations reading pulling back to 4.7% per annum from 5.5% in May 2026, a shift that eased pressure on household spending confidence even though the figure remains well above the RBA’s 2-3% target band. That reading lifted household spending confidence, but it was a different story from AMP’s.
What AMP’s China growth story means and what the risks look like from here
The bull case is clearly articulated by the numbers. The question now is what could disrupt it. Three watchpoints matter most between now and the full 1H26 results release:
- China contribution confirmation. The projected $56 million 1H26 figure is drawn from a company announcement. Full results will confirm whether the trajectory holds or whether execution details introduce downside.
- CLPC AUM trajectory. AUM grew approximately 17% in FY25. If that growth rate decelerates sharply, the profit growth rate follows.
- Management commentary on capital allocation. How clearly does AMP’s leadership articulate China’s role in dividend policy, capital returns, and long-term strategic weighting?
A fourth, quieter variable sits underneath: whether AMP’s domestic wealth platform and banking operations can hold share in Australia’s compulsory superannuation system, or whether the China growth story risks masking stagnation at home.
The guidance upgrade arrives alongside a completed $150 million on-market buyback that retired approximately 99 million shares at an average of $1.52 each, and AMP’s capital return strategy now hinges on whether the 6 August 2026 results prompt management to announce a follow-on buyback or lift the dividend.
AMP’s 1H26 guidance figures are prospective disclosures from a company announcement. Full results will confirm whether the trajectory holds.
The combination of a 22.2% one-month gain and a guidance figure that remains unconfirmed by final results means the good news is largely in the price. If the full results disappoint on execution, the downside could be sharp.
This article is for informational purposes only and should not be considered financial advice. Investors should conduct their own research and consult with financial professionals before making investment decisions.
AMP’s 1H26 guidance figures are prospective disclosures. Past performance does not guarantee future results, and financial projections are subject to market conditions and various risk factors.
What the re-rating changes, and what it leaves unresolved
Today’s move established something specific: AMP’s earnings mix has structurally shifted. China partnerships have moved from adjunct to pillar, growing from $47 million in FY24 to $72 million in FY25, with a projected $56 million in the first half of 2026 alone. The guidance upgrade gave the market a number to price, and it priced it aggressively.
What remains open is whether the 1H26 results confirm the trajectory and add colour on the multi-year runway. The 26.7% one-year gain reflects cumulative investor reassessment; today’s 9.8% added the largest single-day increment since 2024.
The distinction that matters for anyone making a decision here is precise: the structural earnings shift is now supported by quantitative evidence across multiple reporting periods. The 1H26 delivery, including whether CLPC AUM growth holds in the mid-teens and whether management gives forward guidance on China’s capital allocation role, is still prospective. That is the dividing line between conviction and speculation, and it is the line worth watching before the full results arrive.