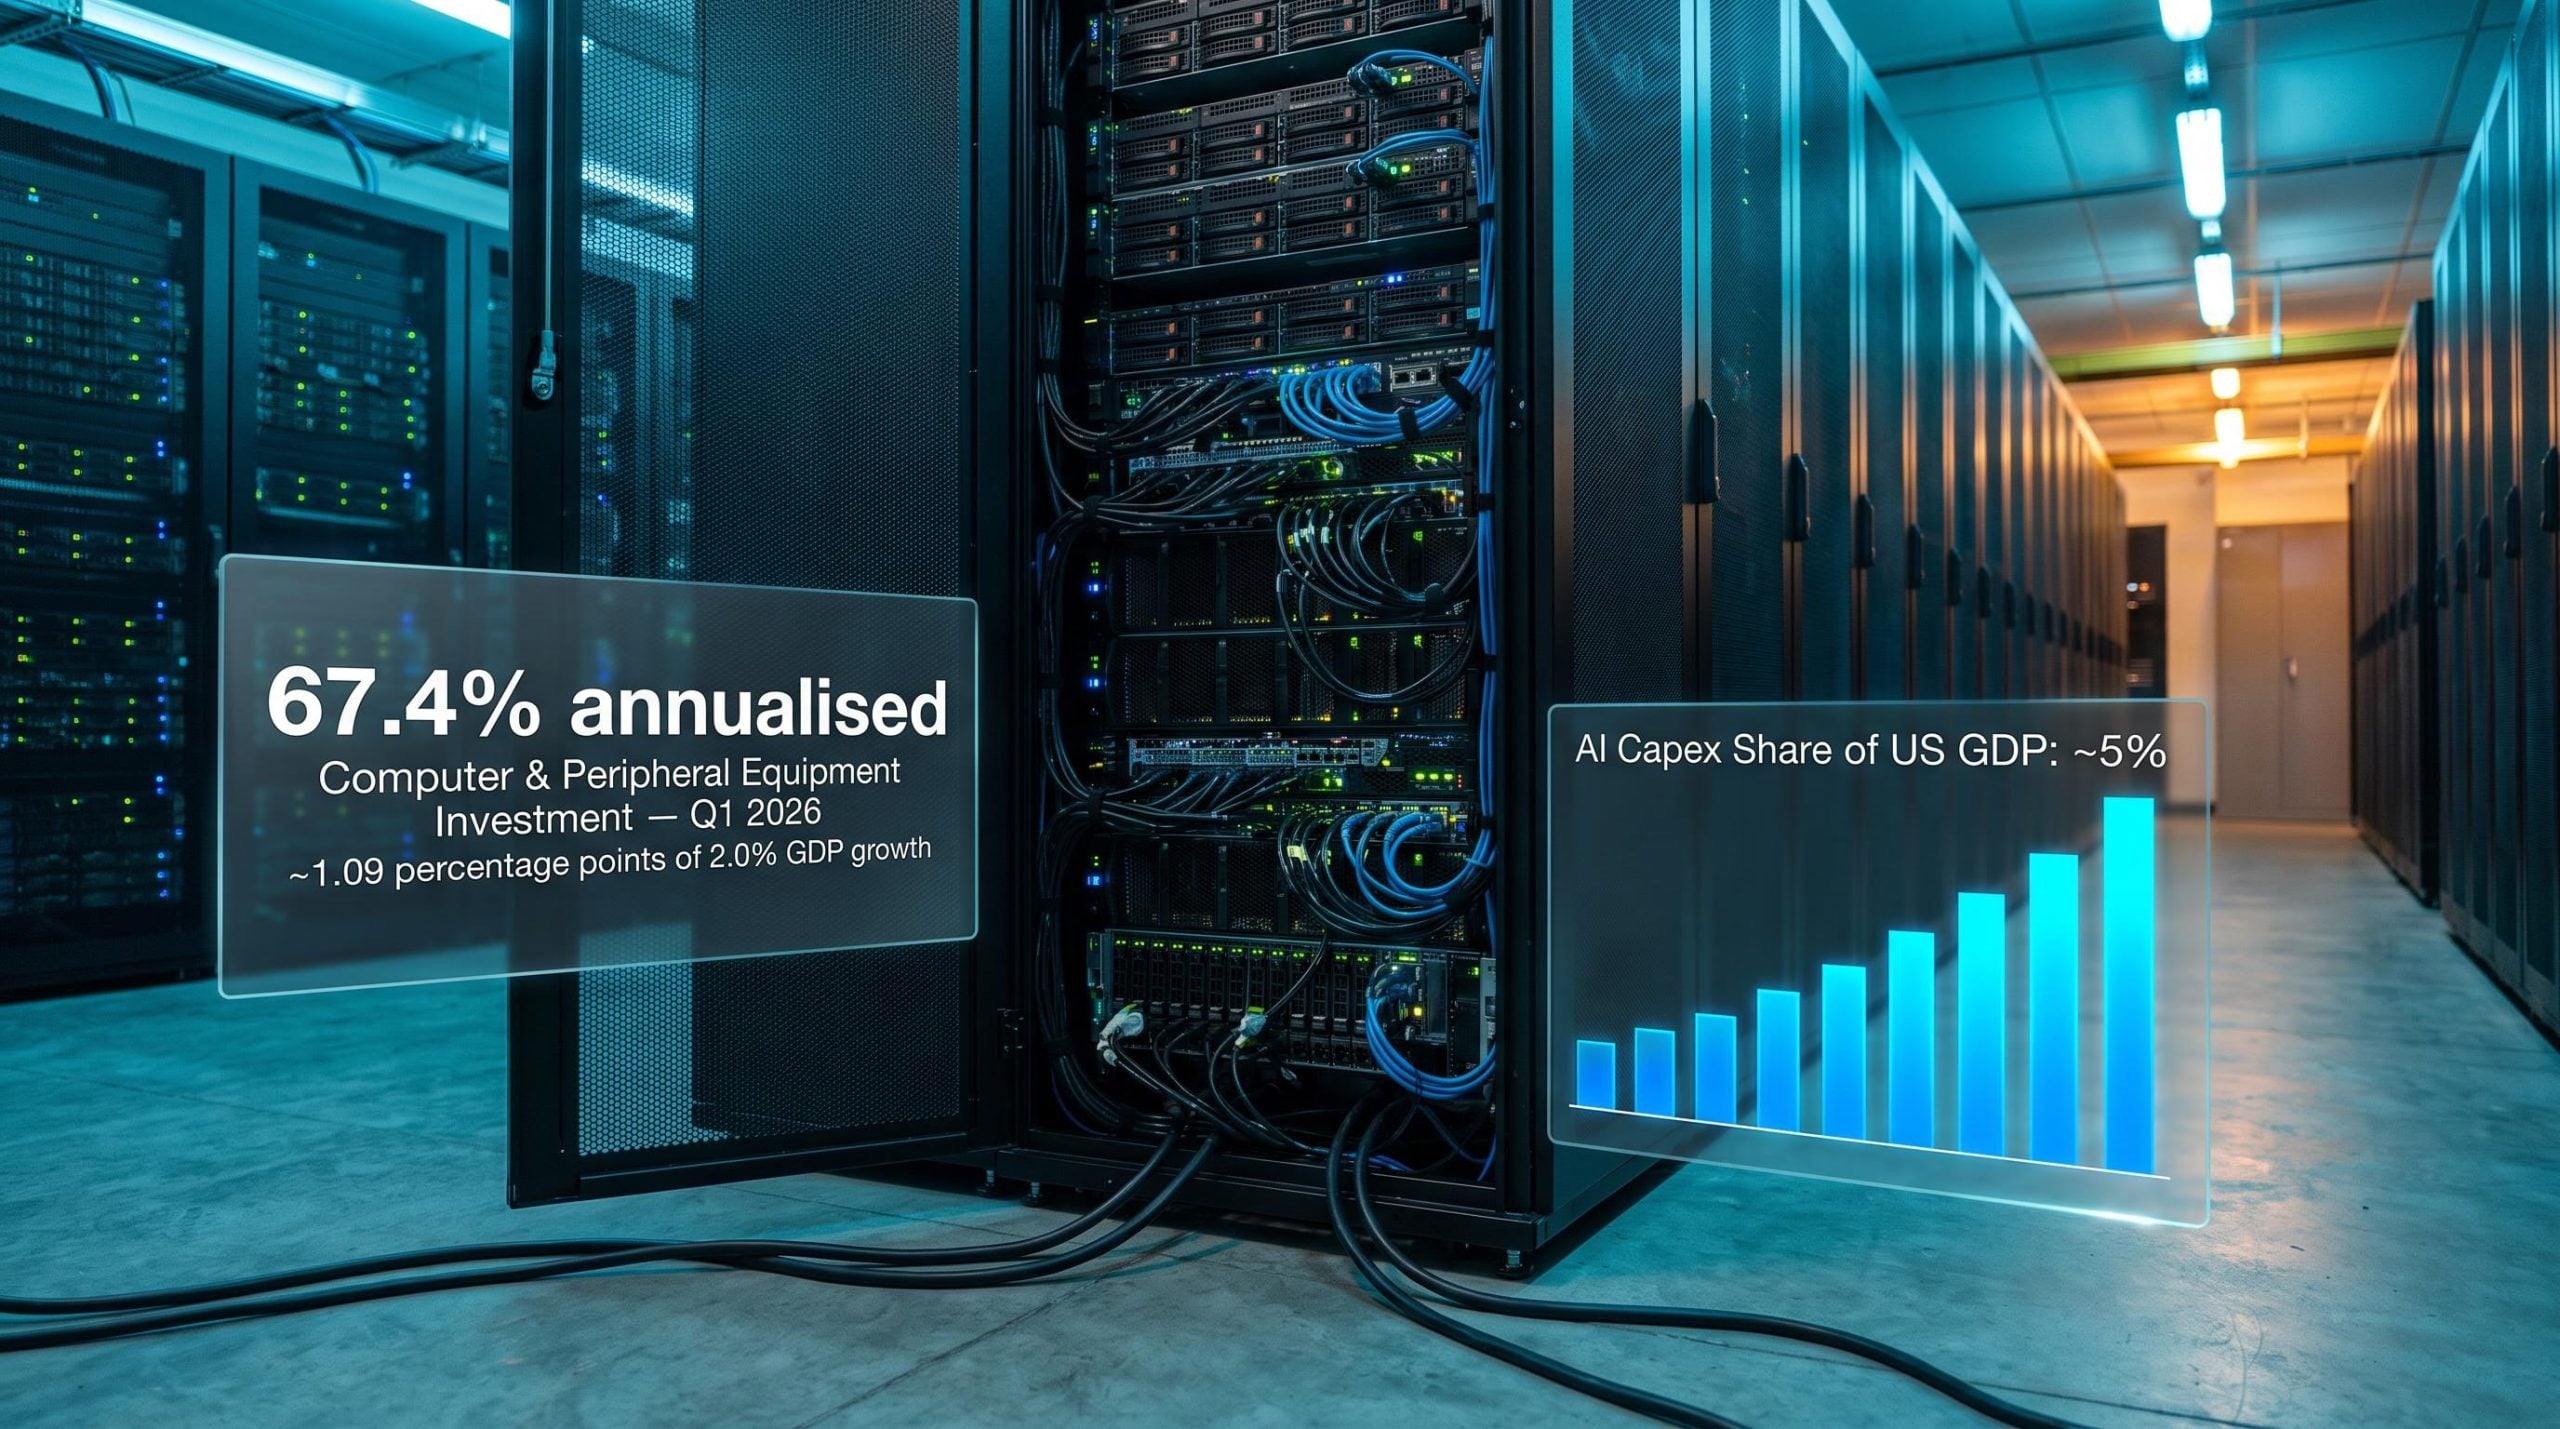
Computer and peripheral equipment investment grew at a 67.4% annualised rate in Q1 2026. That is not a typo, and it is not a narrow category quirk. It is the single fastest-growing line item in the Bureau of Economic Analysis GDP accounts, and it is almost entirely a story about artificial intelligence.
AI infrastructure investment has scaled past the point where it belongs in a technology section. Together, computer equipment and software spending contributed approximately 1.09 percentage points to a 2.0% headline GDP growth rate last quarter, meaning roughly half of all US economic output growth came from categories where AI is the dominant demand driver. The Federal Reserve, under new Chairman Kevin Warsh, has responded by launching five internal working groups, one of which is explicitly tasked with evaluating the productivity implications of emerging technologies.
Here is what this analysis gives you: a framework for evaluating two competing futures. In one, AI capex validates itself through productivity gains and the investment boom becomes a durable growth engine. In the other, spending front-loads demand without delivering supply-side improvement, and a correction follows. The data tells you which signals to watch.
The numbers that made the Fed pay attention
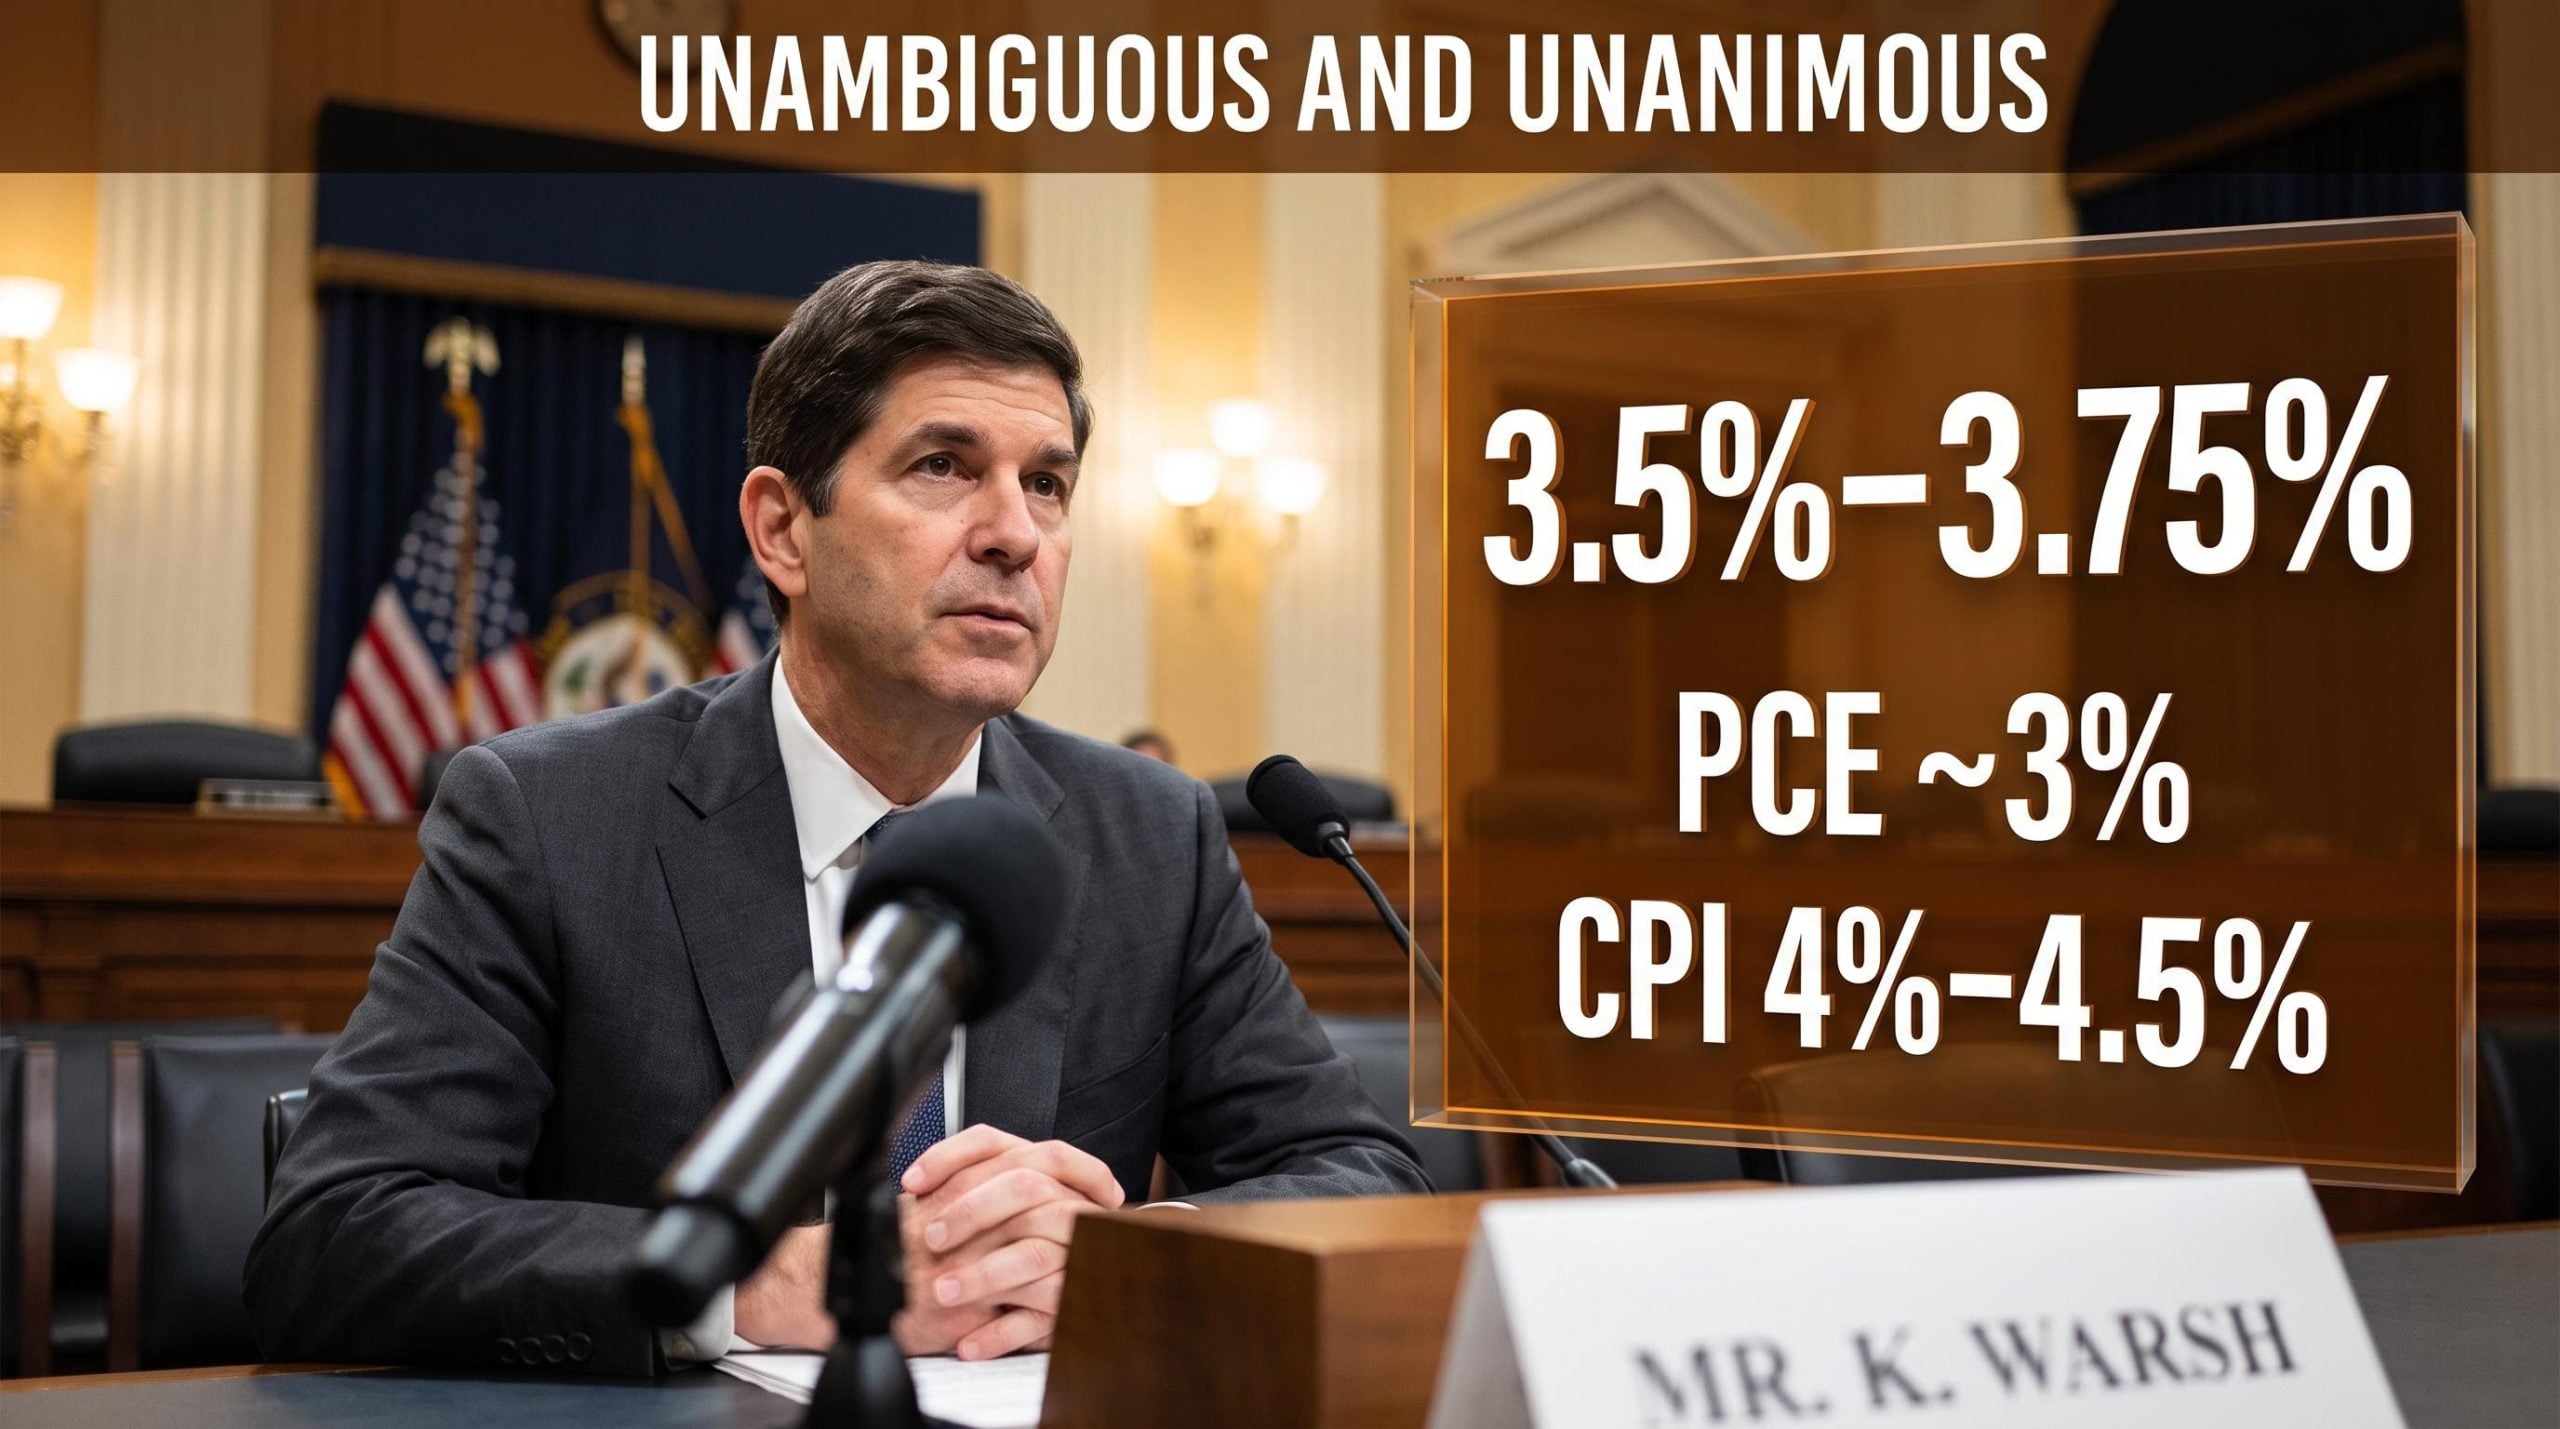
Appearing before the House Financial Services Committee on 14 July 2026, Fed Chairman Kevin Warsh pointed to business investment as the defining feature of the current economic moment, with data centre construction and surging demand for AI-related equipment cited as the primary forces behind it. The scale of that investment, when broken into tiers, reveals just how concentrated the current capex cycle has become.
Warsh’s July 2026 congressional testimony before the House Financial Services Committee provides the primary source for the Fed’s characterisation of data centre construction and AI equipment demand as the defining features of the current business investment cycle.
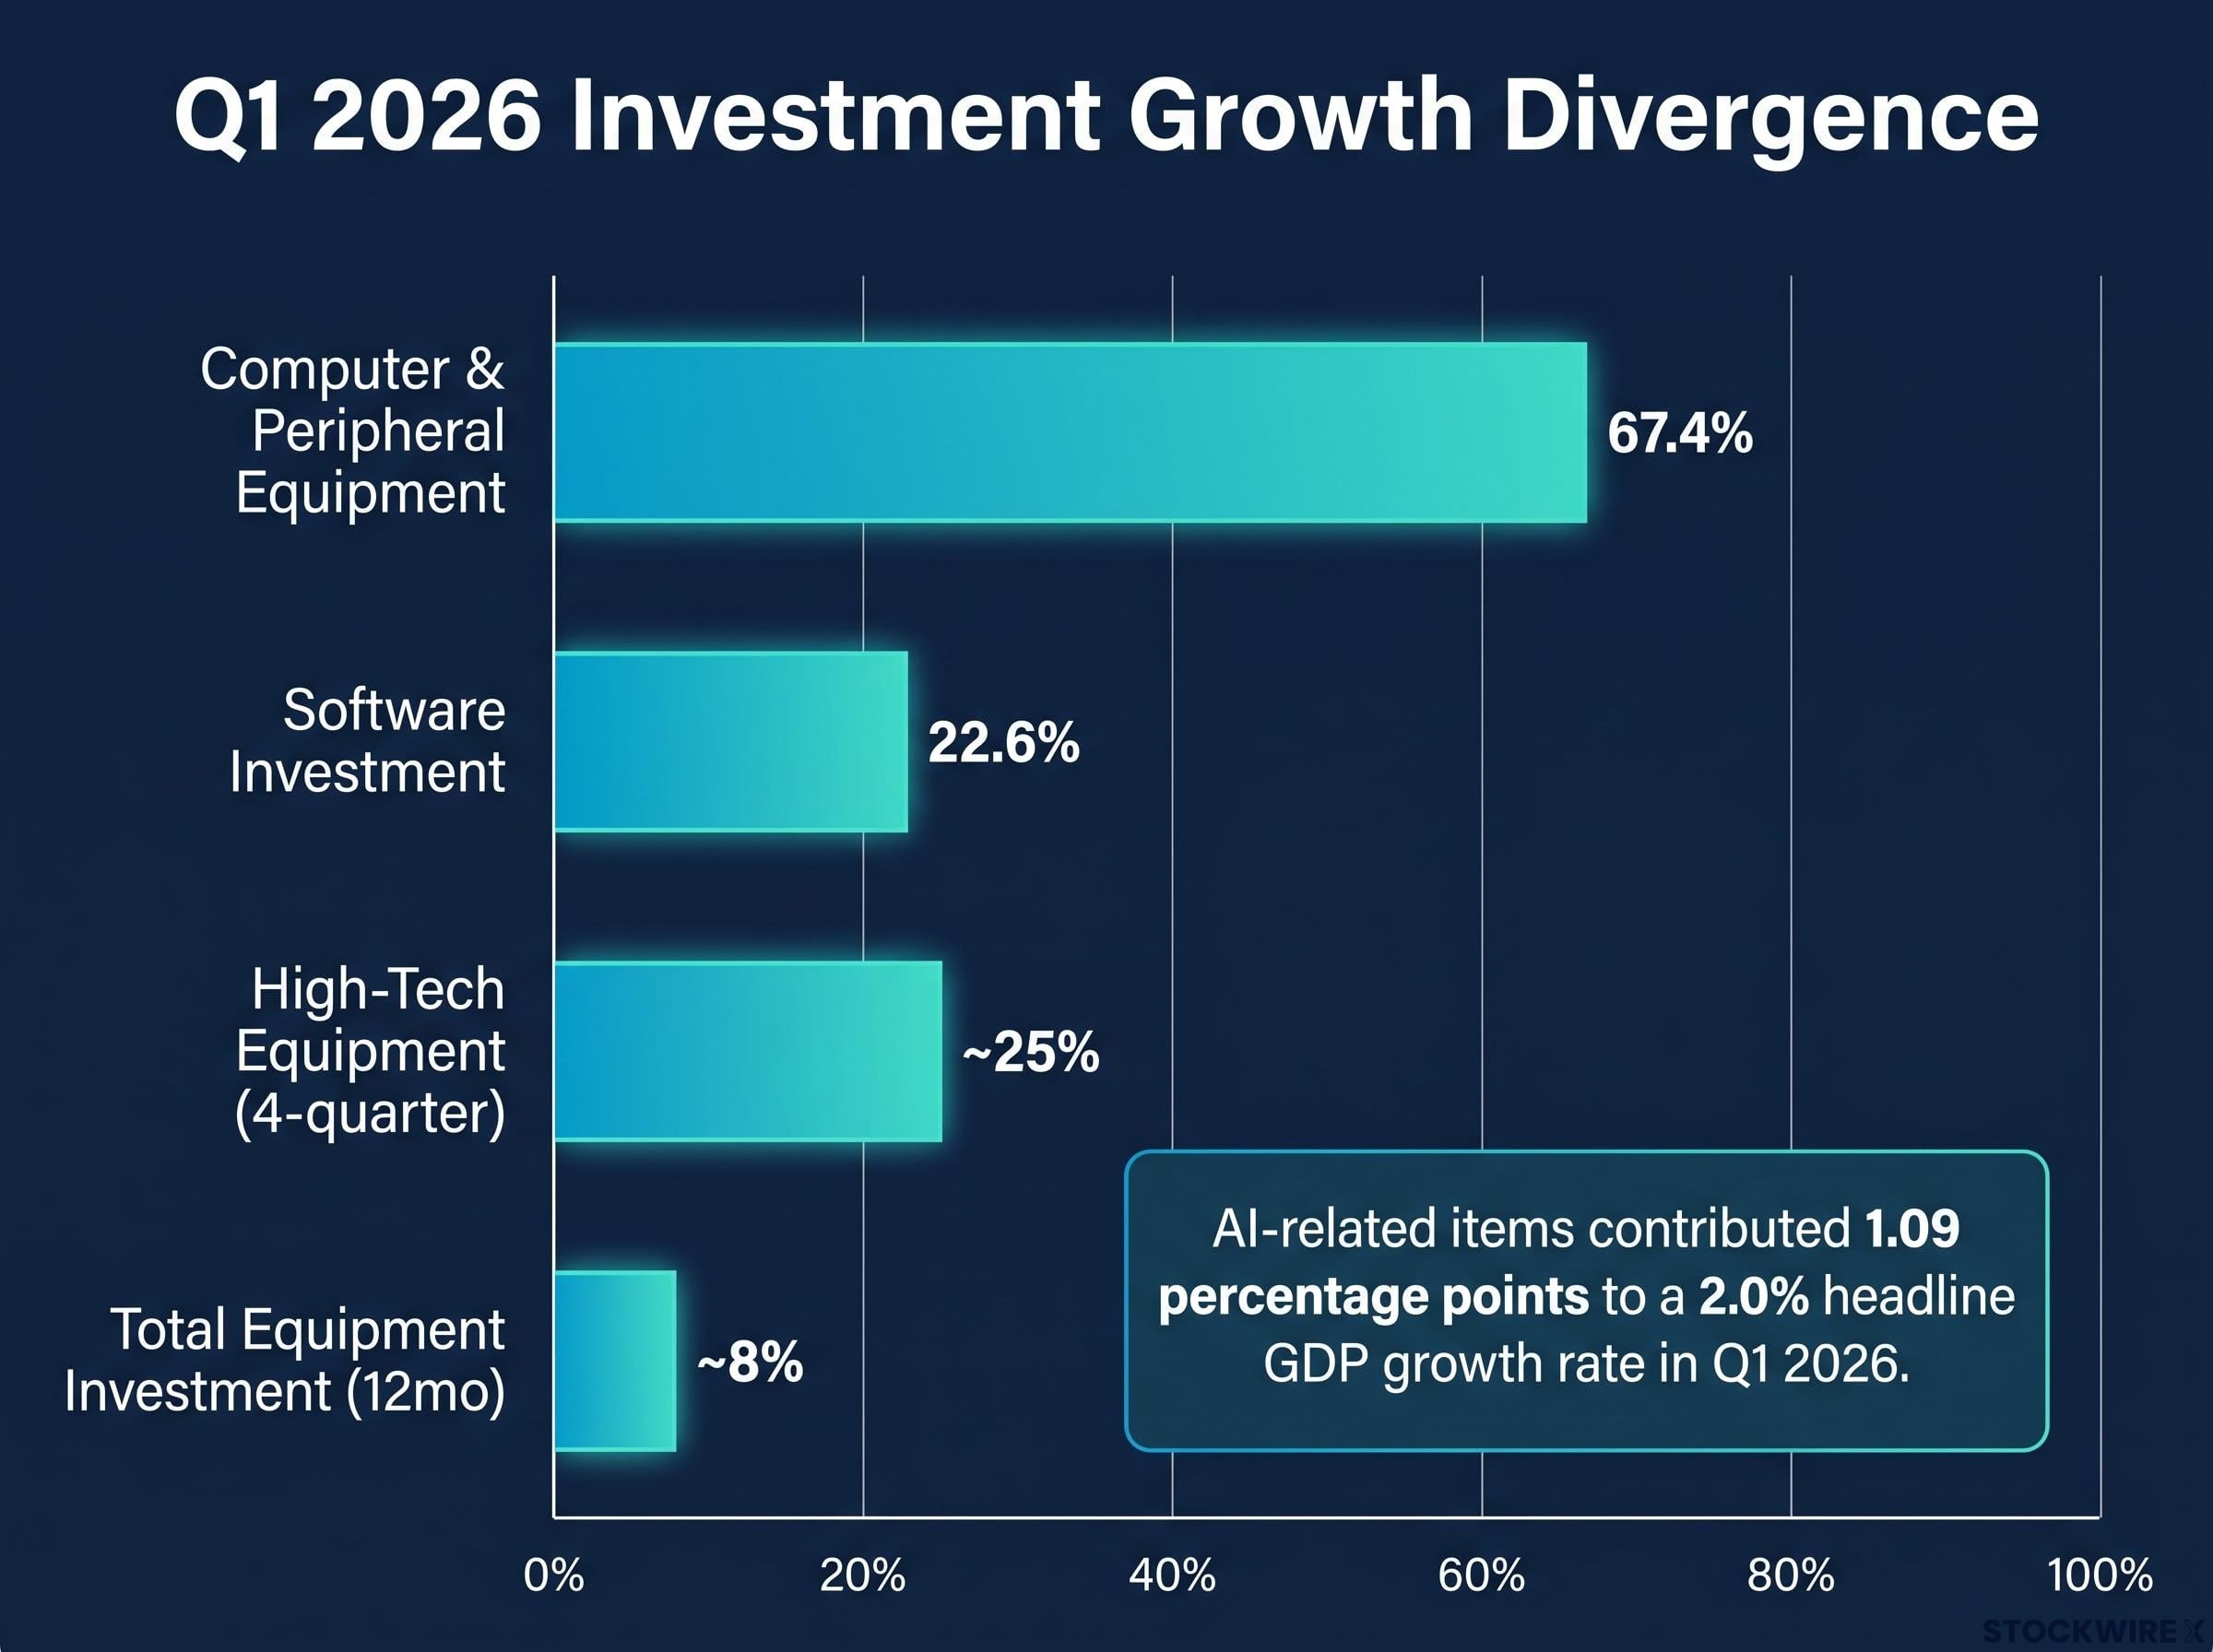
| Category | Growth Rate | Timeframe | Source |
|---|---|---|---|
| Total equipment investment | ~8% | 12 months ending Q1 2026 | Warsh testimony |
| High-tech equipment | ~25% | 4-quarter trailing basis | Warsh testimony |
| Computer and peripheral equipment | 67.4% annualised | Q1 2026 | BEA decomposition |
Software investment added another 22.6% annualised in the same quarter. Forrester’s 2026 US technology spending forecast, projecting 8.3% growth to $2.9 trillion, confirms the pattern from a different angle: computer equipment alone is forecast to grow 25% year-over-year, driven by unprecedented demand for AI-optimised servers.
The BEA’s Q1 2026 GDP third estimate formally attributes the investment acceleration to information processing equipment, with computers and peripheral equipment identified as the primary contributor to the outsized fixed investment figures underpinning the quarter’s headline growth.
The divergence ratio is the defining feature. AI infrastructure is growing roughly three times faster than the broader equipment category. That gap has turned a technology trend into a macroeconomic event.
AI-related line items contributed approximately 1.09 percentage points of a 2.0% headline GDP growth rate in Q1 2026. A single investment theme is now responsible for roughly half of a full quarter of US economic output growth.
That concentration is precisely what makes this a monetary policy question, not just a market one.
When big ASX news breaks, our subscribers know first
What is actually being built, and who is paying for it
The numbers above represent physical things: GPUs, servers, data centres, power delivery systems, cooling infrastructure, and the supply chain nodes around them.
- GPUs and AI-optimised processors
- Server racks and storage infrastructure
- Data centre shells and fit-outs
- Power generation and grid connections
- Cooling and thermal management systems
- Semiconductor fabrication equipment
Combined hyperscaler capex estimates for 2026 range from $400 billion to $725 billion, with approximately 75% of the upper estimate (roughly $545 billion) directed specifically to AI infrastructure. Global data centre spending is projected by Gartner to exceed $650 billion in 2026, up 31.7% year-over-year. Server spending alone is growing 36.9% year-over-year. Semiconductor equipment billings hit a record $36.55 billion in Q1 2026.
Data centre construction is up 30% year-over-year and has tripled over three years as of mid-2025.
The structural detail that separates this cycle from most historical parallels is the balance sheet behind the spending. The buyers are a relatively small set of hyperscaler platforms, among the most profitable firms in corporate history, financing the buildout primarily from operating cash flow. This is not speculative debt funding pre-revenue companies. That distinction matters directly for how much financial-stability risk you should assign to the current pace of spending; the risk of a debt-driven systemic crisis is substantially lower than it would be if the financing structure resembled the late 1990s.
Why this cycle rhymes with the 1990s but does not repeat it
AI capital formation at approximately 5% of US GDP is the highest share since the late-1990s telecom and internet buildout. Analysts at IDC and Gartner are explicitly using supercycle language. The parallel is genuine, and it is worth understanding exactly where it holds and where it breaks.
Prior technology investment peaks, including the dot-com era at approximately 4.2% of GDP and the cloud buildout at 3.8%, have now both been surpassed, with US IT hardware and software spending reaching a record 4.9% of GDP in Q1 2026 and the Stargate Project adding a further $500 billion in sovereign-scale data centre commitments.
Three structural differences separate the current cycle from the 1990s:
- Financing source. The 1990s buildout was substantially financed through speculative debt across a fragmented field of companies. The current cycle is funded by operating cash flow from a concentrated group of extraordinarily profitable firms.
- Buyer concentration. A small number of hyperscalers are driving the bulk of global AI compute investment, compared to the scattered, venture-backed field that characterised late-1990s telecom capex.
- Revenue base. The companies making these investments already operate the world’s largest cloud and advertising platforms. They are not pre-revenue startups building infrastructure ahead of any proven business model.
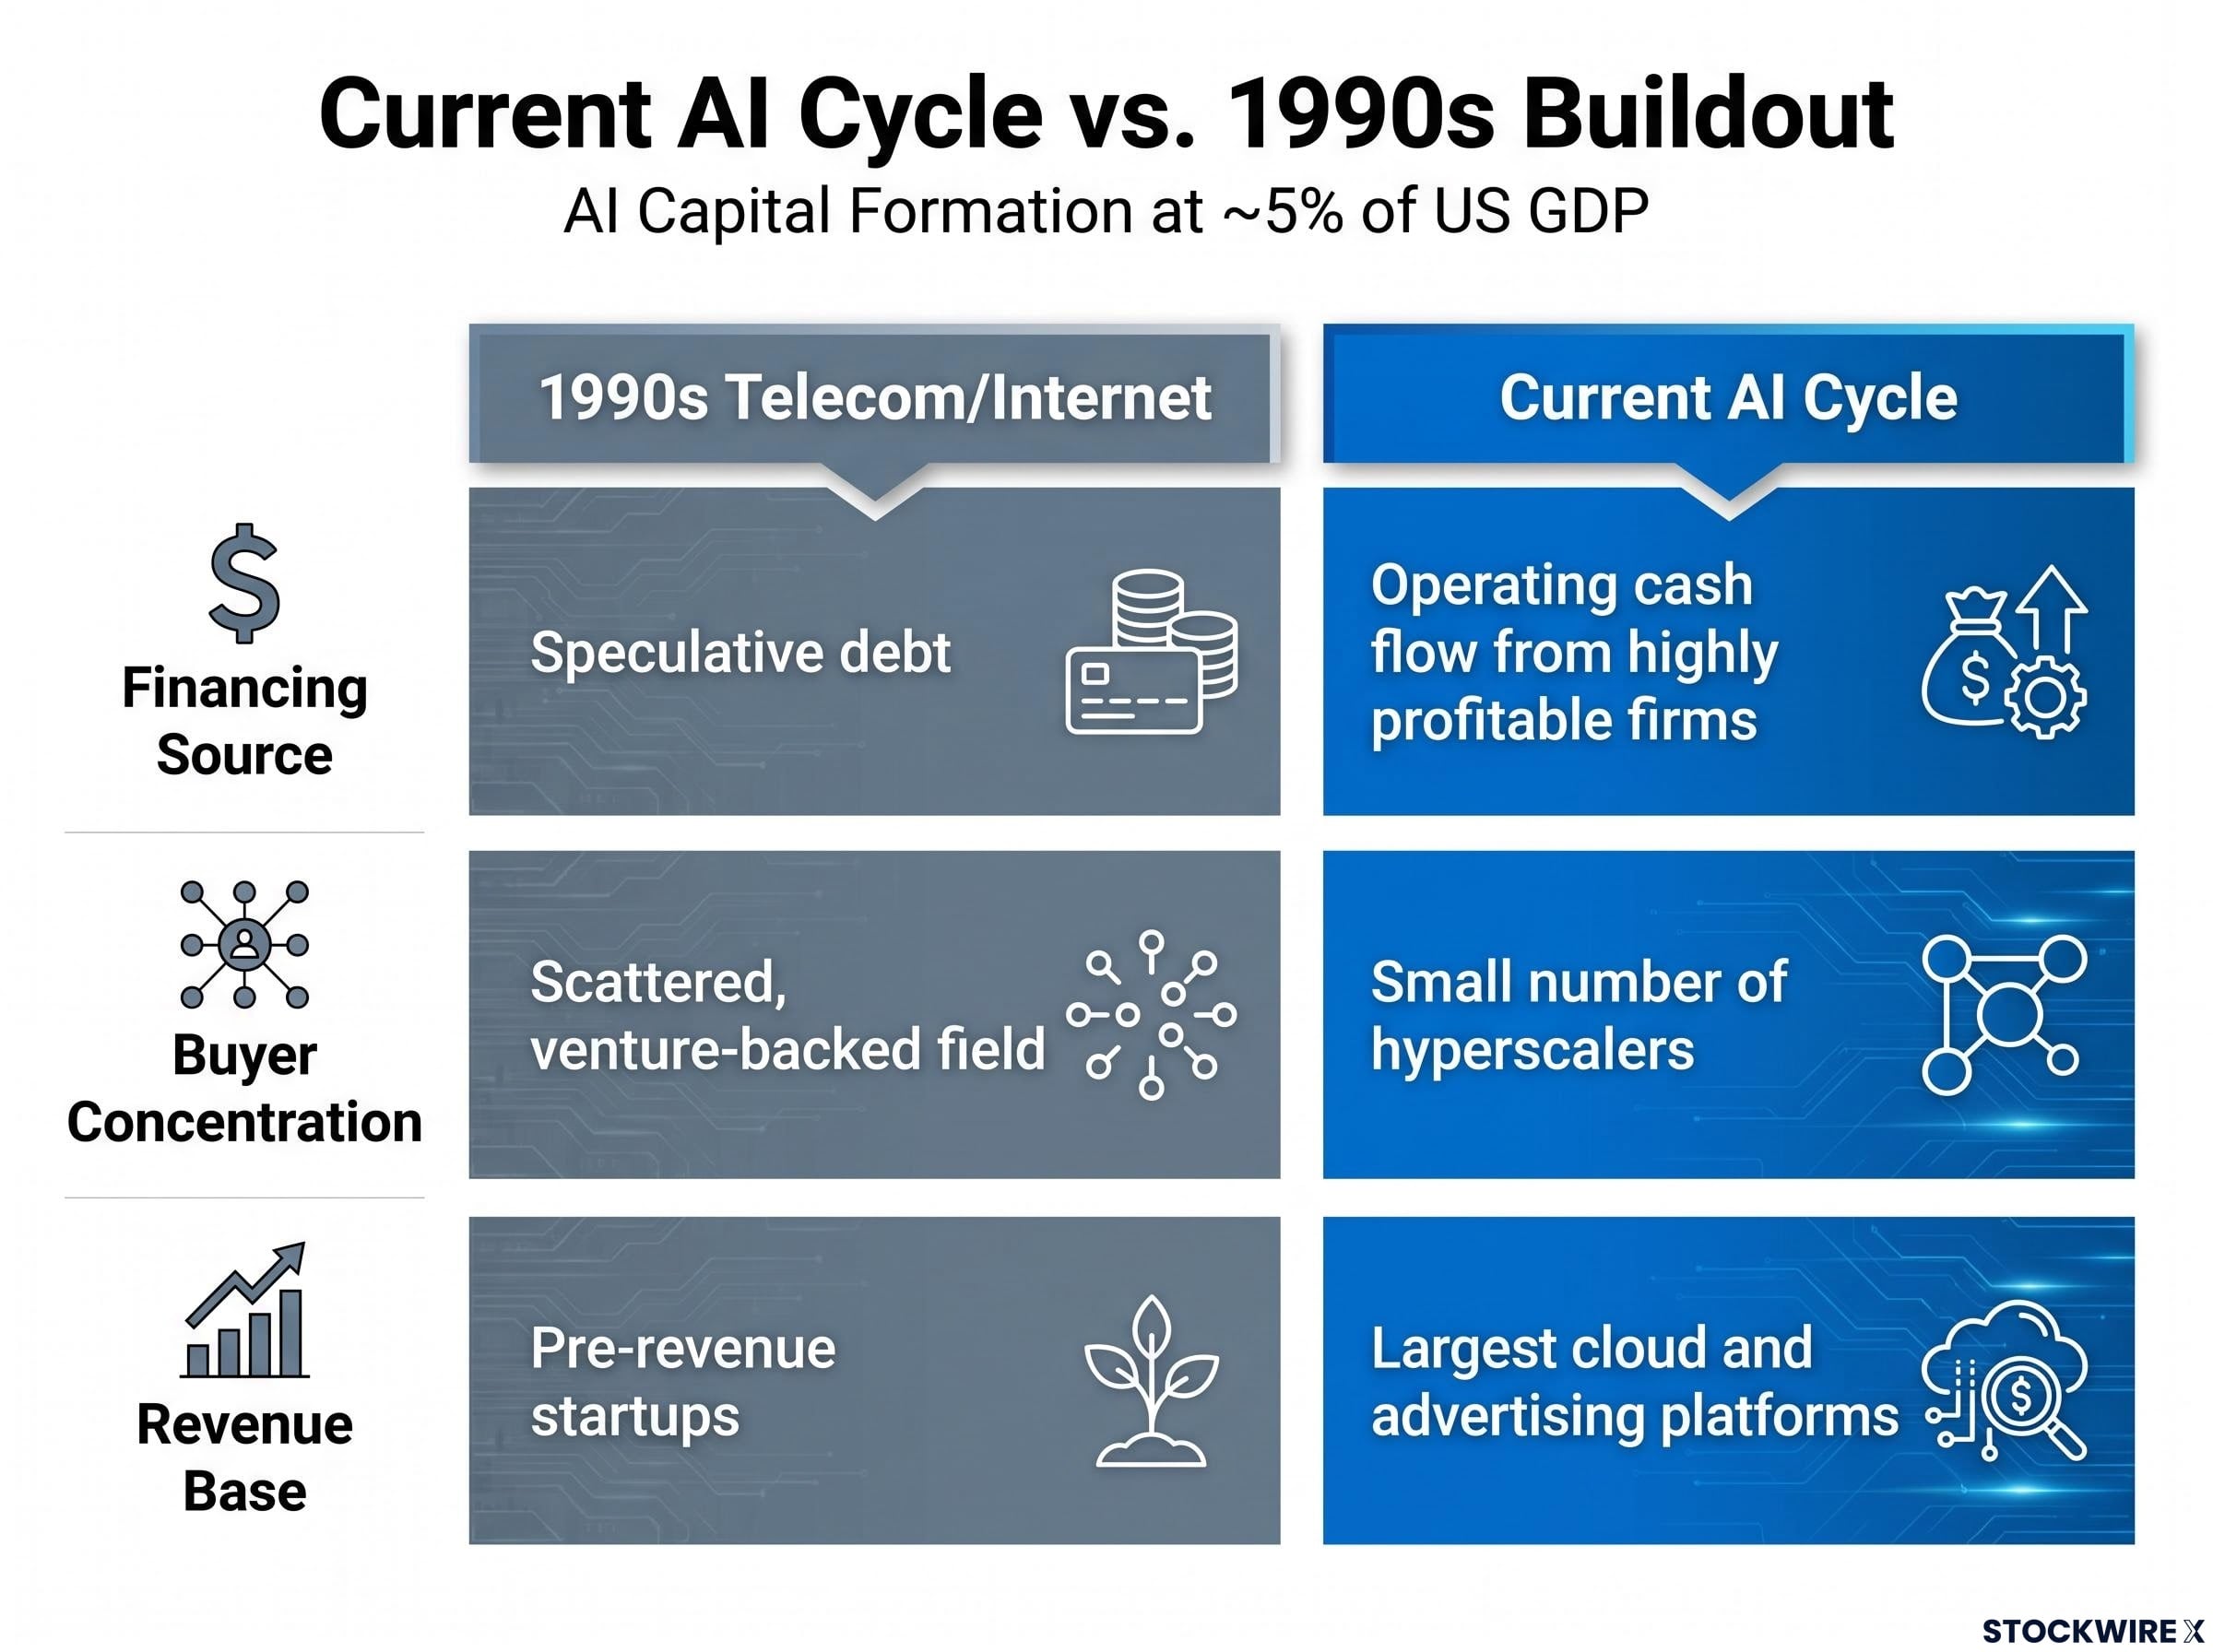
Those differences are real. They change the financial-stability calculus meaningfully. But they do not eliminate the one 1990s risk that remains live regardless of who is writing the cheques.
The one 1990s risk that has not gone away
Profitable-company financing does not immunise a cycle against overbuild. It changes who absorbs the write-downs if demand assumptions prove wrong, but it does not prevent the overshoot itself.
Deloitte’s baseline scenario quantifies this risk directly: real business investment is projected to decline 3.2% in 2027 and 0.7% in 2028 as firms reassess realised demand for AI-related products and services. Even Gartner, while documenting rapid infrastructure growth, continues to flag AI bubble concerns within its own projections.
The correct frame is not “this is 1999 again.” It is a capex cycle risk embedded within otherwise resilient balance sheets: a demand front-loading scenario where large, profitable companies overshoot productive capacity and pull back, creating a cyclical correction rather than a systemic one.
How the AI capex surge is reshaping equity market structure
The capital flowing into AI infrastructure has already reshaped equity market returns. The Magnificent Seven megacap technology companies accounted for roughly 42% of the S&P 500’s 17.9% return through Q1 2026, with AI capex cited as a primary driver.
| Sector | 2025 Full-Year Return | Primary AI Capex Exposure |
|---|---|---|
| Communication Services | 33.4% | Cloud platforms, AI model deployment |
| Information Technology | 24% | Semiconductors, hardware, enterprise software |
Market breadth has narrowed around AI-adjacent leaders, and the direct beneficiaries are richly valued. The less-priced opportunity set sits in the second-order infrastructure layer:
Index concentration risk from the Magnificent Seven is more acute than headline returns suggest: low benchmark volatility masks a distributional divergence where large opposing moves by individual winners and losers cancel each other out, leaving investors exposed to single-stock risk they may believe they have diversified away.
- Power delivery and grid modernisation
- Cooling and thermal management
- Utilities serving data centre clusters
- HVAC and battery storage suppliers
- Physical construction and fit-out contractors
Data centre construction is up 30% year-over-year with strong downstream demand across these categories. Warsh noted in testimony that the label “AI investment” is likely to shed its novelty over time, folding into what markets and analysts simply call investment. That normalisation is not a distant prospect. Organisations are already shifting from exploratory AI pilots to production-scale deployments, emphasising scalability, reliability, and cost control.
What this tells you is that the re-rating of AI-exposed equities toward standard fundamentals is an active process, not a future risk. The allocation question is which companies benefit from structural demand versus which still carry a novelty premium that compresses as the category matures.
Ecosystem ownership and embedded switching costs, rather than the hardware versus software distinction, are the variables that actually determine which AI infrastructure companies compound value through the cycle, with Nvidia’s developer ecosystem cited as the clearest current example of hardware that behaves like a platform.
The Fed’s new working groups and the productivity question they cannot yet answer
Warsh’s congressional testimony announced five internal working groups, and their scope tells you how seriously the Fed is treating the current environment as an analytical challenge, not just a policy one.
- Fed communications practices
- Balance sheet management policies
- Economic data sourcing
- Productivity implications of emerging technologies
- Inflation targeting frameworks
The fourth group, productivity implications of emerging technologies, is the most consequential for long-run macro and market outcomes. It addresses the channel through which AI capex either validates or corrects itself economically.
Historical experience with electrification, mainframes, and the internet demonstrates that measured productivity often lagged major technology investment waves by years, sometimes by a full decade.
The productivity lag documented across prior technology waves, from electrification through mainframes to the internet, took a full decade to resolve in each case, and Bank of America’s analysis identifies five structural barriers, including legacy IT systems, workforce skills gaps, and organisational change costs, that are slowing the translation of task-level AI gains into measurable GDP growth now.
Current GDP data show large investment contributions, but broad-based productivity gains remain emergent in the data series. The Fed forming a dedicated working group on this question tells you something specific: the central bank does not yet have a reliable analytical model for distinguishing between the scenario where AI raises trend productivity and the one where it does not. That gap in institutional certainty is directly relevant to how monetary policy will be calibrated over the next two to three years.
Two futures the data cannot yet rule out
Deloitte’s scenario modelling frames the divergence clearly. In the baseline (cautionary) scenario, AI-led business investment accelerates into 2026 and then pulls back: real business investment declines 3.2% in 2027 and 0.7% in 2028 as firms reassess realised demand.
In the upside scenario, AI investment does not get overdone. Business investment continues beyond 2026, implying higher potential growth if productivity gains diffuse broadly.
The monetary policy implications diverge with them. If AI raises trend productivity, potential output rises, a higher neutral real rate is consistent with controlled inflation, and the investment boom validates itself. If productivity gains are slow or narrowly distributed, the Fed must navigate front-loaded demand without supply-side relief, a materially harder policy environment.
The next major ASX story will hit our subscribers first
What the current data can and cannot tell investors right now
The investment signal is clear. The productivity signal is not yet. That asymmetry is the analytical exposure the market is currently carrying, and three variables will resolve it first:
- Productivity data releases. BLS and BEA productivity series will be the first official sources to register whether AI capex is translating into output-per-hour improvements across sectors.
- Hyperscaler capex guidance. Quarterly earnings calls from the major cloud and AI platforms will signal whether spending is plateauing, accelerating, or showing signs of pull-forward.
- Fed working group outputs. Any formal revisions to potential output estimates or neutral rate assumptions from the productivity implications group will move both rate expectations and equity valuations.
AI capital formation at approximately 5% of US GDP is the structural reference point for scale. Deloitte’s upside scenario assumes stronger and more sustained business investment beyond 2026, implying higher potential growth if productivity diffuses broadly.
Warsh stated in testimony that “the pace and magnitude of benefits the broader economy may derive from the AI infrastructure buildout remains uncertain.”
For allocation and analytical decisions right now, the honest position is that the investment signal is confirmed and the productivity signal is not. Aligning exposure to structural infrastructure demand, rather than narrative premium, is the most defensible posture given that asymmetry.
This article is for informational purposes only and should not be considered financial advice. Investors should conduct their own research and consult with financial professionals before making investment decisions. Financial projections referenced in this article are subject to market conditions and various risk factors. Forward-looking statements regarding productivity outcomes, business investment trajectories, and policy responses are speculative and subject to change based on economic developments.
What shifts when the productivity signal finally arrives
The entire argument turns on a variable that has not yet resolved. When it does, two very different market and policy environments emerge.
If confirmed productivity gains arrive:
- Current AI capex is validated as growth-enhancing investment, not front-loaded demand
- Potential output estimates rise, supporting a higher neutral real rate with controlled inflation
- Equity re-rating extends beyond AI-adjacent leaders into broader sectors benefiting from productivity diffusion
If productivity gains are delayed or narrow:
- The dominant narrative shifts from investment supercycle to capex correction
- Deloitte’s baseline scenario, with real business investment declining 3.2% in 2027 and 0.7% in 2028, becomes the operative framework
- The Fed faces the harder policy problem of managing elevated demand without supply-side support
Warsh’s view that the AI spending category will eventually lose its distinct label, merging into ordinary investment flows, describes the normalisation endpoint regardless of which scenario plays out. The category will stop being novel. The question is whether it stops being novel because it delivered, or because it disappointed.
The Fed’s formal engagement with the productivity question is itself a signal worth tracking. The central bank is treating this as an open analytical question that will condition policy, not a resolved tailwind it can plan around. The most consequential near-term variable for both markets and monetary policy is not the current rate of AI capex, which is already known. It is the first credible productivity data that begins to indicate which future is actually unfolding.