Nvidia has compounded revenue at better than 100% annually for three years, yet the stock sits roughly 13% below its all-time high. That gap forces a question every investor holding or watching this name must answer: is $204 an opportunity created by temporary sentiment, or a warning that the market is quietly repricing the AI trade?
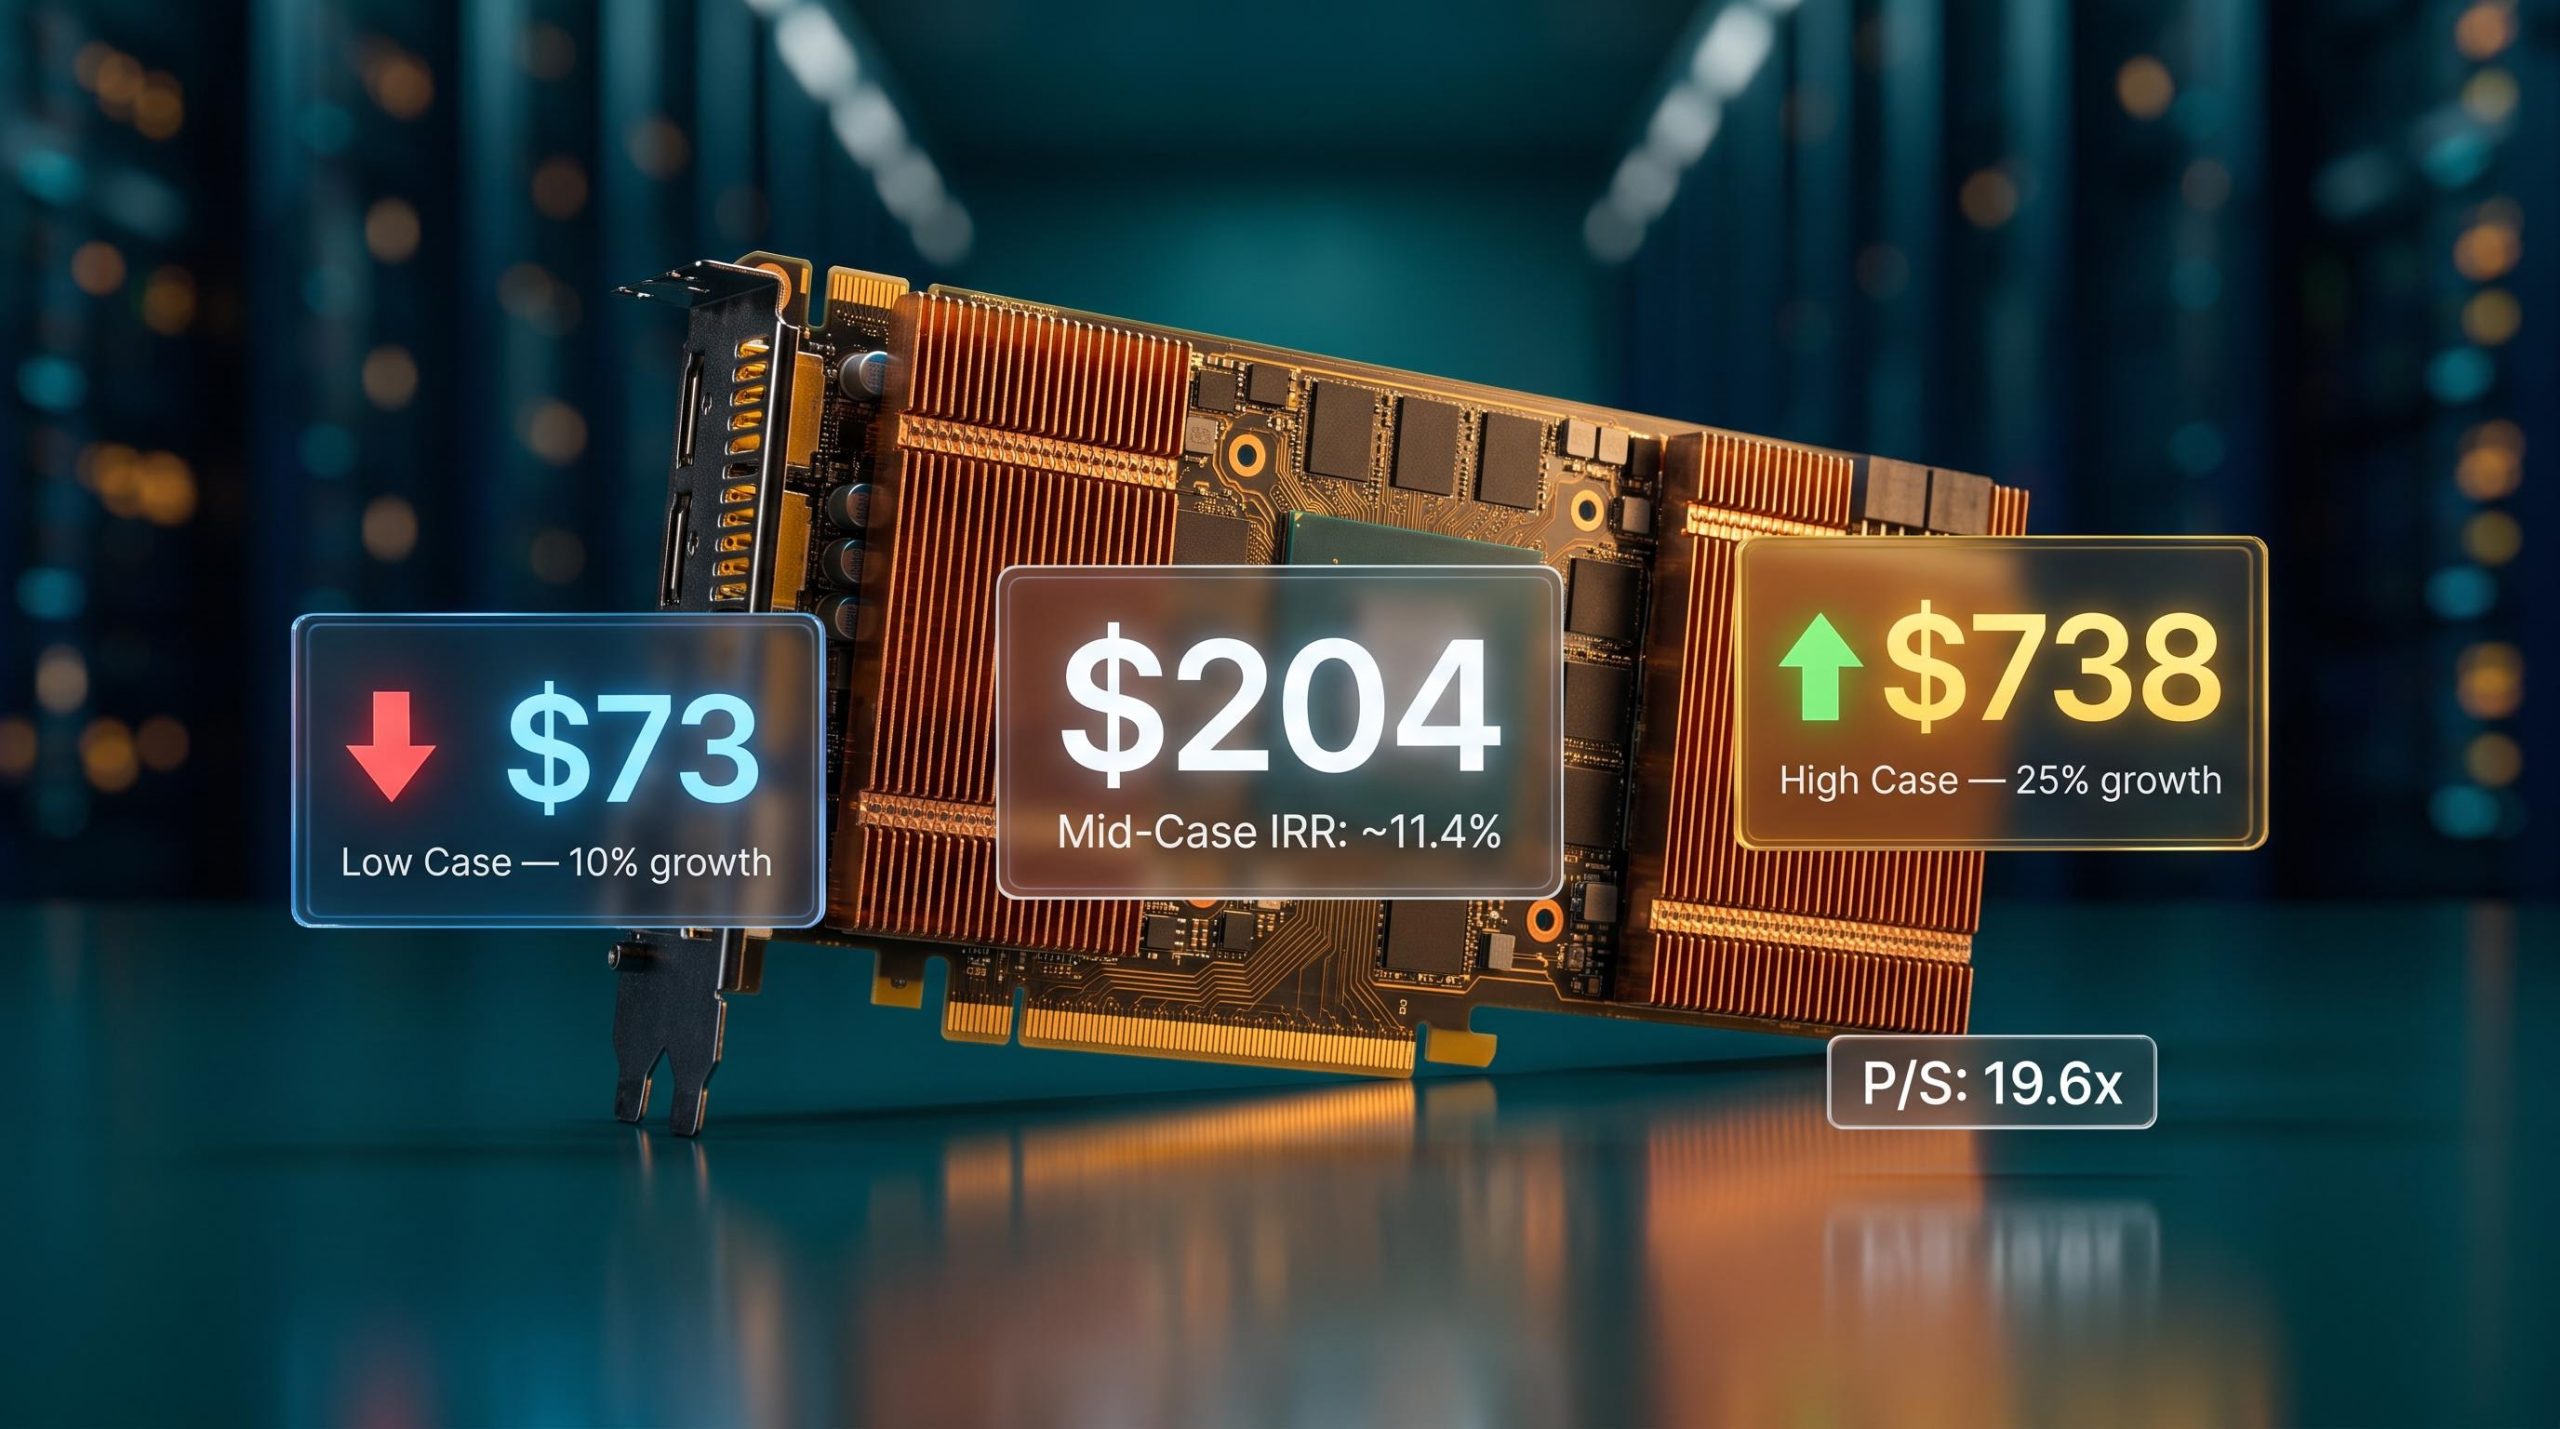
The question is not academic. Nvidia trades in a $195-$211 range in mid-2026, and the valuation debate is genuinely unresolved. Intrinsic value estimates from discounted cash flow models range from $73 to $738 depending on the assumptions you feed them. That is not a rounding error. It is a reflection of how much uncertainty still surrounds the durability of AI infrastructure spending.
What follows is the investment case, built from both sides: the bull thesis, the bear risks, a DCF-grounded valuation framework, and a practical map for deciding whether this stock fits your specific return requirements.
What made Nvidia the centre of the AI infrastructure trade
Nvidia started as a gaming graphics chip supplier. It is now the dominant provider of AI compute hardware, and the path between those two things explains why the business commands the margins it does.
The moat mechanics behind the margin profile
The company’s top line expanded from around $16 billion in 2021 to approximately $253 billion in under five years, a pace of growth that no single product cycle could have produced on its own. That trajectory was built on a platform.
CUDA, Nvidia’s software layer, has been adopted by AI developers and research teams over many years. The switching costs are not theoretical. Rewriting AI workloads away from CUDA means retraining engineering teams, rebuilding software pipelines, and accepting months of lost productivity. Even when a competitor’s chip looks competitive on a spec sheet, the practical cost of migration keeps customers locked in.
Nvidia exemplifies hardware that behaves like a platform because ecosystem switching costs extend far beyond software licensing: migrating away from CUDA requires retraining engineering teams, rebuilding software pipelines, and abandoning an integrated workflow that spans accelerators, networking, and inference tooling.
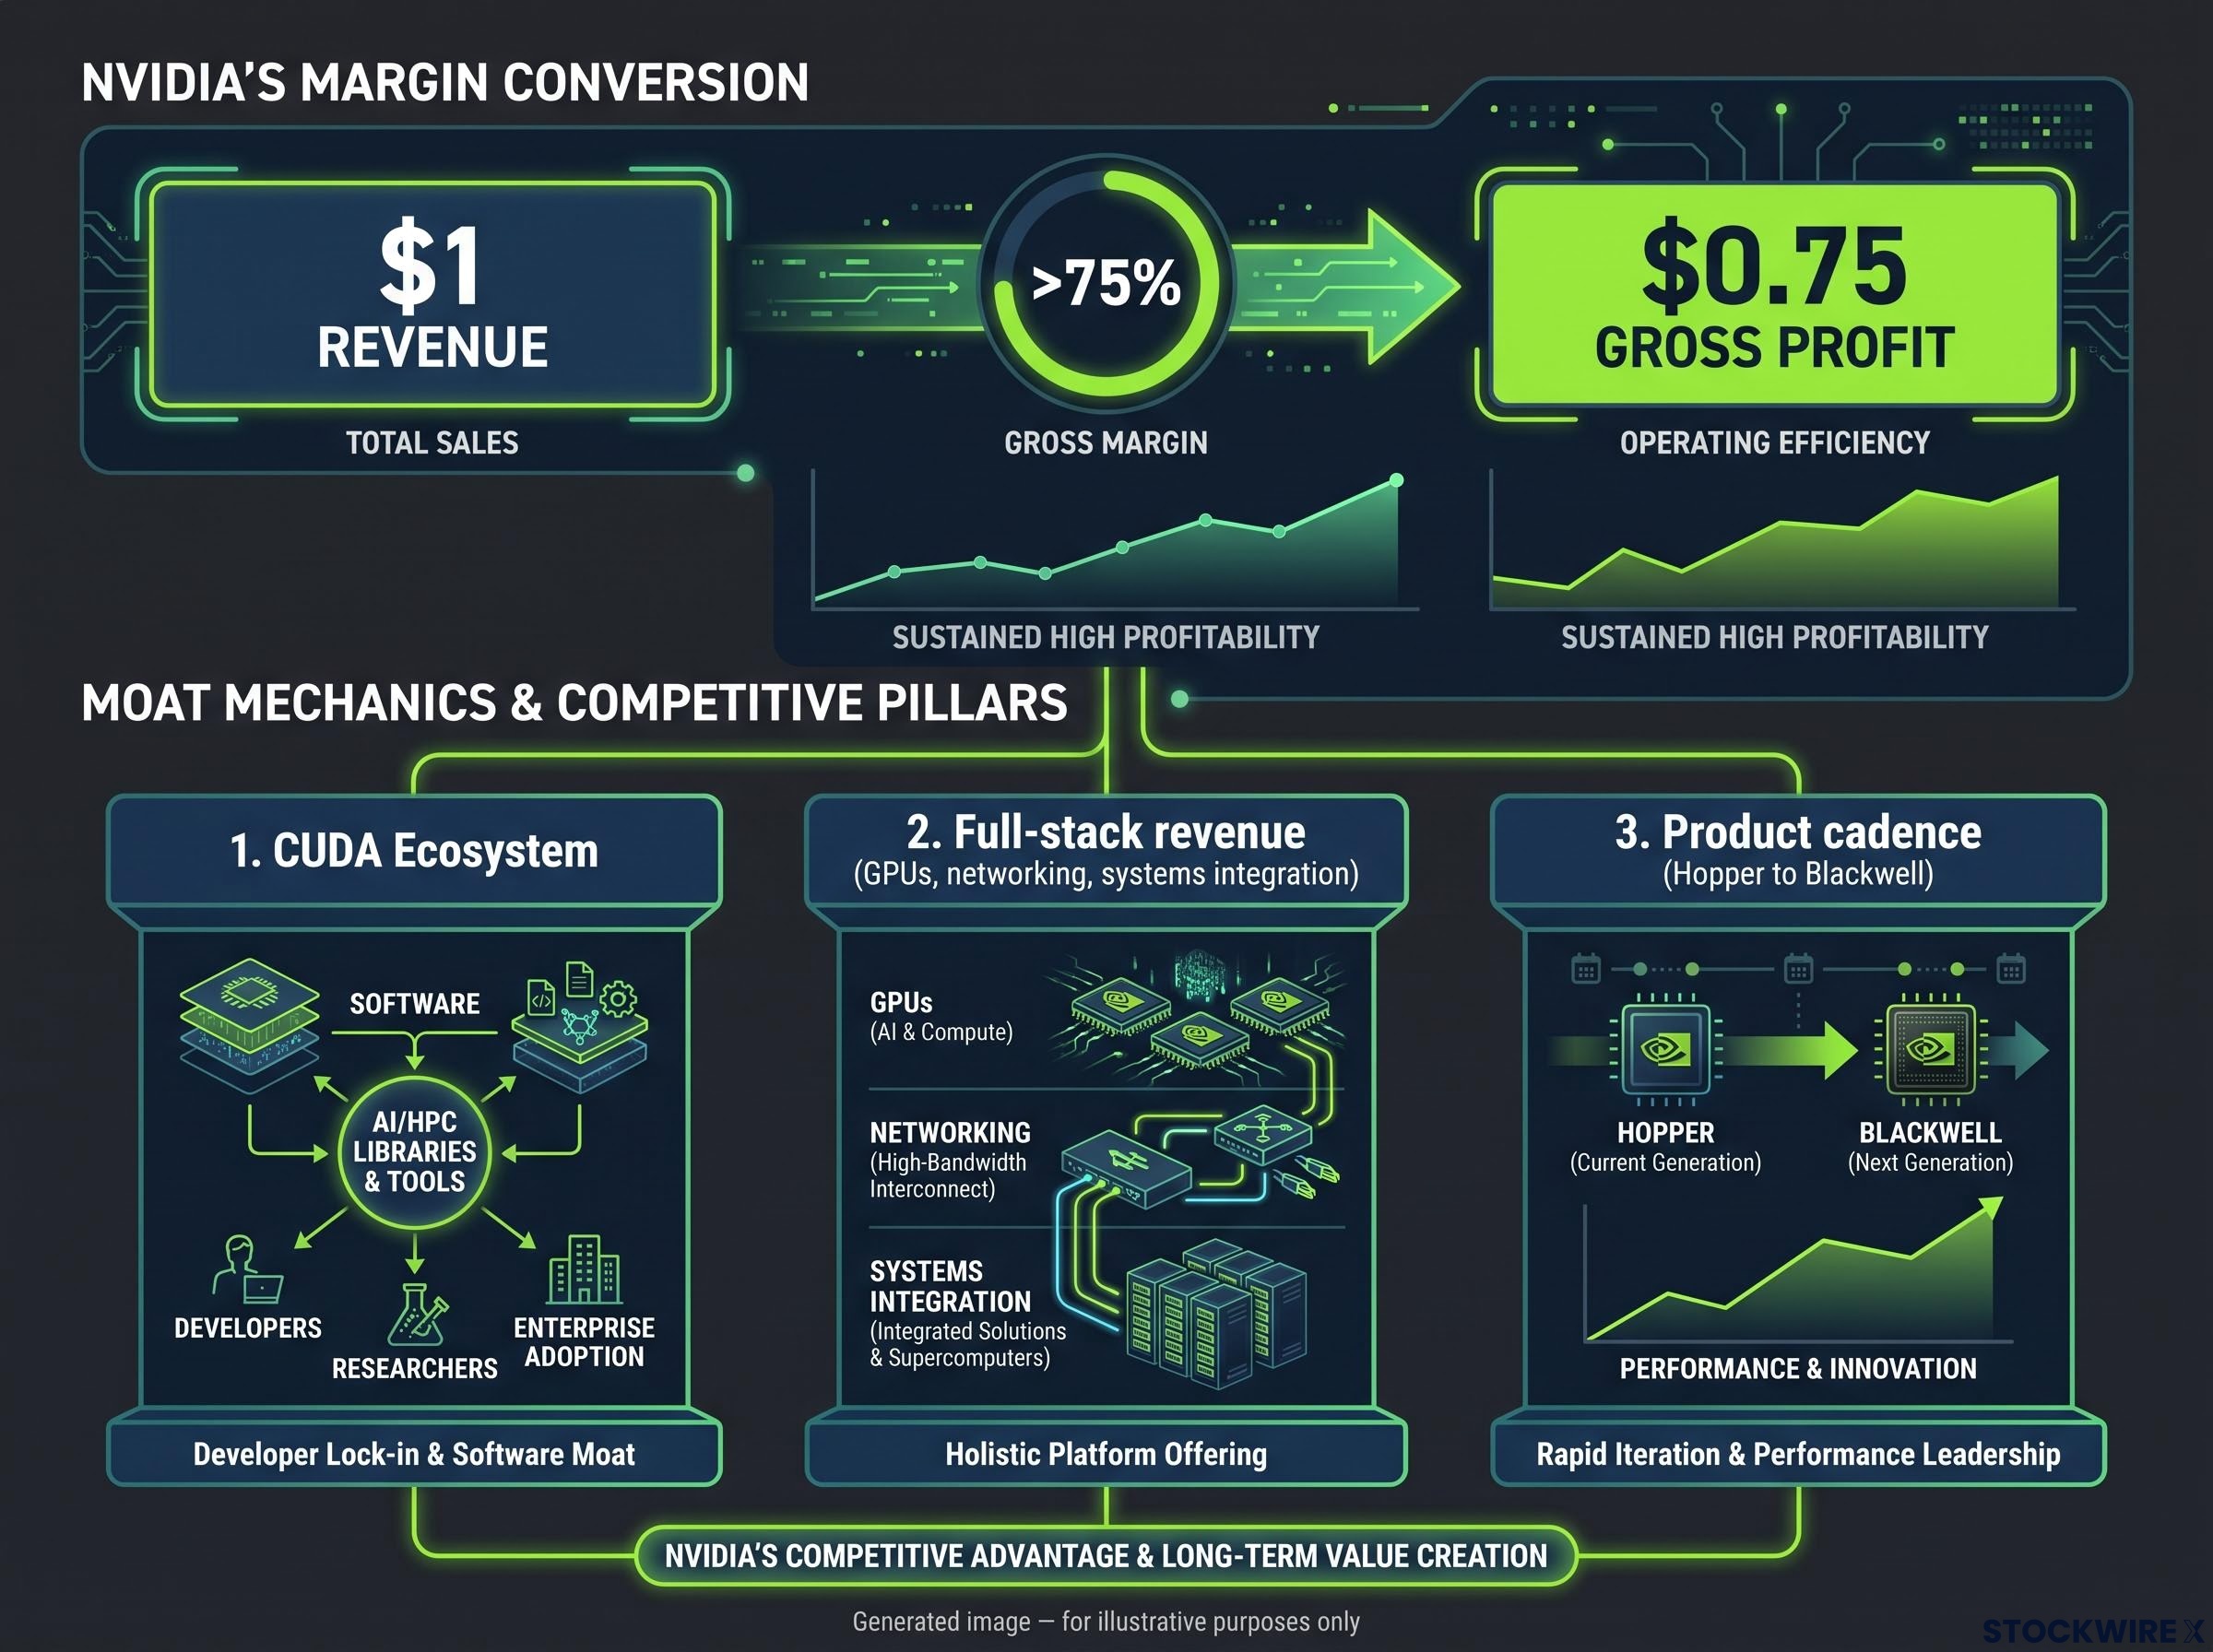
Beyond CUDA, Nvidia captures revenue at multiple points in the data centre stack. The company sells GPUs, high-speed networking hardware to connect those GPUs within clusters, and systems integration services. That full-stack monetisation means Nvidia earns from the chip, the fabric, and the architecture, not just one component.
The third dimension is product cadence. Nvidia releases new chip generations, from Hopper to Blackwell, faster than competitors can respond. That pace makes the performance gap structurally difficult to close.
The three moat dimensions work together:
- CUDA ecosystem: Rewriting AI workloads and retraining teams is the real barrier, not just software licensing
- Full-stack revenue capture: Networking hardware deepens customer dependence beyond the chip itself
- Product cadence: Faster release cycles keep competitors permanently behind the performance curve
Gross margins above 75% mean that hardware economics here bear little resemblance to a conventional chip business. For every dollar of chip revenue, roughly $0.75 reaches gross profit before operating costs are touched, a ratio far more typical of enterprise software than manufactured silicon. It reflects the premium customers pay for ecosystem continuity and deployment certainty.
The trailing twelve-month net profit margin stands at roughly 63%, meaningfully ahead of the 52% average recorded over the past decade. Operating cash flow reached approximately $119 billion in the most recent fiscal year. With enterprise value sitting below market capitalisation, the company carries more cash than debt, leaving financial distress risk negligible.
What this tells you is that the bear case against Nvidia is not about product failure or business quality. The business is genuinely exceptional. The bear case is about price.
When big ASX news breaks, our subscribers know first
The bull case: why trillions of dollars in AI capex could make today’s price look cheap
The strongest version of the bull argument rests on three structural pillars, and each one reinforces the next.
- AI infrastructure capex is still early. Jensen Huang has publicly stated that only a few hundred billion dollars of AI infrastructure investment has been deployed so far, against a total opportunity he characterises in the trillions. Major customers, Amazon, Google, Meta, and Microsoft, continue deploying large AI capex, with repeated upside surprises in Nvidia’s data centre revenue through FY 2025 and into early FY 2026. Record quarterly revenue of approximately $39.3 billion in Q4 FY2025, driven by the Blackwell platform, confirmed the demand trajectory.
- Agentic AI requires substantially more compute. As AI evolves beyond question-and-answer chat tools toward fully autonomous systems that complete complex tasks end-to-end without human direction, the compute requirement per workload scales dramatically. If that demand curve proves correct, the infrastructure buildout ahead of Nvidia may be steeper in the next three years than it was in the prior three.
- Sovereign AI diversifies the customer base. Individual nations are developing their own AI systems, expanding the global market for AI chips beyond a handful of U.S. hyperscalers. That reduces concentration risk while adding new procurement volume.
Sovereign AI programmes operate on multi-year policy budgets rather than quarterly capex cycles, providing a counter-cyclical revenue buffer that hyperscaler spending alone cannot replicate, and non-hyperscaler buyers including AI labs and enterprise on-premise deployments led Nvidia’s revenue growth in the most recent quarter.
In this framing, each dollar of capex already spent is a fraction of what is coming, agentic systems multiply the compute requirement per workload, and sovereign projects widen the buyer pool. That is why serious investors own this stock at elevated multiples rather than dismissing them as naive.
The bear case: three risks that could make $204 look expensive
The risks are not remote scenarios. They are dynamics already visible in the market.
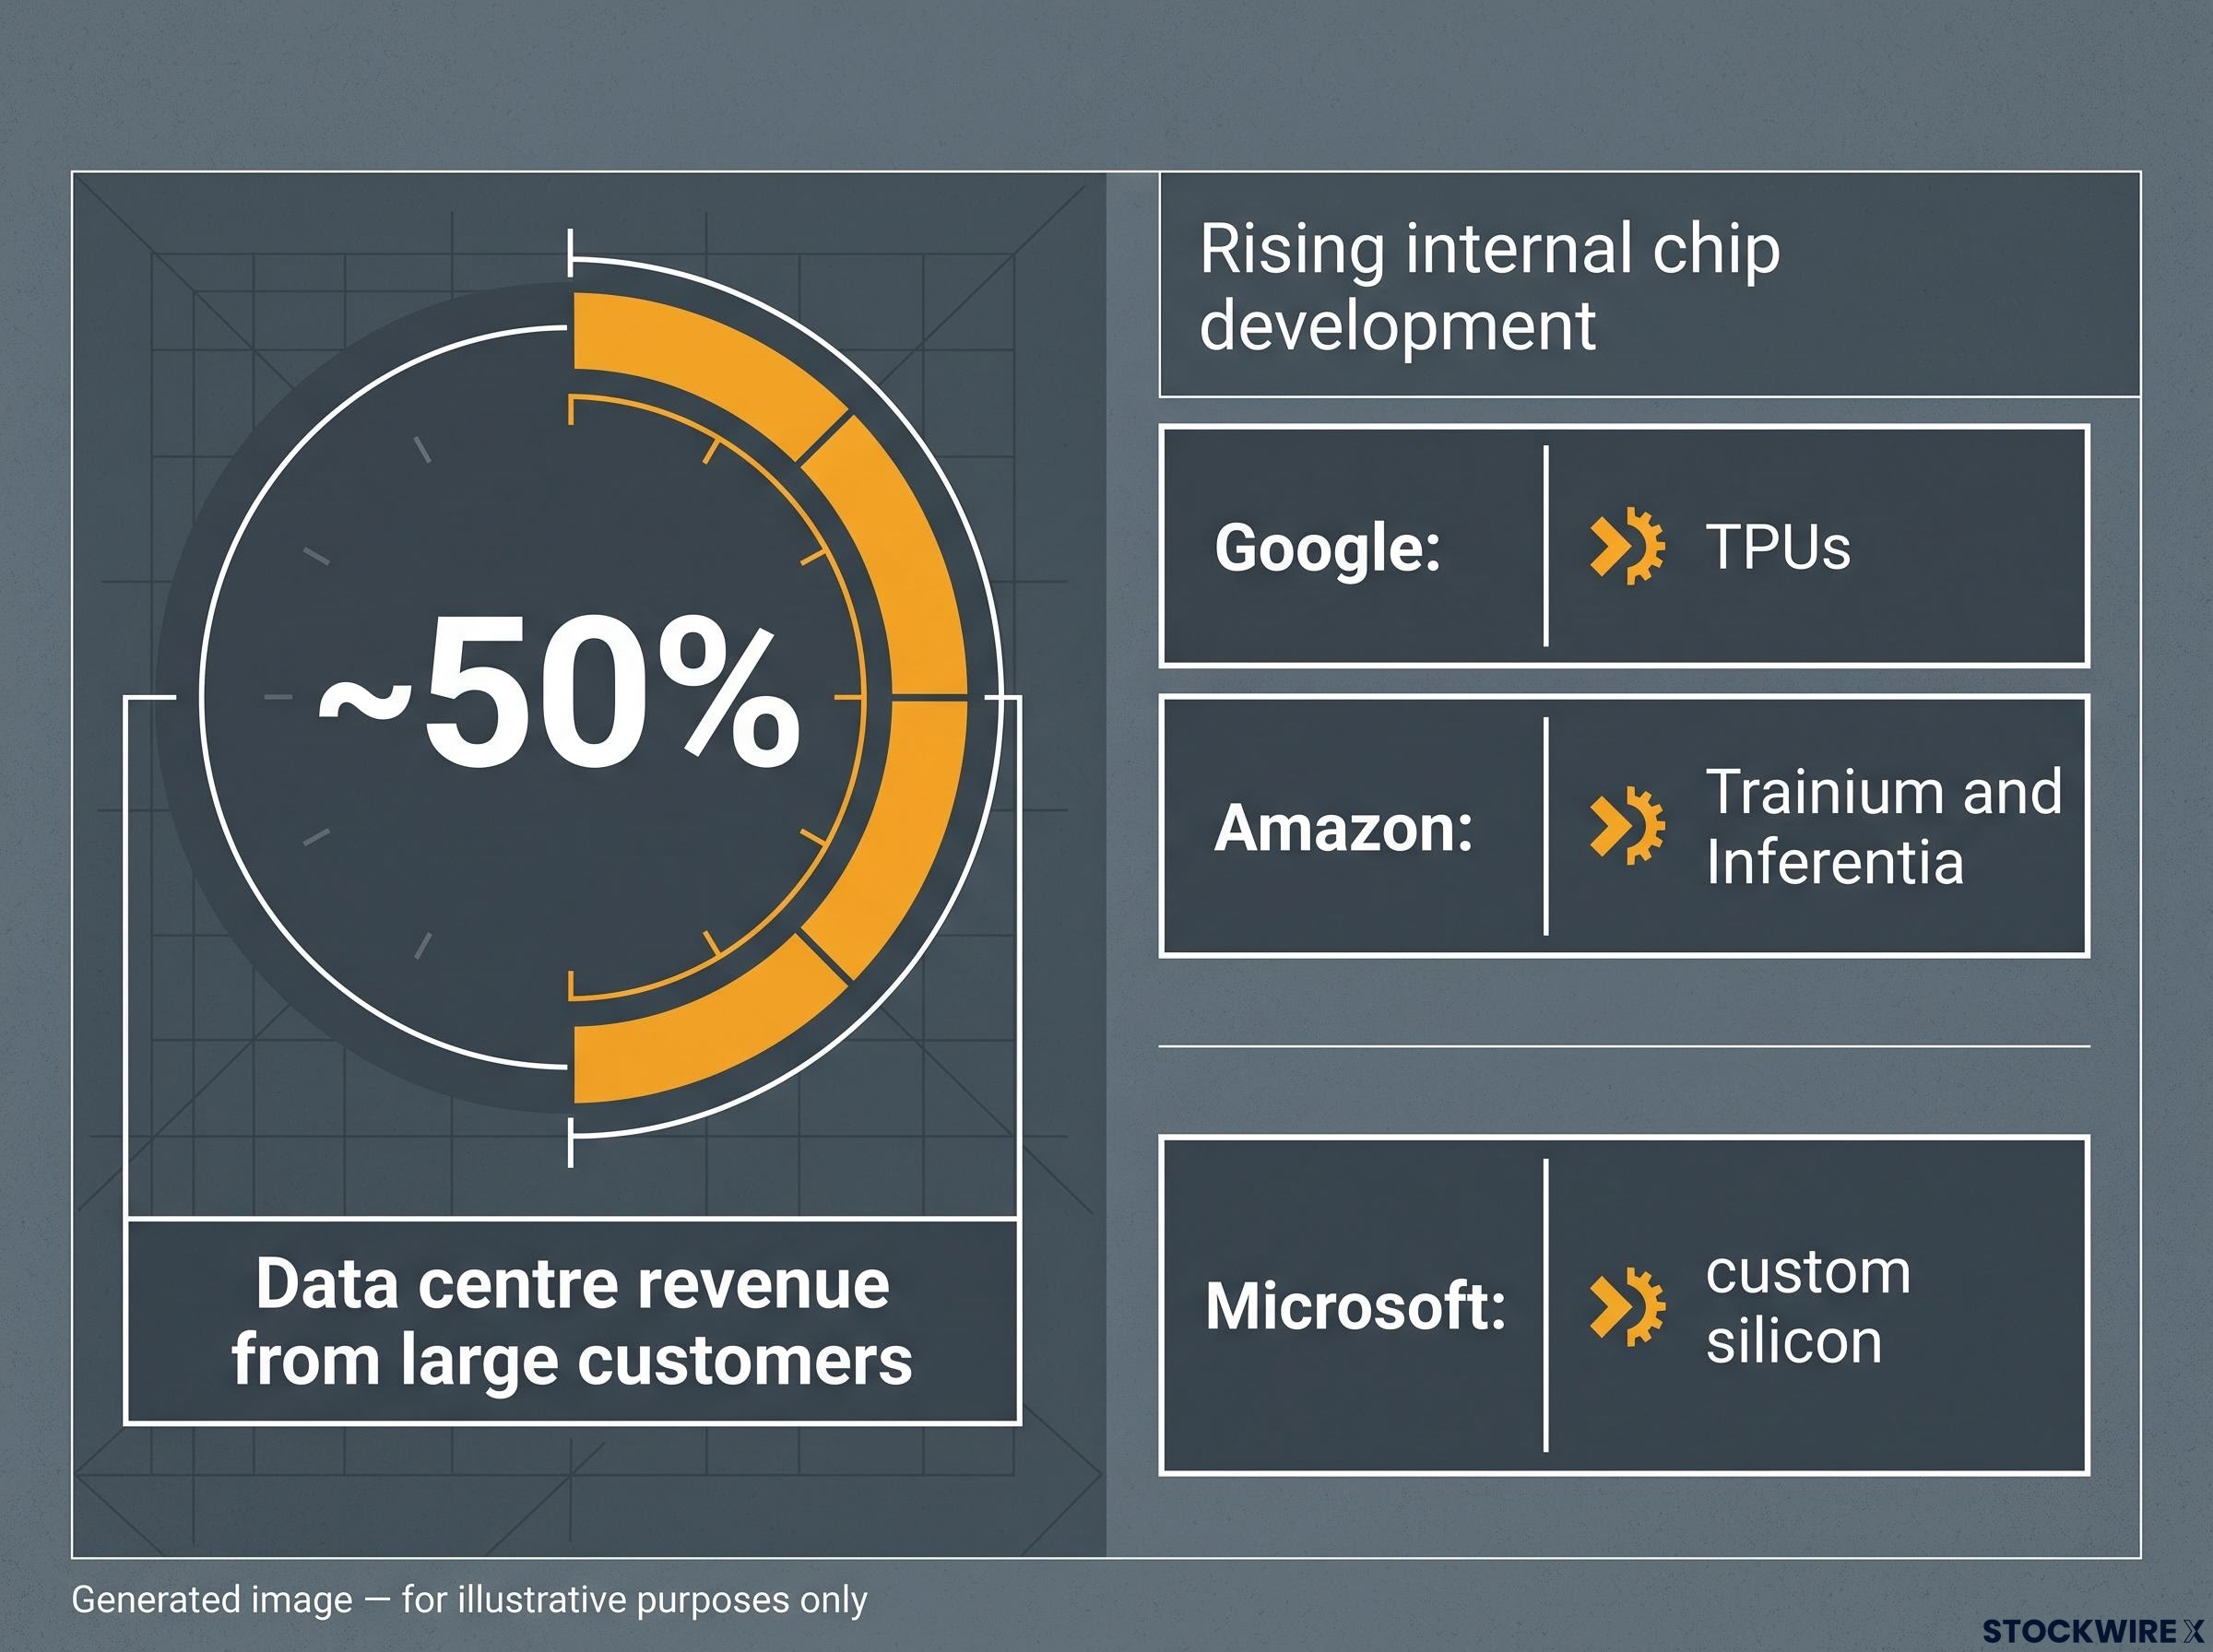
- Customer concentration: Approximately half of data centre revenue is estimated to come from a handful of large customers. That gives those buyers genuine pricing leverage, and it grows as their own chip capabilities mature.
- In-house chip development: Google’s TPUs, Amazon’s Trainium and Inferentia, and Microsoft’s custom silicon do not need to match Nvidia across every workload. They need only reach a threshold of adequacy for internal use cases to begin eroding Nvidia’s volumes and undermining the premium pricing that underpins those exceptional margins. The question is whether that threshold has already been crossed for specific customers.
- Export restrictions: U.S. government policy toward China has been inconsistent. Should a sweeping prohibition on advanced chip exports to China take effect, a material portion of Nvidia’s revenue could disappear immediately, with the timing and scope sitting entirely beyond what management can influence or any DCF model can reliably capture.
- The AI ROI question: If hyperscalers pivot from maximum AI capex to return-on-investment discipline, procurement pace could slow materially. If corporate commentary begins shifting toward terms like “capital efficiency” or “rationalising workloads,” treat that as an early signal that chip purchasing volumes may follow.
Nvidia’s China revenue exposure collapsed from approximately $6 billion in FY2024 to near zero by FY2026 Q1 following export controls, a structural revenue loss rather than a temporary dip, and domestic rivals led by Huawei Ascend now hold an estimated 70-80% of China’s AI accelerator market.
The risk that AI infrastructure investment has overshot realistic near-term returns is not a fringe concern. For a stock priced at elevated multiples, even a transition from hypergrowth to robust-but-normal growth could materially hurt long-term returns.
The stock pulled back from highs near $235 to the mid-2026 trading range of $195-$211. That move did not happen in a vacuum. It reflected the market beginning to price these dynamics, even if it has not resolved them.
What the numbers actually say: a DCF-grounded valuation framework
Start with where the stock sits on standard multiples. At approximately $204 per share:
- Trailing price-to-earnings (P/E): approximately 31 times earnings
- Price-to-sales: approximately 19.6 times revenue
- Price-to-free-cash-flow: approximately 41 times free cash flow
For context, high-margin software businesses such as Microsoft and Google have historically commanded valuations of roughly 8-12 times sales. At 19.6 times, Nvidia sits well above even those elevated benchmarks, though the bull argument is that if AI infrastructure spending continues to scale, sales growth alone could make the current ratio look reasonable in hindsight.
Reading the DCF output as a decision tool
A ten-year discounted cash flow model, using assumptions deliberately below analyst consensus, produces the following intrinsic value ranges across three scenarios and two hurdle rates (the minimum annual return an investor requires):
| Scenario | Revenue Growth | Margin Assumption | Value at 9% Hurdle | Value at 15% Hurdle |
|---|---|---|---|---|
| Low | 10% annually | 35% | $115 | $73 |
| Mid | 15% annually | 45% | $250 | $154 |
| High | 25% annually | 55% | $738 | $448 |
Applying a 9% hurdle rate to the mid-case scenario, an investor entering at $204 today would be looking at a projected annual return of roughly 11.4%. That is not a bargain, but it is plausible for a business of this quality.
The wide range from $73 to $738 is not a failure of the model. It is an honest representation of genuine uncertainty about whether current revenue and margin levels represent a permanent baseline or a cyclical peak. That judgment is the central analytical challenge, and no model resolves it for you.
A higher personal return requirement mechanically produces a lower buy price. That is independent of any view on business quality. An investor demanding 15% annual returns needs the high-case scenario to materialise to justify buying at $204. An investor comfortable with 9-11% finds mid-case support at current levels.
Consensus analyst forecasts show earnings per share potentially expanding from roughly $4.69 to above $20 across the next four to five years, with revenue on a trajectory toward $1 trillion. These are forward projections built on optimistic assumptions, not confirmed outcomes, and carry the usual risks of analyst forecasts made during a high-growth phase.
This article is for informational purposes only and should not be considered financial advice. Investors should conduct their own research and consult with financial professionals before making investment decisions. Past performance does not guarantee future results. Financial projections are subject to market conditions and various risk factors.
Who should own this stock, and at what price
The answer depends on your return requirements, not on generic risk labels.
- If you target 9-11% annual returns and can tolerate significant short-term volatility: the mid-case DCF supports $204 as plausibly fair, not cheap. You are betting that AI infrastructure capex continues at scale and Nvidia maintains its dominance. The balance sheet is a genuine source of comfort here; with cash holdings exceeding total debt, the gap between enterprise value and market capitalisation signals that the company is well insulated from financial stress.
- If you require 15%+ annual returns or demand a meaningful margin of safety: the stock at $204 requires the high-case scenario to materialise. That is not impossible, but it means you need the bull case to be substantially correct across all three pillars: capex scale, competitive dominance, and sustained margins.
- If capital preservation is your priority: the current price is better understood as “priced for excellence” than as an obvious bargain. The company’s financial health is exceptional, but the equity valuation embeds strong growth expectations that leave limited room for disappointment.
The mid-2026 trading range has included large swings, including the pullback from $235 and subsequent rebounds. If you buy at $204, you should be clear about which scenario you are implicitly underwriting, and whether that aligns with your actual investment goals rather than your aspirational ones.
Priced for excellence, not for error
Nvidia is one of the highest-quality businesses in global equities. The current price reflects that quality almost completely.
The bull case rests on three load-bearing assumptions: continued AI infrastructure capex at scale, Nvidia maintaining dominance despite customer chip development and export policy risks, and structurally sustained margins above historical averages. If all three hold, the valuation is defensible. If any one buckles, the stock is priced with limited room to absorb the disappointment.
The DCF framework does not tell you what to do. It tells you what you are betting on. At $204, the mid-case scenario points to annual returns of roughly 11.4%, which is credible but not compelling. The high case carries real upside, while the low case points to meaningful capital loss.
Where you land on that spectrum is not about Nvidia. It is about your return requirements, your tolerance for volatility, and your honest assessment of how much of the AI infrastructure story has already been priced in. The business has earned the premium. The question is whether the premium has left enough margin for error to meet your standards.
For investors weighing position sizing alongside the valuation scenarios above, our comprehensive walkthrough of semiconductor cycle investing examines the five-indicator framework for identifying when premium multiples are approaching their expiry date, including the double-hit mechanism where earnings disappointment and multiple compression arrive simultaneously.
These statements are speculative and subject to change based on market developments and company performance.