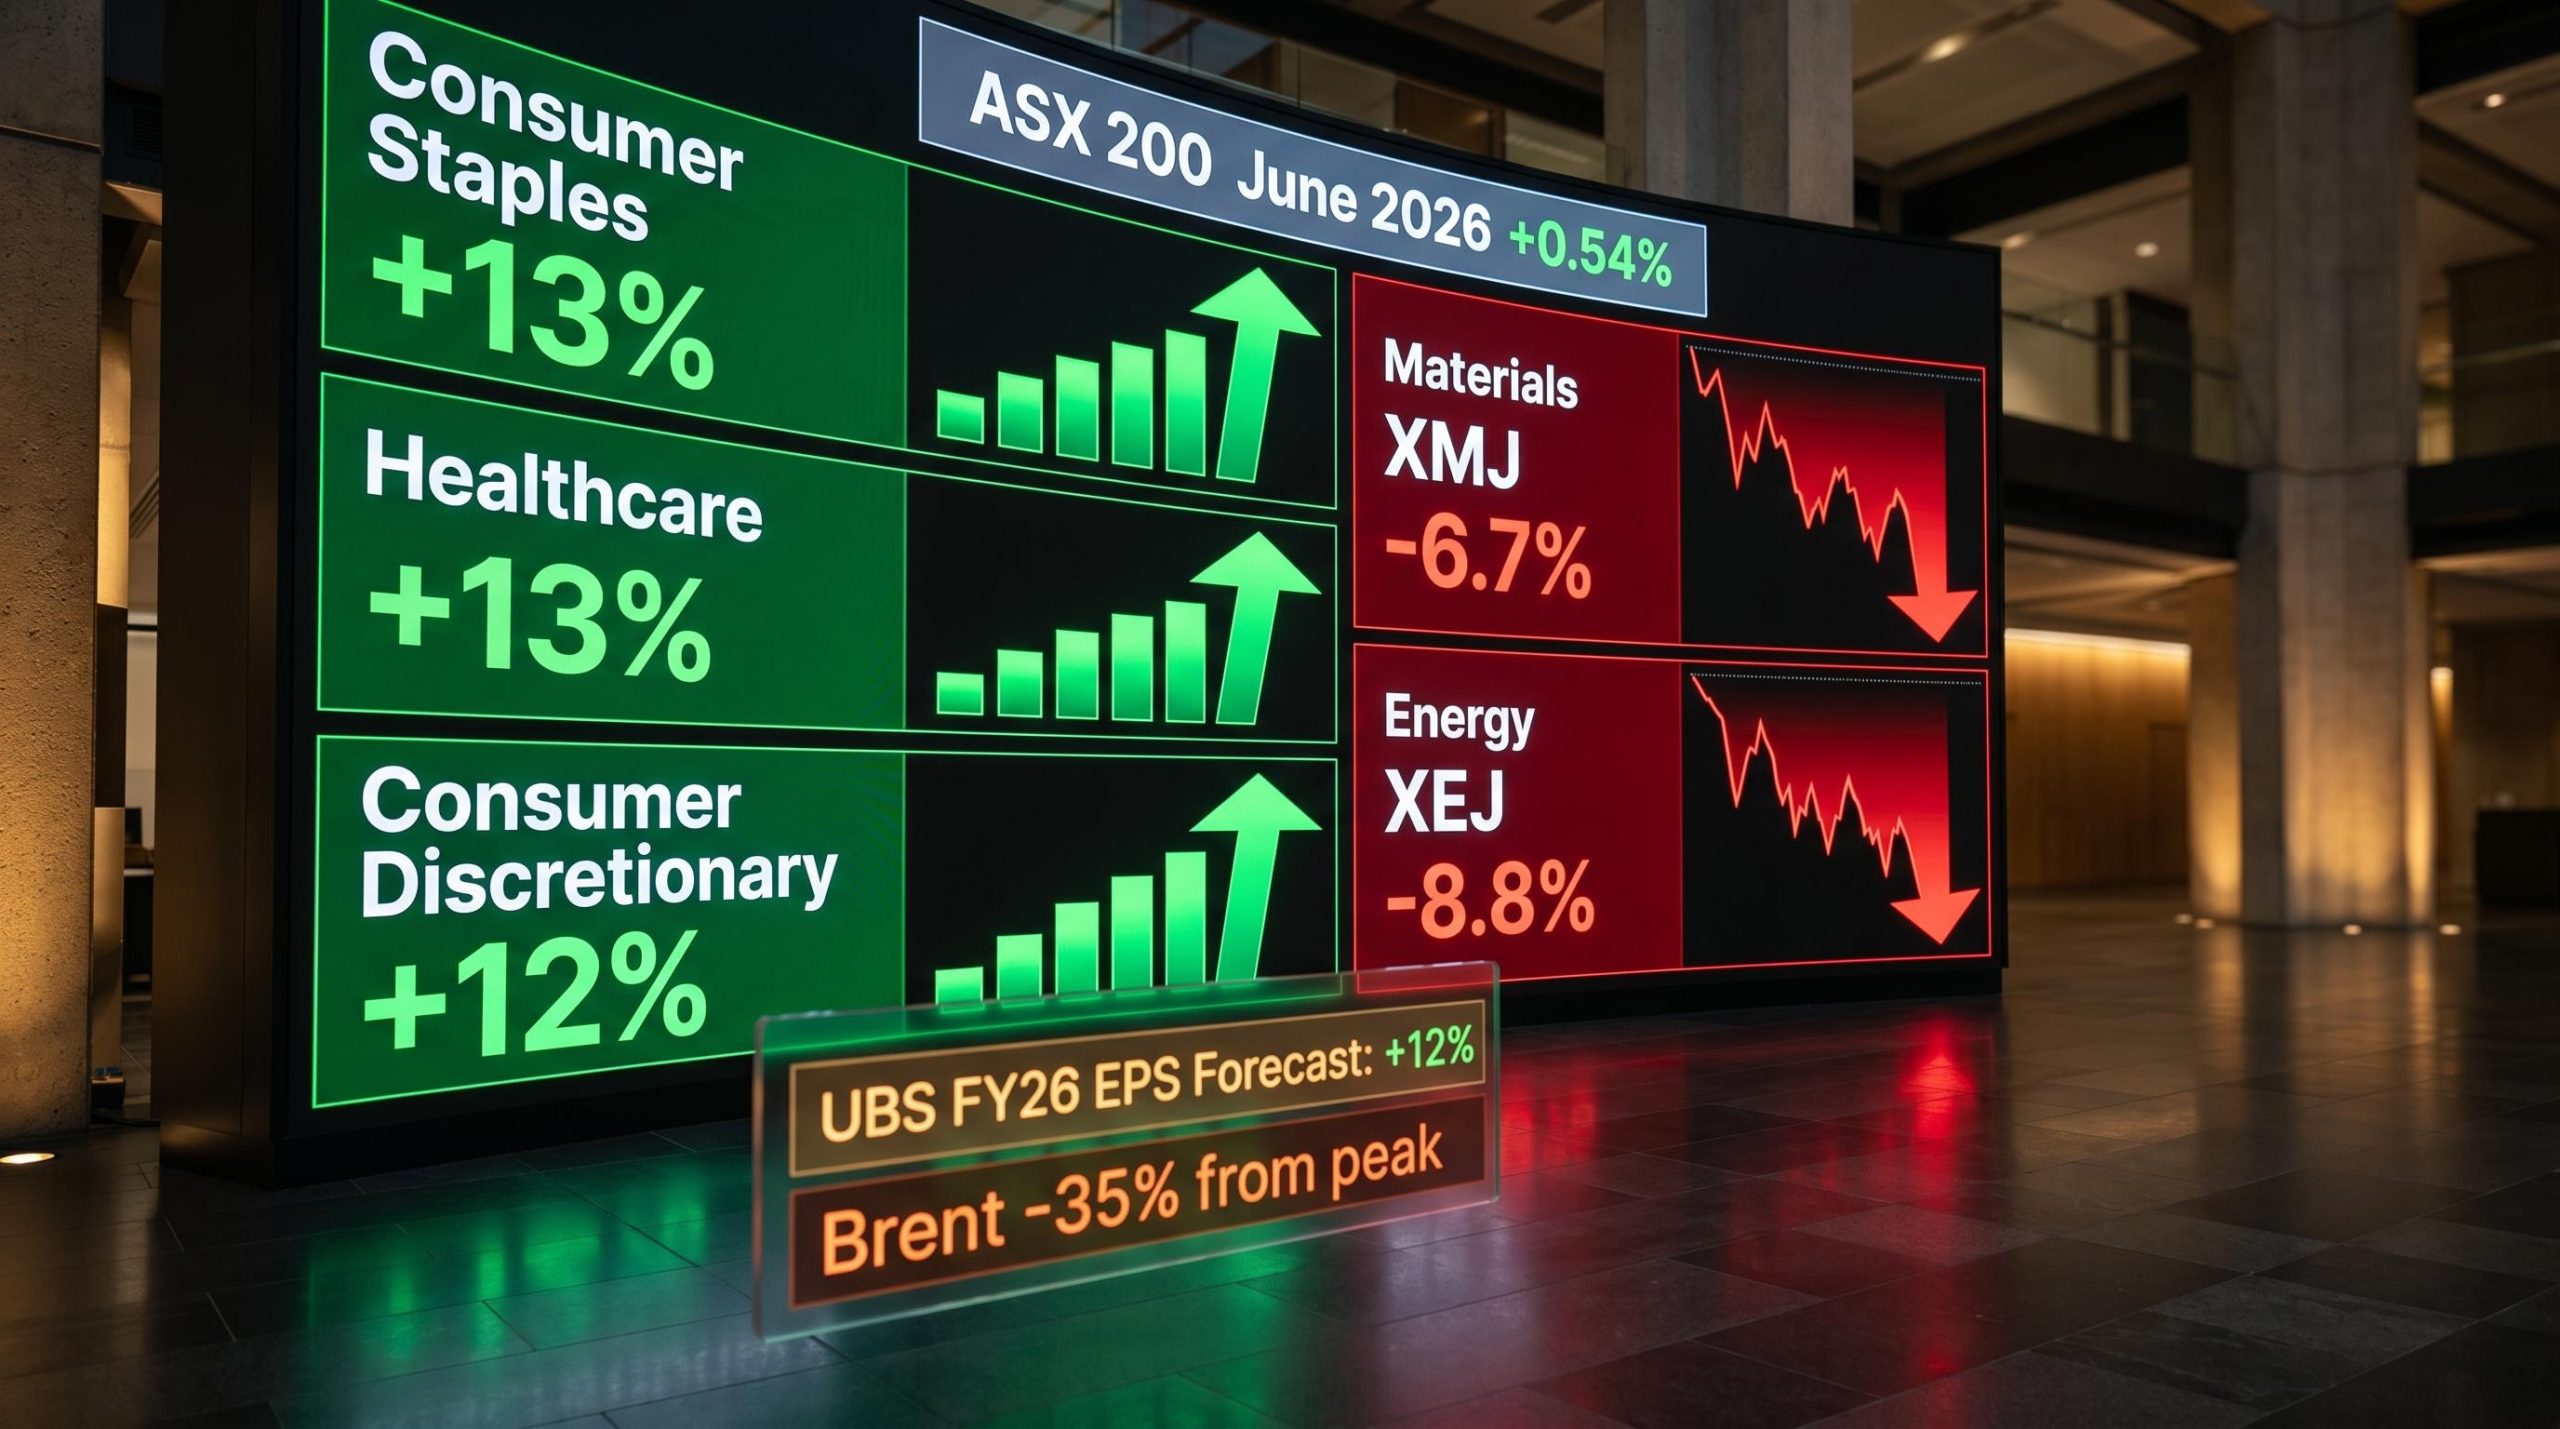
On the first day of July 2026, the ASX 200 closed out June with a result that looks, on the surface, like a quiet month. Yet the 0.54% monthly gain obscures a dramatic range of outcomes underneath it: individual sectors moved anywhere from nearly negative 9% to positive 13% across those four weeks.
The real story entering July is a market split in two. Consumer-facing parts of the index clawed back from multi-year lows as oil prices fell, bond yields eased, and inflation expectations softened. Meanwhile, Materials and Energy each posted heavy losses in June, with declines of 6.7% and 8.8% respectively weighing on an index where commodity-linked stocks make up a meaningful share. That divergence sets up a July where the right question is not whether the ASX 200 goes up or down, but where within it the risks and opportunities actually sit.
Here is what the June numbers actually mean for how you should be thinking about your Australian equity exposure right now, from the macro tailwinds powering the consumer rebound to the commodity weakness dragging on resources, and the earnings tension sitting underneath both.
The headline hides a 20-point swing between sectors
June’s final tally for the ASX 200 was a 0.54% gain, with the index oscillating nearly 3% in each direction at various points throughout the month. That headline number suggests a market treading water. The sector breakdown tells a completely different story.
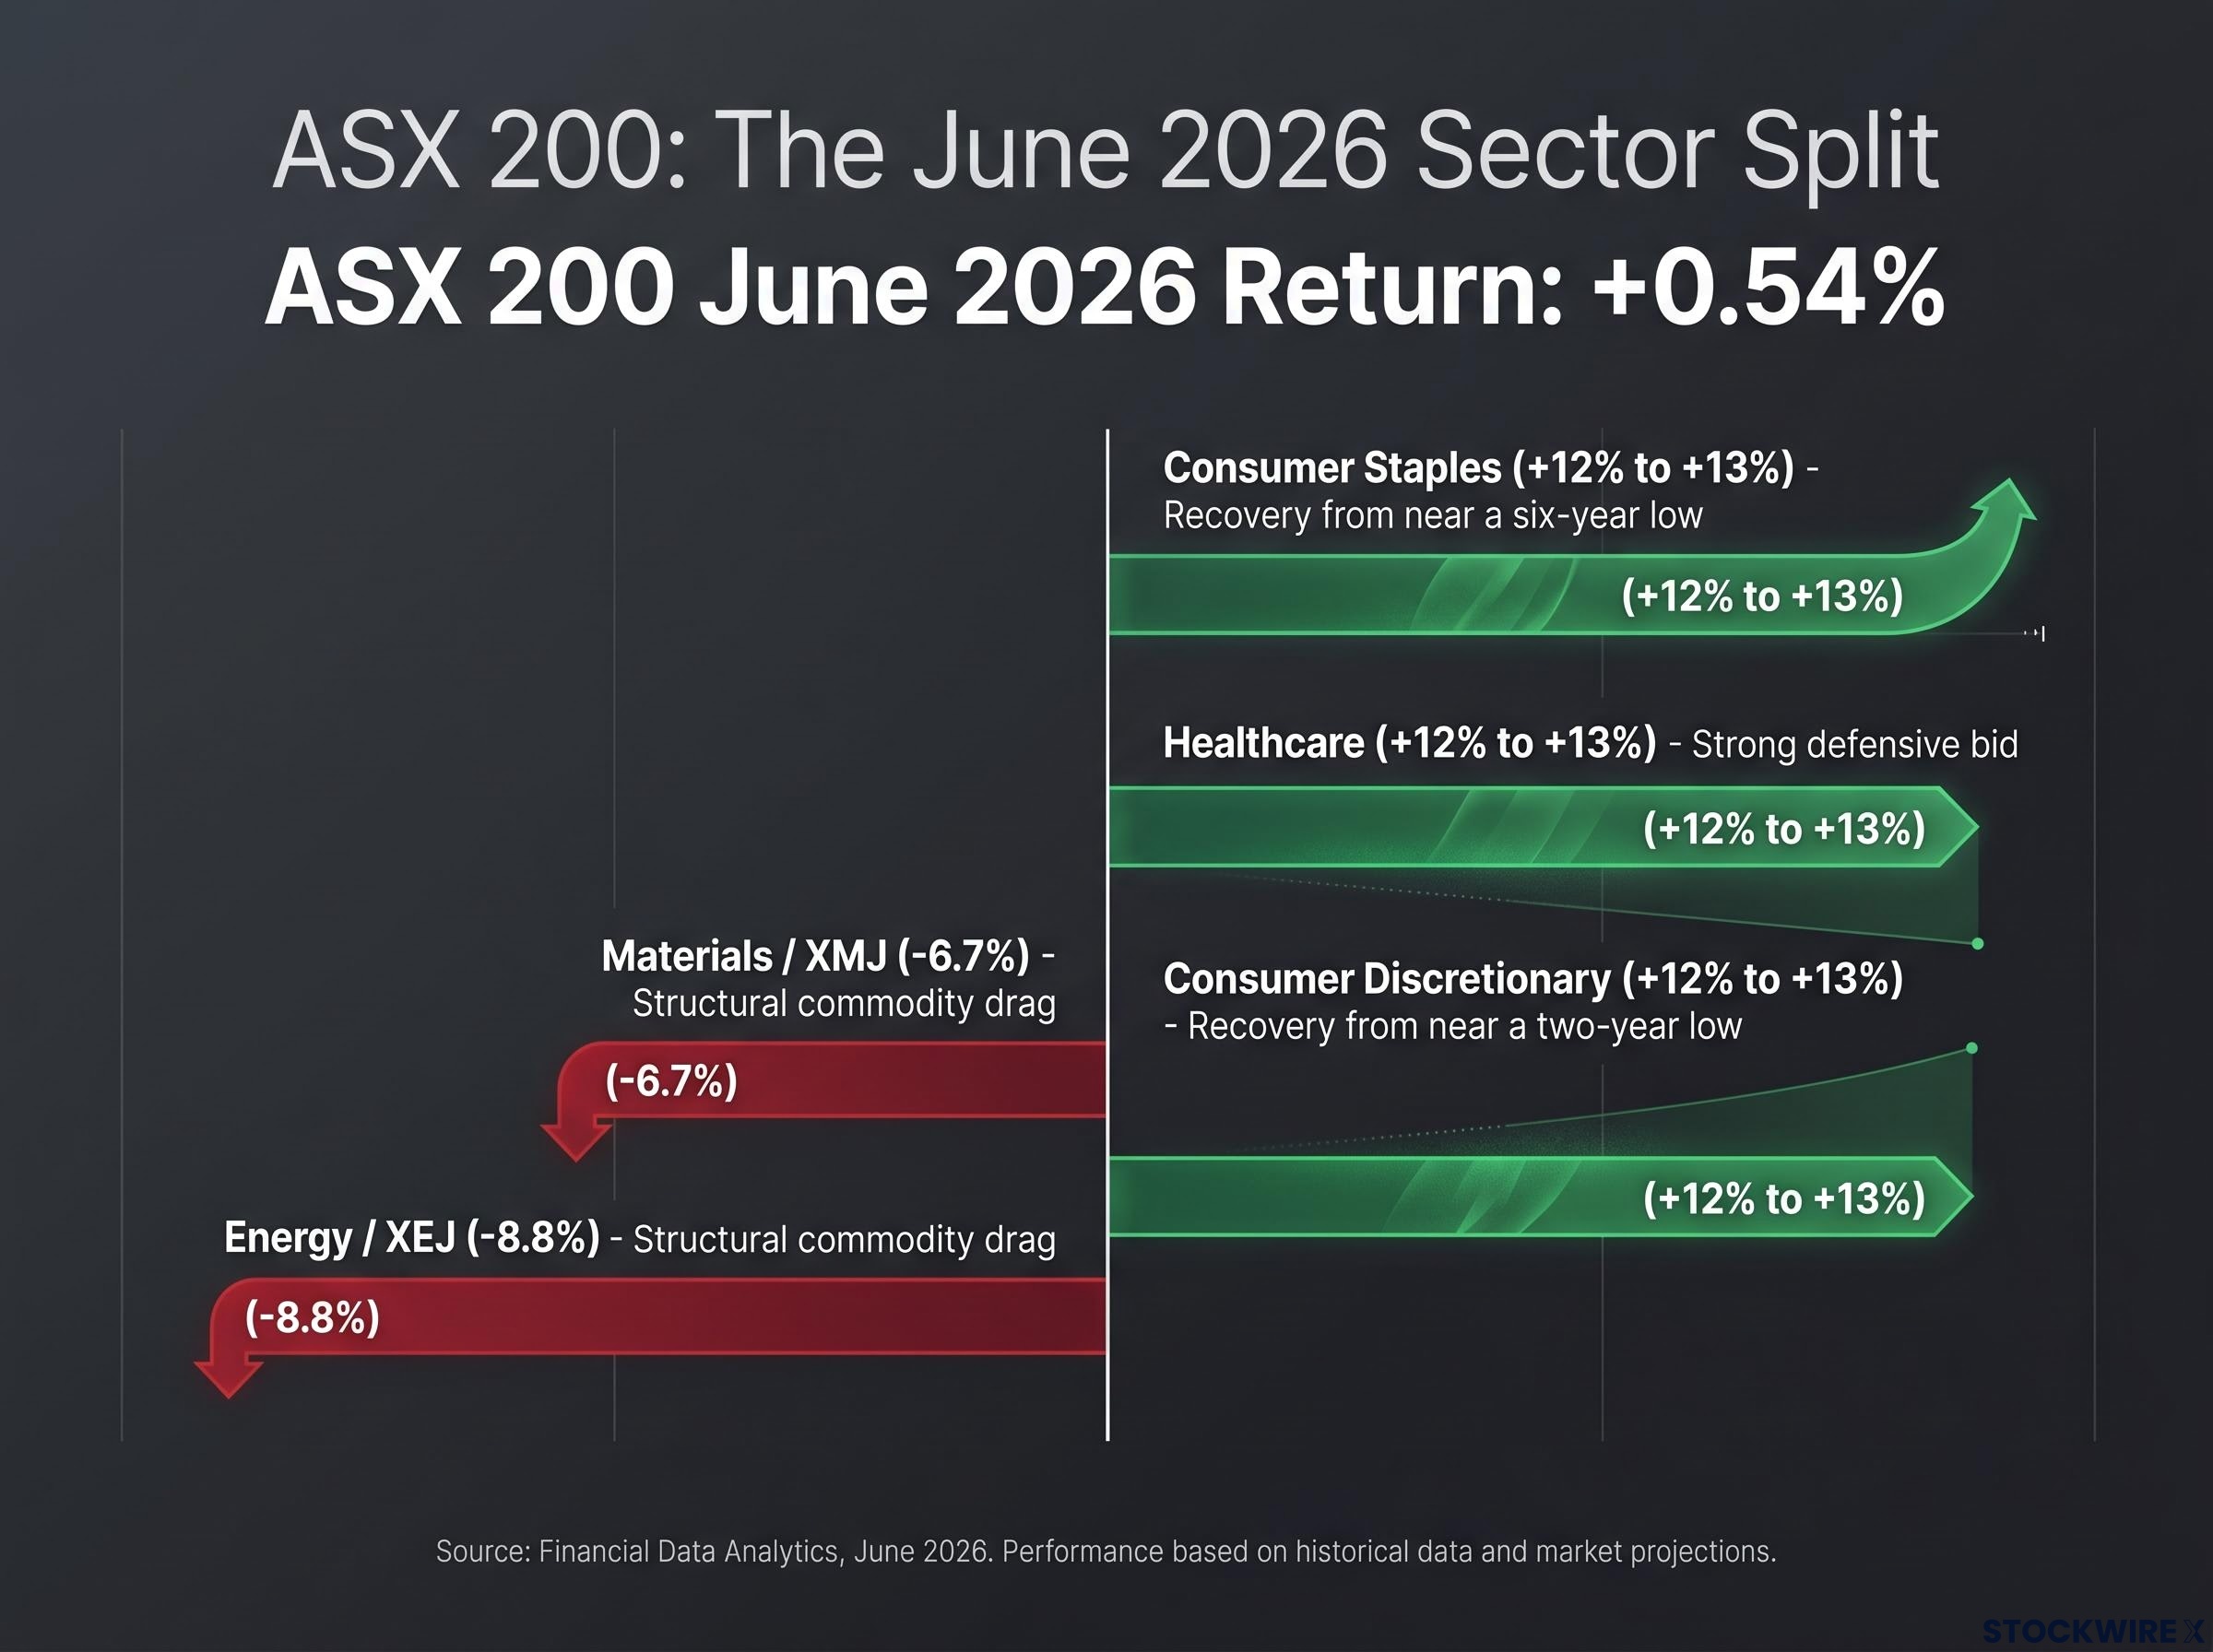
Consumer Staples, Healthcare, and Consumer Discretionary all posted gains in the 12% to 13% range across the month. Consumer Staples had been sitting near a six-year low at the start of June. Consumer Discretionary was trading close to a two-year low. Both staged recoveries that would look aggressive in any month, let alone one where the broader index barely moved.
On the other side of the ledger, Materials (XMJ) gave back 6.7% and Energy (XEJ) retreated 8.8%. This was not a rounding-error divergence. It was a structural split.
| Sector | June 2026 Return | Notes |
|---|---|---|
| Consumer Staples | +12% to +13% | Recovery from near a six-year low |
| Healthcare | +12% to +13% | Strong defensive bid |
| Consumer Discretionary | +12% to +13% | Recovery from near a two-year low |
| Materials (XMJ) | −6.7% | Structural commodity drag |
| Energy (XEJ) | −8.8% | Structural commodity drag |
The near-flat headline return is not a sign of a quiet market. It is the mathematical average of two very different markets running at the same time. If your portfolio tilts toward either extreme, you experienced June very differently from the index.
ASX sector divergence of this magnitude is not unprecedented: over FY2026, a 106.9-percentage-point spread between the best and worst performing sectors meant that nearly 44% of ASX 300 companies finished in negative territory even as the headline index reported a positive annual return.
When big ASX news breaks, our subscribers know first
Why consumer sectors bounced, and whether the tailwinds are real
The consumer recovery was not a technical bounce from oversold levels. Three macro shifts converged in June, each reducing a different source of pressure on consumer-facing businesses and their valuations:
- Falling oil prices: Brent crude is down approximately 35% from its peak of US$113 per barrel, directly reducing household energy costs and input prices for consumer businesses.
- Declining bond yields: From mid-May, Australia’s two-year government bond yield dropped by close to 33 basis points, settling at its lowest point in four months. Lower yields reprice the discount rate on longer-duration consumer and growth stocks, making future earnings more valuable today.
- Moderating inflation expectations: Easing price pressures reinforce the case that the RBA’s tightening cycle is closer to its end than its beginning, removing a source of valuation compression that weighed on these sectors for much of the past year.
By late June, Australia’s two-year government bond yield had pulled back to around 4.45%, a reading not seen in four months, suggesting that concerns about further rate rises are meaningfully diminishing.
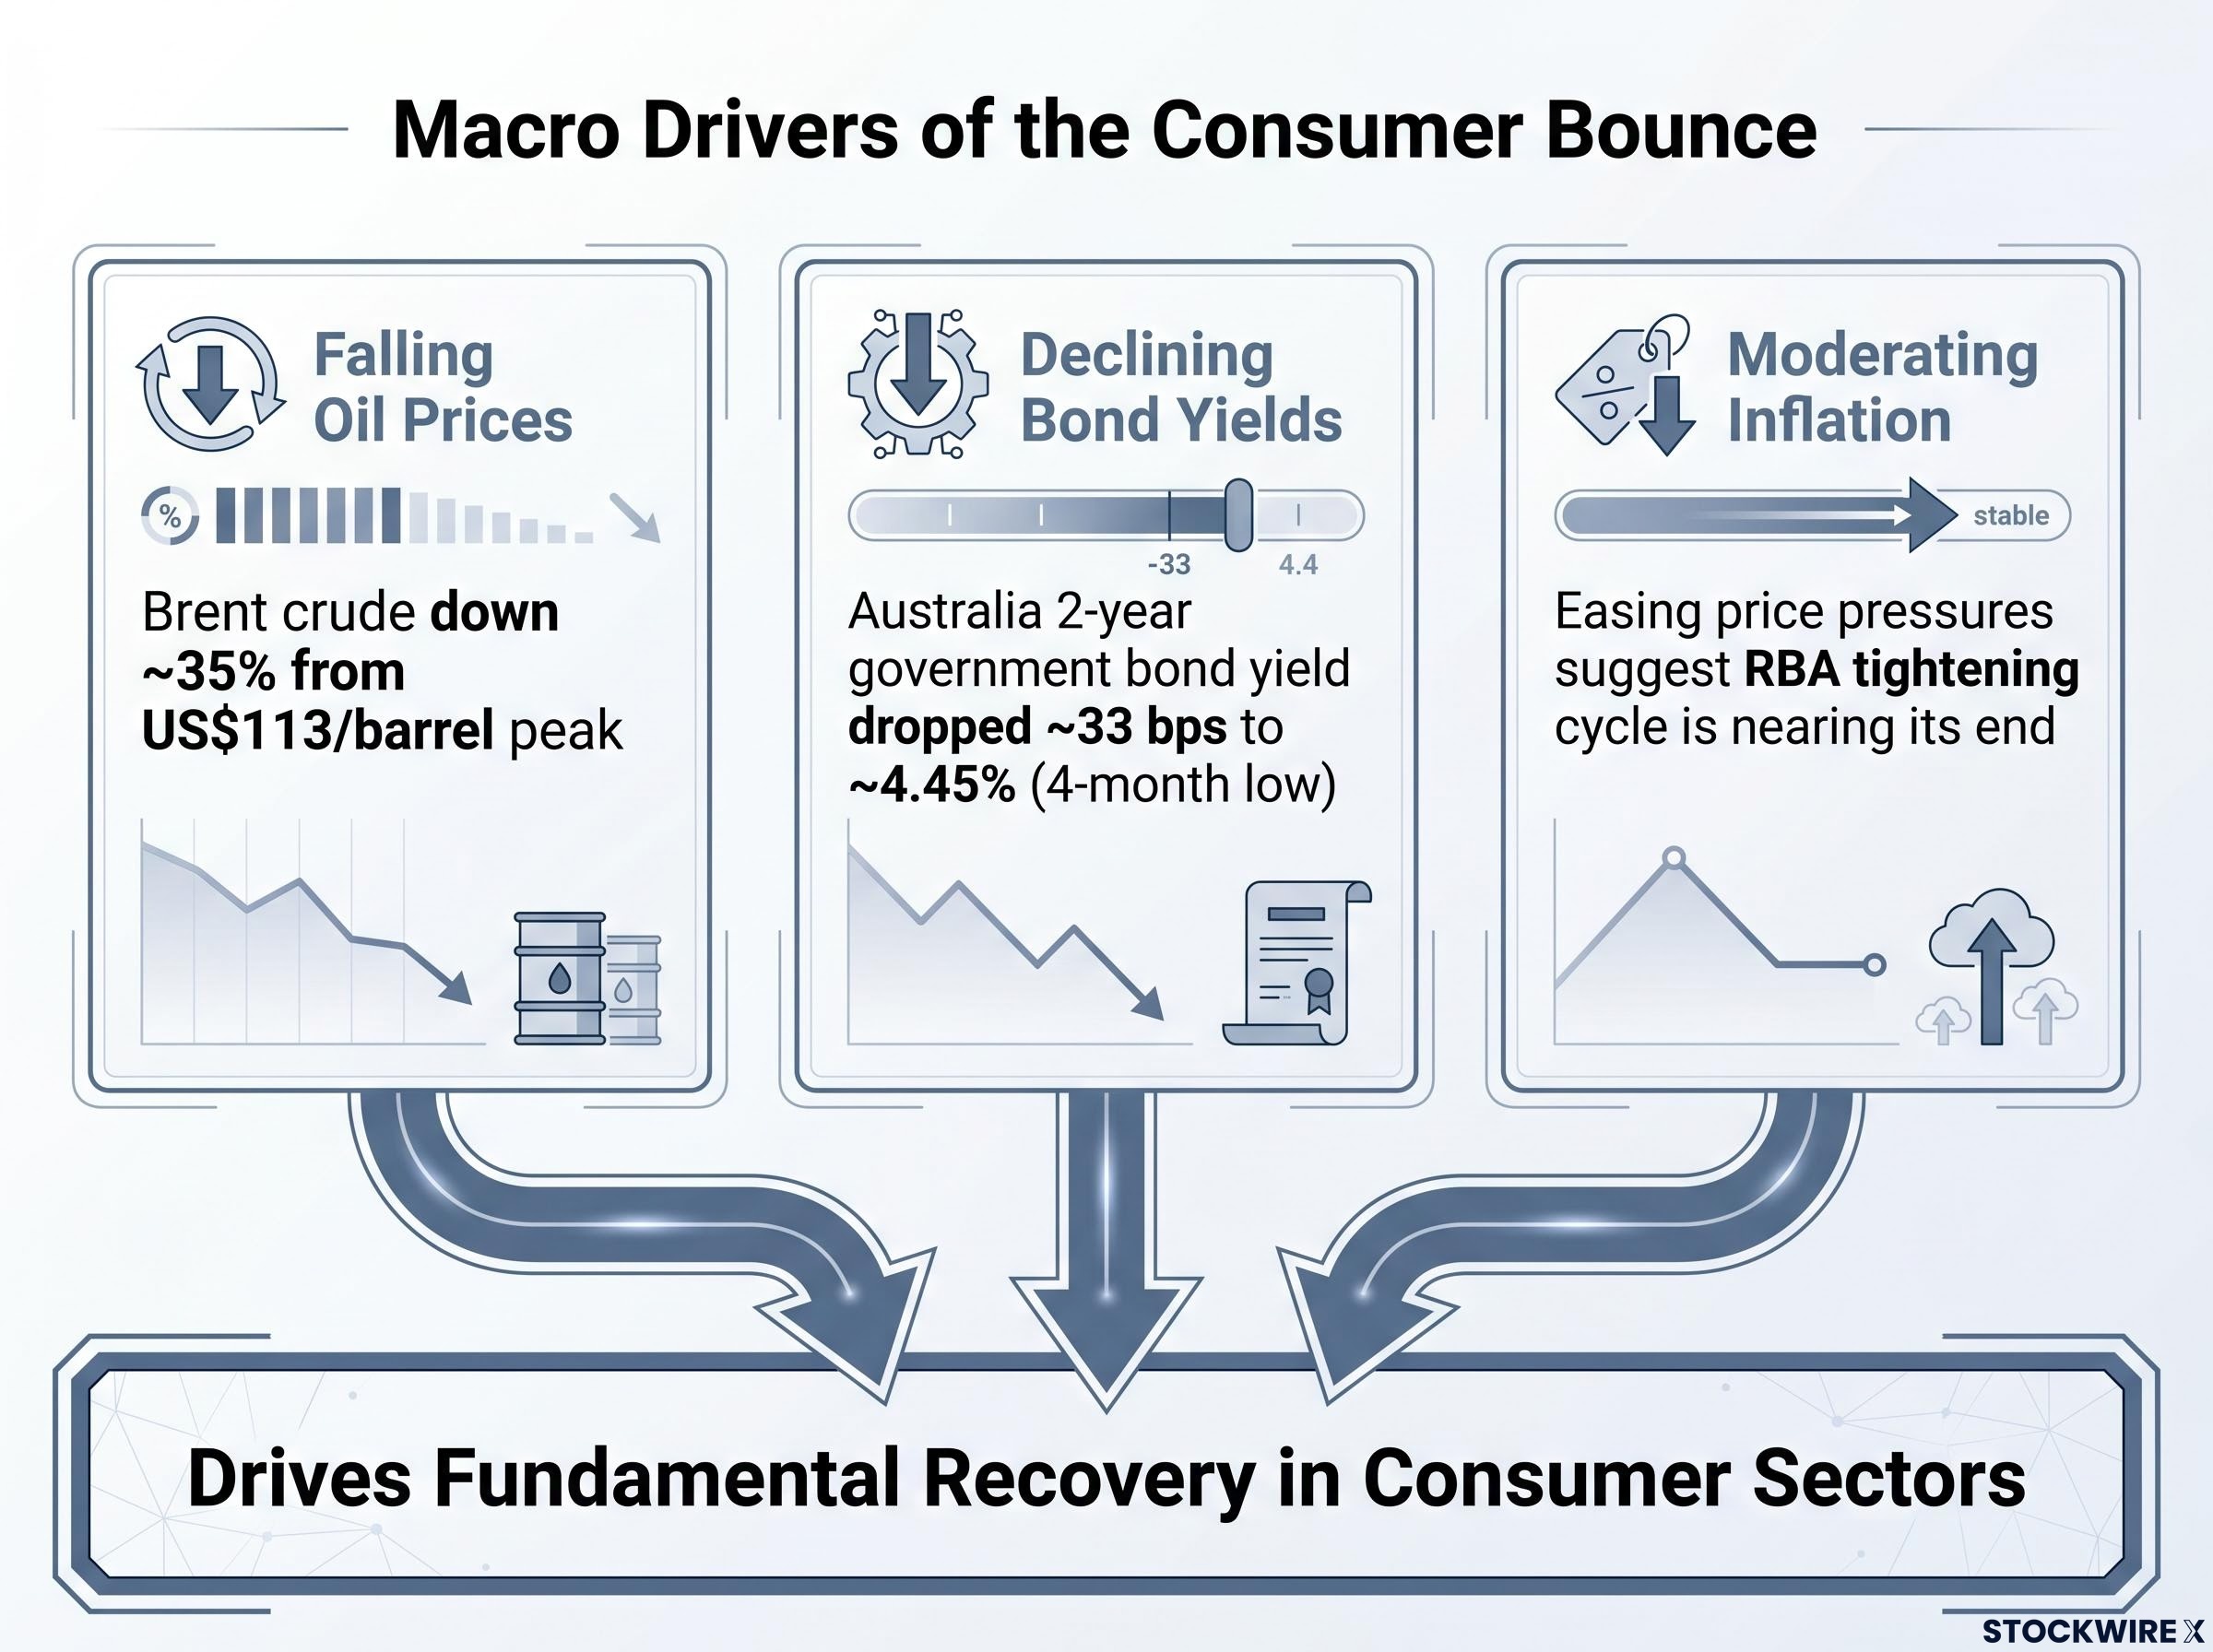
That combination, lower energy costs reducing household cost pressure while lower yields simultaneously reprice growth stocks upward, creates a stronger fundamental case than a simple dead-cat bounce. For investors weighing whether to add consumer exposure or take profits after June’s rally, the distinction matters: these are macro tailwinds with identifiable drivers, not just a snap-back from depressed prices.
The recovery in ASX discretionary stocks from multi-year lows reflects a household sector that is reallocating and value-seeking rather than spending freely, a distinction with direct implications for which retailers benefit most from the tailwind and how durable June’s gains are likely to be.
What is driving commodities lower, and what it means for resources stocks
The weakness in resources is not confined to a single commodity. The breadth of the pullback is what makes the pattern significant.
| Commodity | Record/Peak Price | Current Approx. Level | Decline from Peak |
|---|---|---|---|
| Gold | US$5,598/oz (29 January 2026) | ~US$4,142/oz | ~26% |
| Copper | US$6.70/lb (early June 2026) | ~US$6.14/lb | ~8.3% |
| Iron Ore | US$112/t (May 2026) | Below US$100/t | Over 10% |
Gold, copper, and iron ore all pulling back from record or near-record levels at the same time points to softer global growth expectations and the unwinding of speculative positioning, not a single-asset narrative. This is a broad softening.
For the ASX 200 specifically, that breadth matters. In a resources-heavy index, simultaneous multi-commodity declines create a persistent drag that the consumer recovery only partially offsets. The 6.7% and 8.8% drops in Materials and Energy during June were the direct consequence.
The question for resources investors is not whether the pullback hurts near-term earnings. It will. The question is whether the investment case for individual holdings relied on those extreme price levels continuing, or whether the business remains sound at current prices. That distinction separates a normalisation you can ride through from an exposure you should be re-evaluating.
Understanding earnings season and what the 12% growth forecast actually rests on
Earnings season, the period when listed companies report their financial results and provide forward guidance, is the next major information event for Australian equities. Ahead of it, the headline number looks constructive.
UBS has put forward a forecast of around 12% earnings growth in aggregate for the ASX 200 across FY26, a figure that would, taken at face value, justify current index valuations.
But there is a contradiction sitting beneath that number. Forward earnings estimates have been cut across every non-resources sector, with analysts signalling further downgrades are likely. Many forward price-to-earnings (P/E) ratios, which measure a company’s share price relative to expected earnings per share, may be built on assumptions that are already being revised downward.
Forward P/E ratios on the ASX 200 sit at roughly 17x, a level Morgan Stanley notes is at the upper boundary of the range historically consistent with Australian 10-year bond yields in the 5-6% band, leaving an equity risk premium of approximately 80 basis points as the only buffer if earnings disappoint.
Why resources dominate the aggregate earnings number
The resolution to the contradiction sits in the resources sector. Even after the recent commodity price falls, average prices for gold, iron ore, and copper over the full year have been at historically elevated levels. That means full-year resource earnings remain strong, and the resources sector’s contribution is large enough to pull the aggregate 12% growth figure upward even as other sectors are being downgraded.
The 12% is a real number. But it is not evenly distributed. If you are investing outside resources and relying on consensus forward P/E ratios without stress-testing the underlying earnings assumptions, you may be working from numbers that analysts are already quietly revising downward.
Two variables that will determine whether the FY26 earnings forecast survives
The UBS forecast remains constructive, but it is contingent. Two specific variables will determine whether the 12% aggregate growth figure holds through the second half of FY26:
- Whether commodity prices stabilise or continue falling. The resources sector is doing the heavy lifting in the aggregate earnings number. If gold, iron ore, and copper prices continue to decline through the second half, the resources contribution shrinks, and the full-year growth figure comes under pressure. Stabilisation at current levels, still well above long-run averages, would likely preserve the forecast.
- How deep and persistent non-resource earnings downgrades turn out to be. Forward estimates across consumer, financial, and industrial sectors have already been cut. The question is whether the cuts so far are sufficient, or whether reporting season reveals further deterioration in guidance and margins. The upcoming August reporting season will be the first substantive test, with management guidance statements carrying as much weight as the reported numbers themselves.
Investors who form a view on which of these two variables is more likely to resolve negatively have a basis for more differentiated positioning than a simple “buy or sell the index” call.
What the June split actually changes for Australian equity investors entering July
The ASX 200 is not a bullish or bearish call right now. It is a differentiation call. Sector and stock selection matter far more than the headline index view, and the June divergence is not noise that will correct itself. It reflects a genuine structural split in the Australian equity market.
Three positioning considerations follow from that:
- Consumer sectors: The recovery has fundamental backing (falling oil, lower yields, easing inflation), but 12-13% gains from multi-year lows leave investors with a decision: add on the thesis that this recovery is early-stage, or crystallise some of the June gains.
- Resources: The priority is distinguishing between businesses whose investment case assumed near-record commodity prices and those with sound economics at current levels. The two will perform very differently through the second half.
- Earnings: Treat forward P/E ratios with caution. Apply conservative, scenario-tested earnings assumptions rather than headline consensus figures that analysts are already revising.
The next major information event arrives with August reporting season results and guidance. That is when the positioning calls made in July will be tested, and when the question of whether the 12% earnings growth forecast survives will start getting a definitive answer. Investors who approach July with sector-level clarity, rather than a single directional view, will be better equipped to act on what the data reveals.
For investors looking to build a more structured view across each sector entering the second half, our dedicated guide to ASX sector positioning for H2 2026 maps which positions now carry structural support and which face persistent headwinds as the market shifts from narrative-driven to evidence-driven pricing.
This article is for informational purposes only and should not be considered financial advice. Investors should conduct their own research and consult with financial professionals before making investment decisions. Past performance does not guarantee future results. Financial projections are subject to market conditions and various risk factors.