
Why Hyperscaler Capex Could Be $300 Billion Bigger Than Priced
30 mins ago
Two of Wall Street’s most closely followed strategy desks published identical warnings on the same day, 22 June 2026. The next morning, the AI trade had its worst session in months.
UBS and Citi both flagged concentrated institutional positioning in AI-linked equities as a structural source of downside fragility, not merely a valuation concern. The selloff that followed on 23 June made those warnings look prescient. The mechanism they identified, crowded longs with large embedded profits in a narrow cluster of names, is precisely the setup that turns modest selling into cascading losses.
What follows gives you a clear framework for separating the AI trade’s structural story from its tactical positioning problem, and for understanding why Micron’s earnings report, scheduled for 25 June, is the market’s next real test of which version of the AI narrative holds.
There are two separate questions the market has been treating as one. The first is whether AI represents a genuine multi-year investment cycle. The second is whether the current risk-to-reward ratio in AI-linked equities still makes sense at these prices.
The core analytical split: Structural conviction (“AI is a transformative, multi-year cycle”) and tactical conviction (“this is still the right trade at these prices”) are distinct questions. The market has been conflating them. This article separates them.
The structural answer, for most institutional desks, remains yes. AI demand for compute, memory, and data-centre infrastructure continues to grow. But tactical confidence is eroding. UBS strategists led by Gerry Fowler noted on 22 June 2026 that investors are increasingly questioning remaining upside relative to downside risk. Some hedge fund investors had reportedly begun quietly reducing AI-related exposure ahead of the 23 June selloff.
Throughout 2025 and into 2026, institutional capital built up heavily across chip designers, hyperscale cloud operators, memory producers, and the wider AI infrastructure segment. When positioning reaches this density, price action becomes more a function of flows and risk management than of any incremental insight about the business fundamentals. Holding conviction in AI as a technology does not, by itself, protect a portfolio from the mechanical risks of owning a crowded trade at peak positioning.
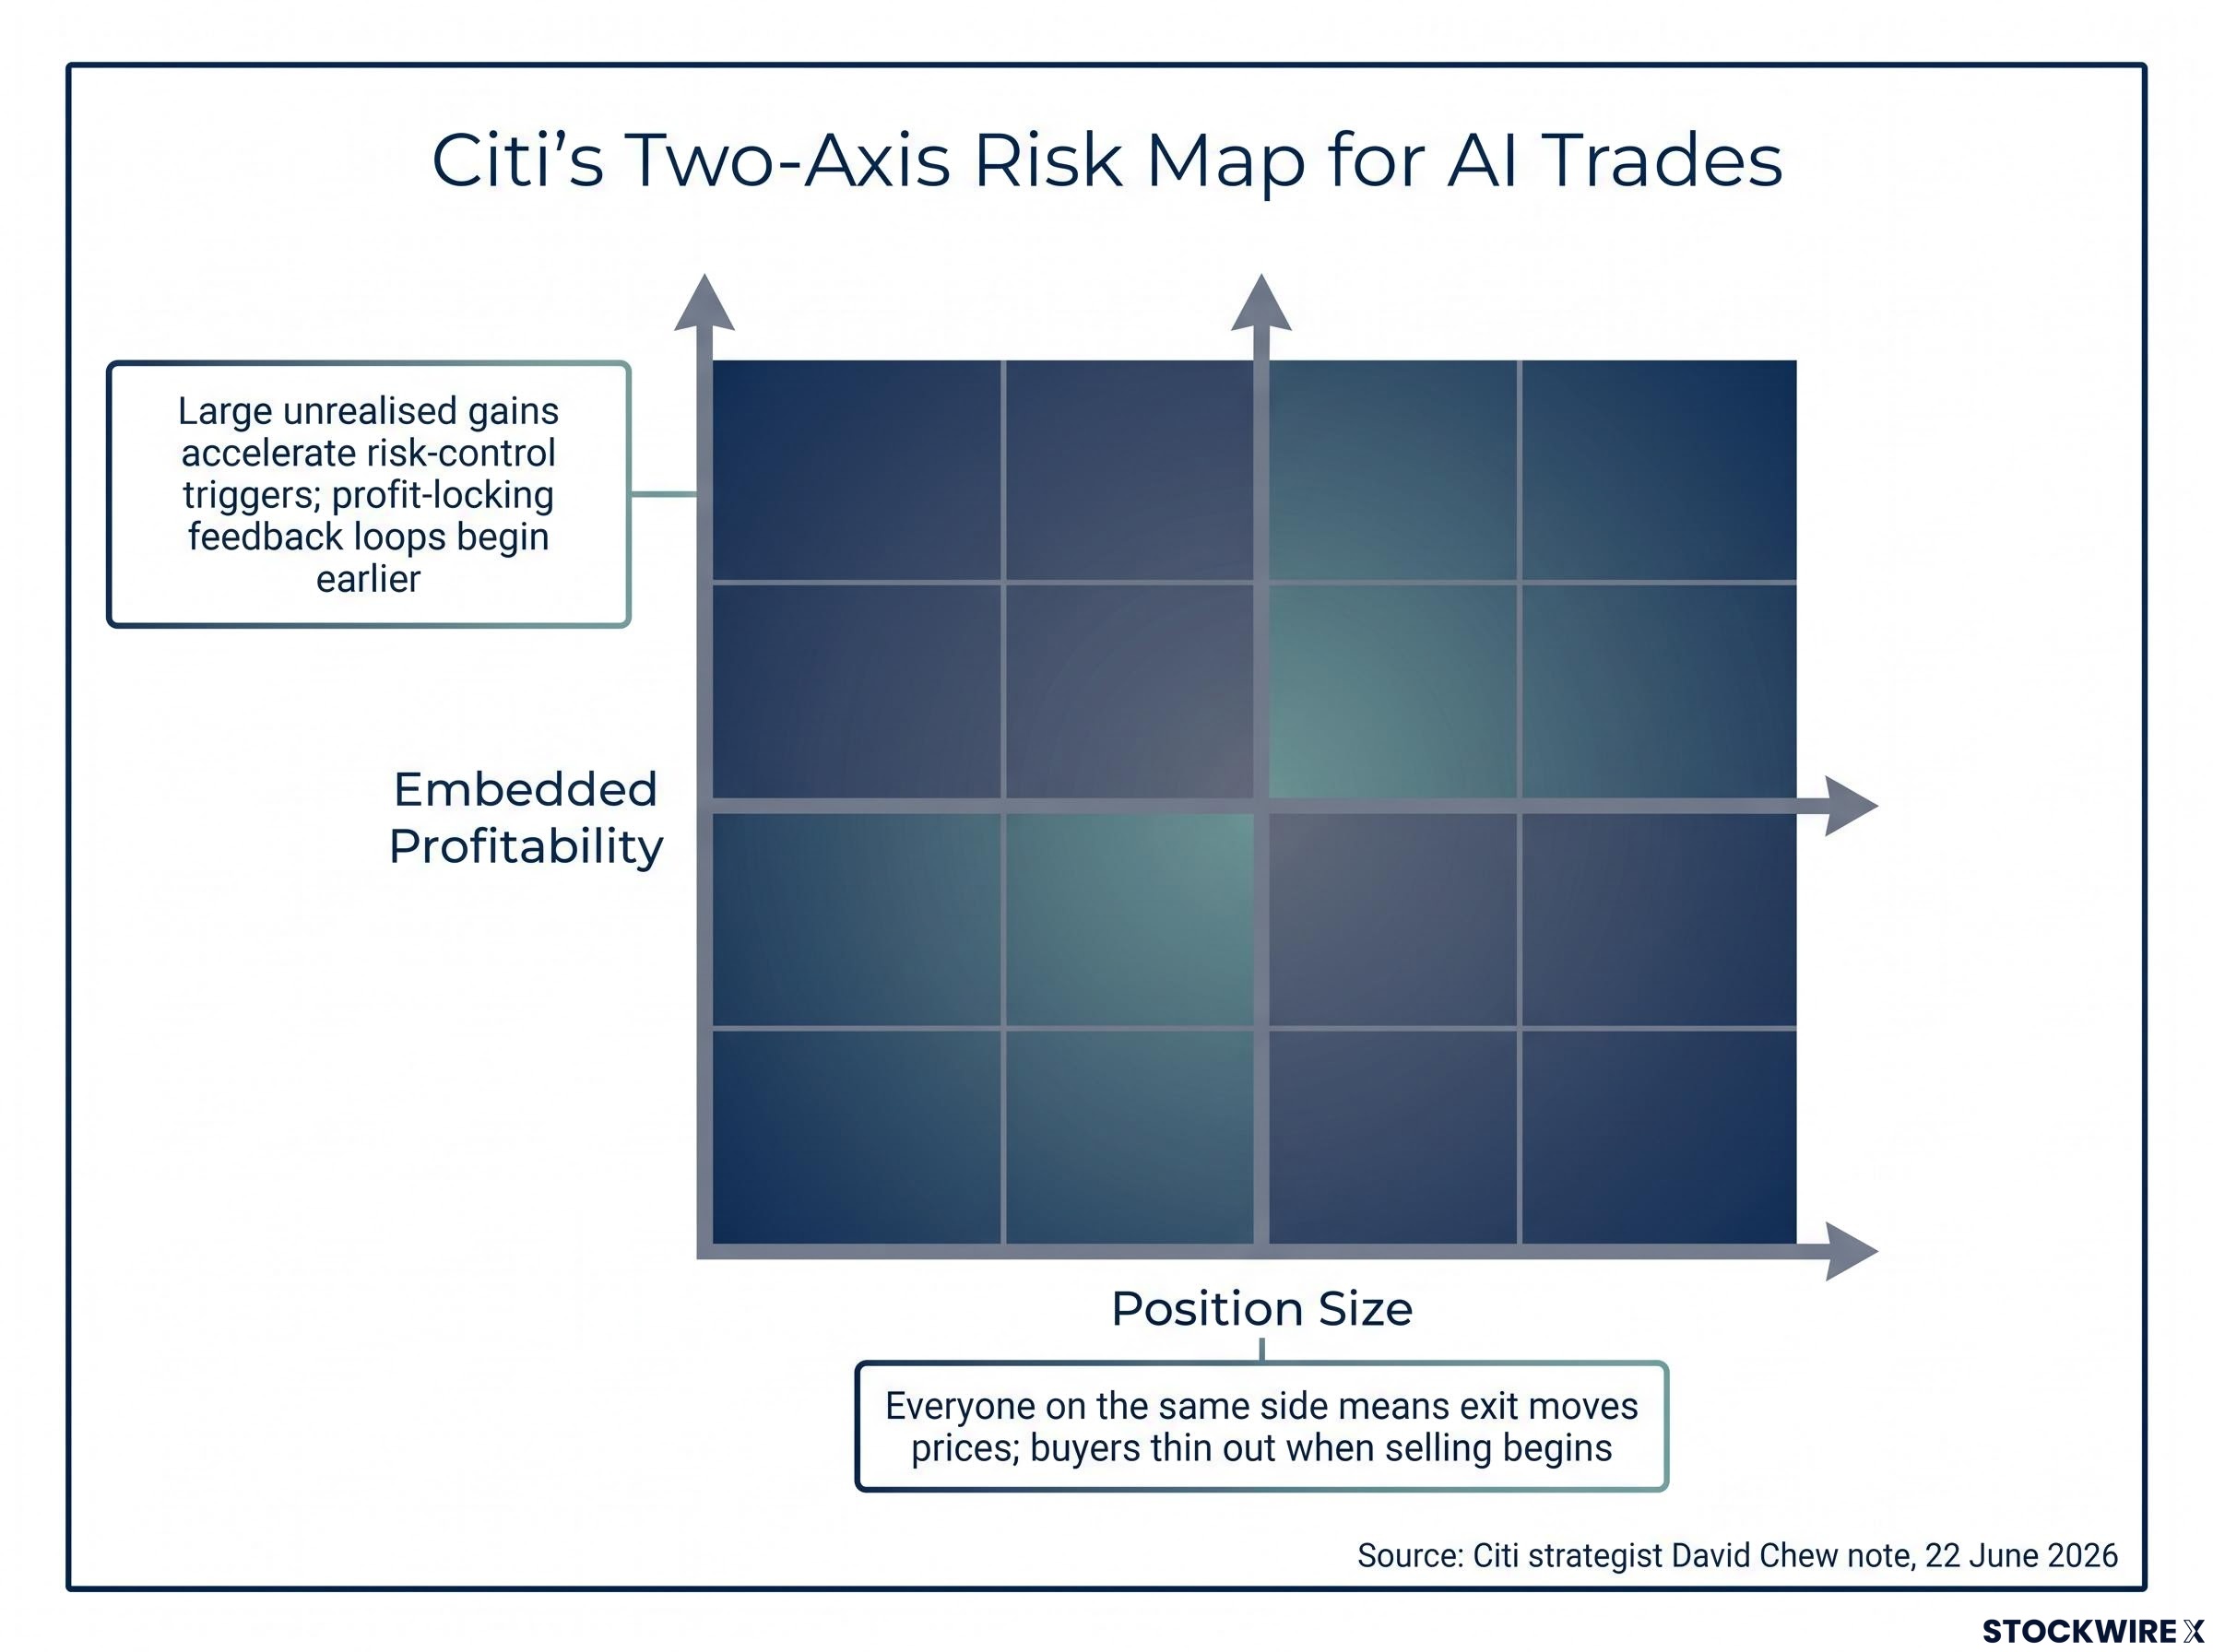
Citi strategist David Chew framed the vulnerability along two axes in the firm’s 22 June 2026 note, and it is the combination that makes the current setup more dangerous than either dimension alone.
The first axis is position size. When institutional capital crowds into a narrow set of names, buyers thin out on exit. Any attempt to sell in size moves prices, because there is no natural counterparty on the other side.
The second axis is embedded profitability, and this is the one most investors underestimate. Large unrealised gains sitting inside institutional portfolios shorten the fuse on de-risking. When volatility rises, risk managers do not wait for a fundamental thesis to break. They lock in profits. The larger the embedded gain, the faster those controls trigger.
| Risk Dimension | Why It Amplifies Selling |
|---|---|
| Position Size | Everyone on the same side means exit moves prices; buyers thin out when selling begins |
| Embedded Profitability | Large unrealised gains accelerate risk-control triggers; profit-locking feedback loops begin earlier |
For a reader holding AI-linked equities, the profitability dimension means that strong past performance is now itself a risk factor, not just a reward. It shortens the fuse on institutional de-risking even in the absence of any fundamental deterioration.
The AI trade crowding is not a U.S.-only story. Citi noted that KOSPI valuations had climbed back to stretched territory, reflecting the sharp rerate across Korean memory and foundry names driven by high-bandwidth memory (HBM) and AI server demand. That makes any institutional unwind a global supply-chain event, with Korean semiconductor exposure amplifying the same positioning fragility visible in the Nasdaq.
Understanding the mechanics of crowded-trade unwinds helps you distinguish between a temporary dip worth sitting through and the early stages of something structurally driven. The distinction determines whether patience or action is the right response.
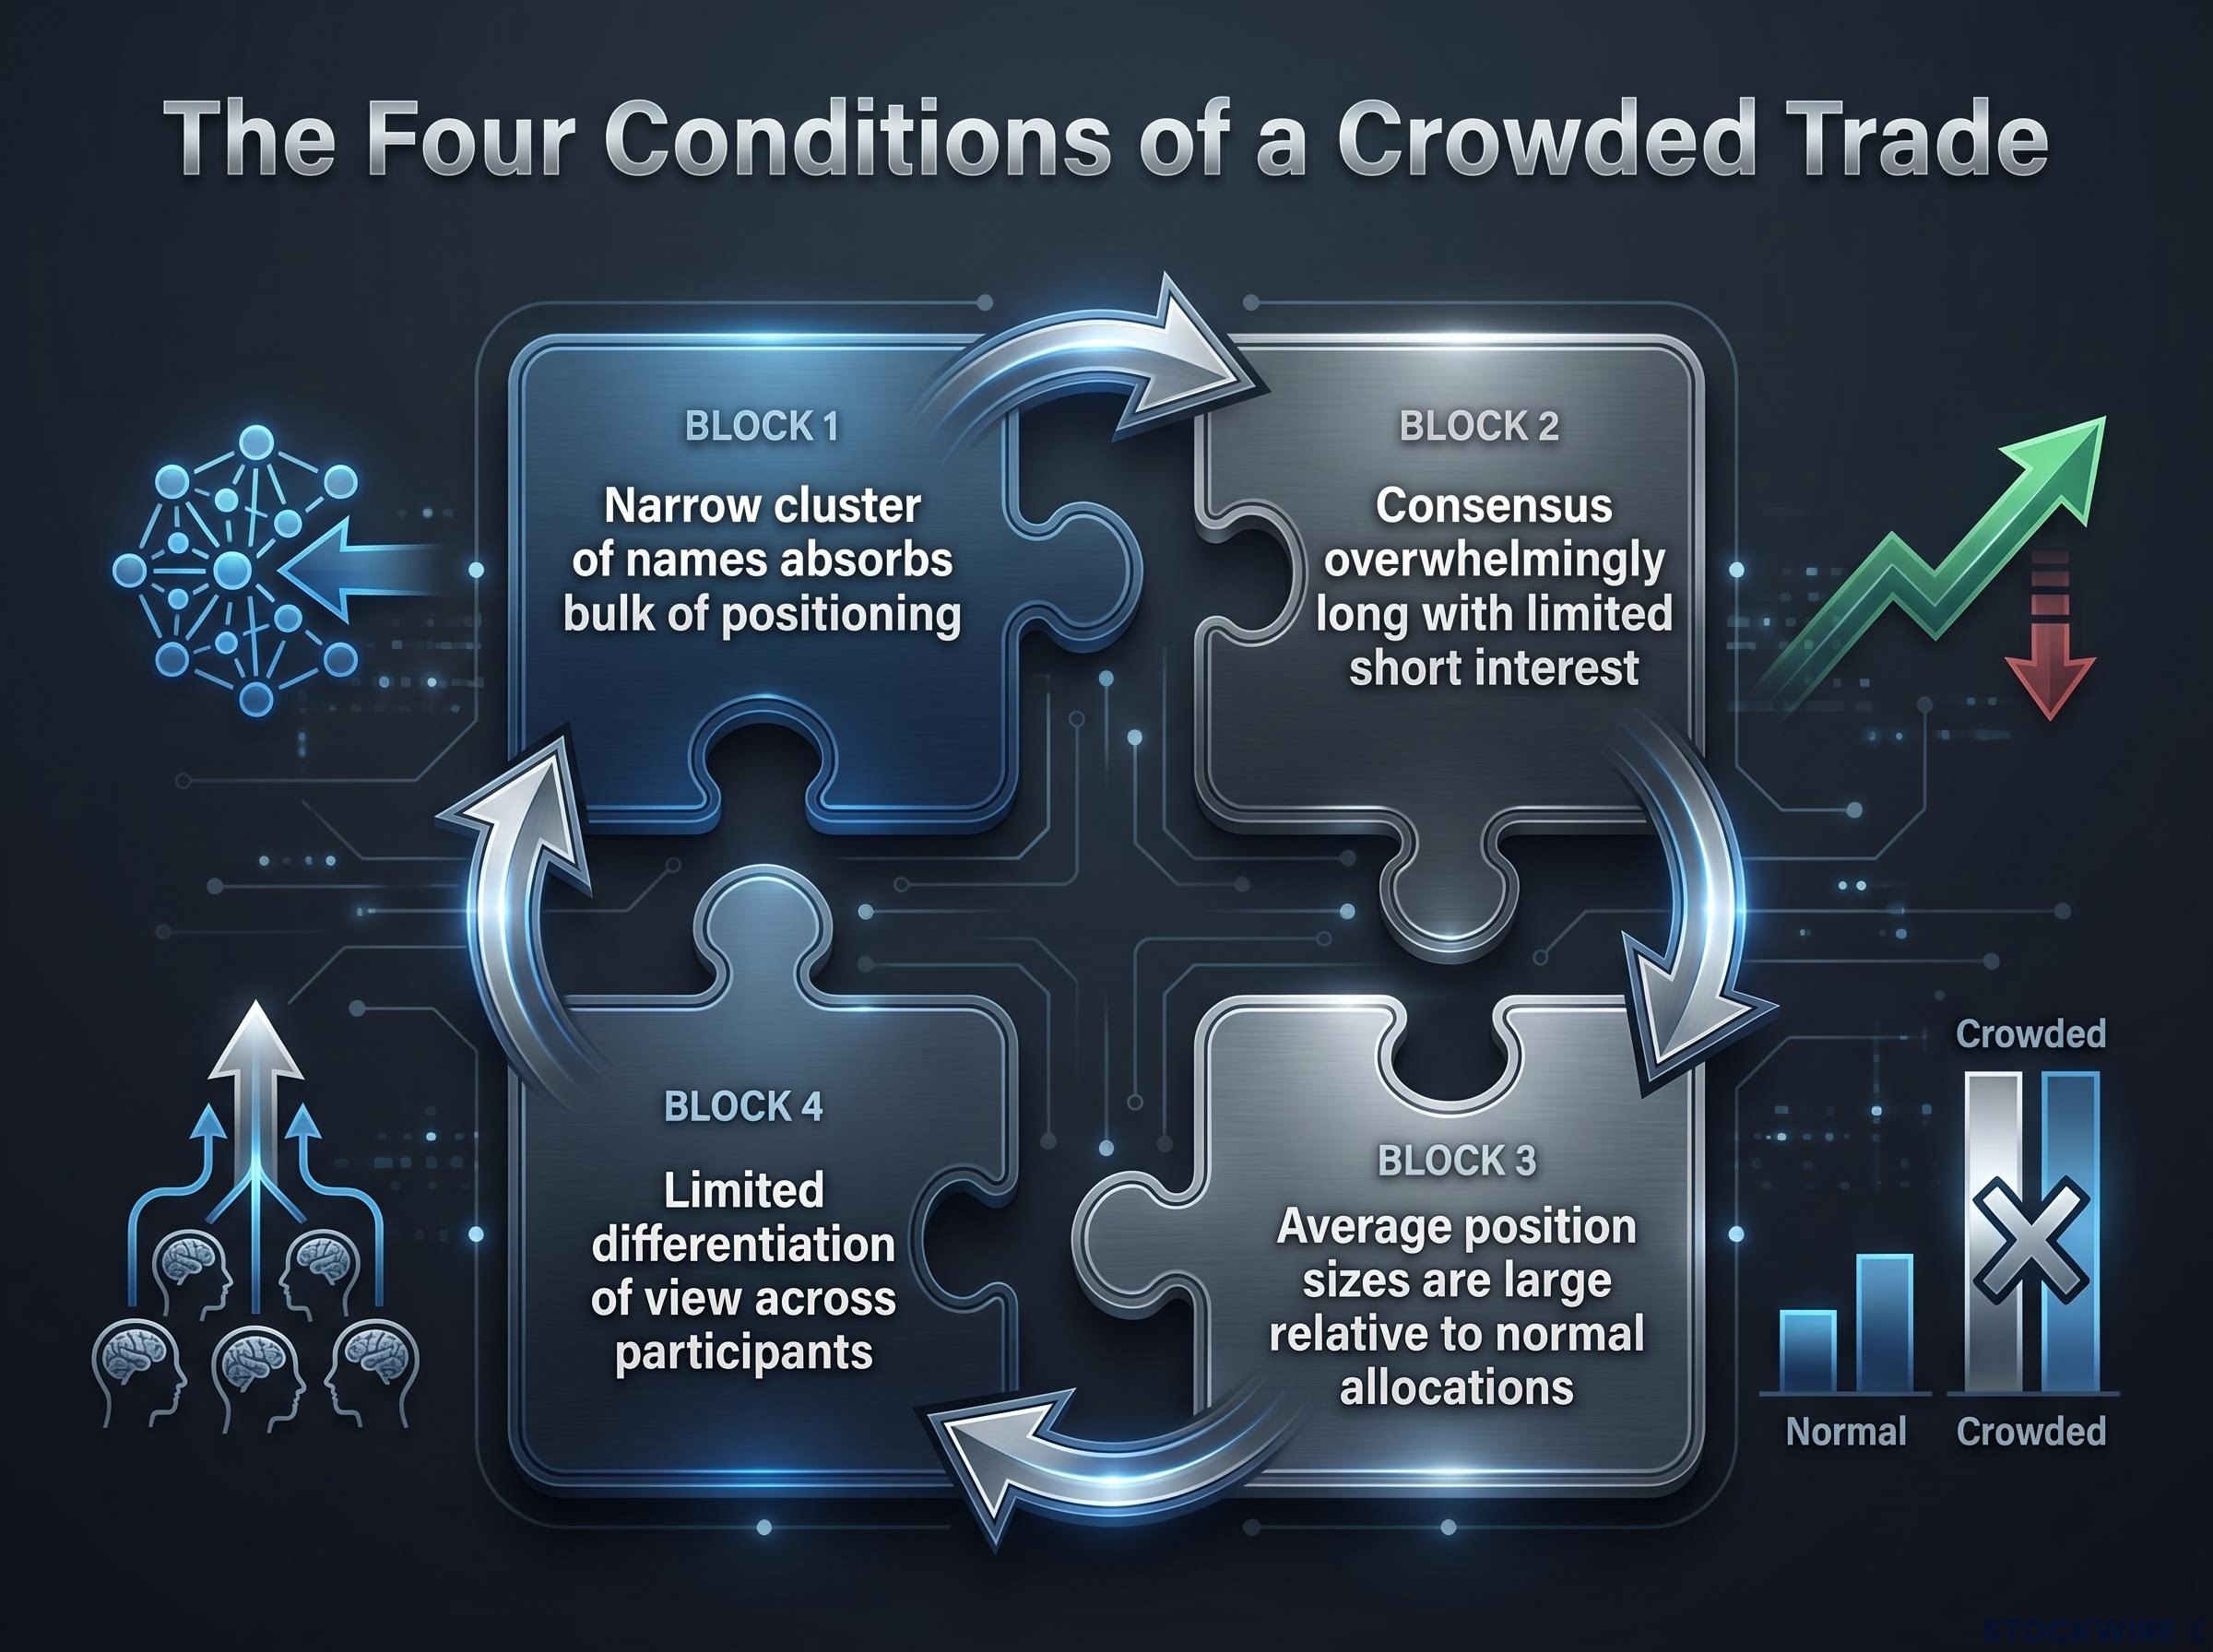
A trade becomes “crowded” in institutional terms when four conditions converge:
The current AI setup matches all four. UBS noted on 22 June 2026 that profitable long positions were deeply extended in both size and profitability. And the unwind dynamic follows a recognisable pattern.
The BofA survey’s AI crowding data provides the institutional scale behind what UBS and Citi identified in their June 2026 notes: 80% of fund managers in the June survey named long global semiconductors as the most crowded trade ever recorded, with semiconductor crowding accelerating from roughly 24% in April to 80% in June, a pace of concentration with no historical precedent in the survey’s 12-year history.
Selling starts at the margin. The first movers are not panicking; they are following risk management protocols. Hedge funds quietly reducing AI exposure ahead of the 23 June selloff illustrate this phase. Then a recognisable trigger appears, an earnings miss, a guidance downgrade, a macro shock, and risk controls and profit-locking create feedback loops. Rational individual behaviour produces irrational collective outcomes in price.
AMF research on crowded trade momentum crashes provides empirical grounding for the feedback loop described here, showing that when investors hold myopic beliefs about the durability of a positioning trend, the eventual unwind tends to be faster and larger than the buildup phase, precisely because the exit is collective rather than staggered.
The macro overlay compounds this. UBS emphasised that higher real yields, tighter financial conditions, and policy uncertainty add downside skew on top of the micro-level positioning fragility. The crowding is not sitting in a benign macro environment.
To understand why the crowding is vulnerable, you need to understand the engine that powered it. Through 2025 and into 2026, hyperscaler infrastructure commitments drove consensus earnings estimate upgrades across semiconductors, memory, and data-centre infrastructure names. Those upward revisions justified premium multiples. As long as estimates kept rising, paying elevated prices felt rational.
UBS strategists led by Gerry Fowler warned on 22 June 2026 that hyperscaler spending commitments powering the upward revision cycle may be approaching a practical limit, which could erode the fundamental support that has underpinned elevated valuations across AI supply chain names.
The logic is straightforward. Once hyperscaler spending programmes approach practical saturation, the incremental revision impulse slows. Without fresh upward revisions, the fuel that supported expensive consensus-long positions disappears. And if the revision tailwind stalls, investors in AI names face not just a positioning problem but a valuation re-anchoring problem. The question shifts from “will the multiple hold?” to “what does the right multiple even look like now?”
Those historical valuation benchmarks show just how unusual the current setup is: the S&P 500 Shiller CAPE ratio of 40-41 as of mid-2026 is the second-highest reading in 155 years of market data, exceeded only by the dot-com peak of 44.2, and the top 10 index constituents now control a share of total market capitalisation more than 50% above the dot-com era peak concentration.
The first path is a second wave of capex at higher levels. If hyperscalers announce expanded infrastructure commitments beyond current programmes, the upward revision cycle restarts and premium valuations find fresh fundamental support.
The second path is a shift from capex justification to AI monetisation. Here, the valuation anchor moves from infrastructure spending commitments to actual revenue and margin from deployed AI workloads. Without either renewed capex acceleration or clear evidence that AI revenues are outpacing infrastructure costs, sustaining premium multiples becomes materially harder.
On 23 June 2026, Micron shares rose 6.82%, trading at $1,211.38 with approximately 53.14 million shares traded, making it one of the session’s most active names.
That price reflects a stock that has been one of the top-performing equities over the prior 12-month period. High-bandwidth memory is a bottleneck for AI accelerators, which makes Micron’s HBM and DRAM franchises among the purest reads on actual AI compute build-out volume. The company’s scheduled earnings report (expected around 25 June 2026, though some public calendars indicate 24 June; investors should verify the confirmed date) is therefore a live stress test of the questions UBS and Citi raised.
HBM supply constraints explain a large part of why Micron’s positioning is so asymmetric heading into earnings: SK Hynix has projected a global DRAM shortage lasting through 2030, with HBM inventory sitting at just 3-4 weeks industry-wide and all three major producers fully sold out through 2026, meaning demand signals from Micron’s results carry weight well beyond a single quarter.
The asymmetric setup is what matters. Expectations are already lofty, which means strong results are largely priced in and upside is muted. Disappointing results or cautious guidance, on the other hand, carry disproportionate downside because there is little margin of safety in current positioning. In-line results are unlikely to be good enough to hold current valuations, which places the burden of proof squarely on the bull case.
| Scenario | Conditions | Likely Market Outcome |
|---|---|---|
| Upside beat with confident guidance | Revenue and EPS beat consensus; HBM shows strong volume and pricing; management guides to accelerating hyperscaler demand | AI trade receives a fundamental anchor; dip-buyers have justification; crowding risk persists but is harder to act on |
| In-line with mixed guidance | Numbers meet expectations but HBM or hyperscaler commentary is balanced; signs of normalisation in order growth or pricing | Reinforces capex revision ceiling narrative; crowded longs become more sensitive to subsequent negative data; gradual de-risking accelerates |
| Miss or negative guidance inflection | Shortfall vs. consensus; evidence of delayed orders, inventory adjustments, or more disciplined hyperscaler capex | Supplies the trigger UBS and Citi warned about; risk controls and profit-taking could drive disorderly unwind across AI-linked semis and broader tech |
Micron’s results are not just a company event. They are a live signal on whether the AI infrastructure cycle is accelerating, plateauing, or beginning to normalise, with consequences for the entire crowded trade.
The structural AI thesis, sustained demand for compute, memory, networking, and data-centre infrastructure, remains intact. That is not what UBS and Citi are questioning. The underlying technology cycle has not broken.
Goldman Sachs tech bubble historical analysis, published in March 2025 to mark 25 years since the dot-com peak, draws a careful distinction between structural innovation cycles and tactical overvaluation episodes, finding that transformative technology and equity excess frequently coexist before diverging sharply once the revision cycle stalls.
What is at issue is the pricing and positioning layer. Valuations in leading AI names have moved to levels that assume persistent double-digit growth and effective monetisation of AI workloads. Flows, not fundamentals, dominate near-term price action. Strong Micron results would suggest the market may have priced the cycle aggressively but not irrationally. Weak results would suggest that expectations, not the thesis, need repricing.
Two variables will determine whether the current fragility resolves into a healthy reset or escalates into a broader unwind:
The practical implication is that you can hold a bullish AI view and still make a tactical decision to reduce exposure to the most crowded names. Those are two separate questions, and this week’s turbulence has forced them into the open. Less-crowded parts of the AI ecosystem may benefit from capital rotation if current leaders de-rate, a possibility worth watching as earnings season unfolds.
For readers wanting to place the current structural AI thesis in longer-run historical context, our full explainer on AI infrastructure cycles and historical boom-bust patterns examines how railway, fibre-optic, and computing booms each followed a similar arc of overinvestment, capital destruction, and eventual productivity realisation on surviving infrastructure, with the key structural difference in the current cycle being that the buildout is funded by cash-flow-positive incumbents rather than debt-financed startups.
This article is for informational purposes only and should not be considered financial advice. Investors should conduct their own research and consult with financial professionals before making investment decisions. Past performance does not guarantee future results. Forward-looking statements regarding capex cycles, AI monetisation, and earnings scenarios are speculative and subject to change based on market developments and company performance.
An AI stock bubble refers to a situation where equity valuations in AI-linked names have moved beyond what fundamentals justify, driven by crowded positioning and momentum rather than earnings reality. The structural AI cycle, the genuine multi-year demand for compute, memory, and data-centre infrastructure, can remain intact even as the pricing and positioning layer becomes dangerously extended.
Both firms flagged concentrated institutional positioning in a narrow cluster of AI-linked equities as a structural source of downside fragility: large embedded profits in crowded long positions mean that when volatility rises, risk managers lock in gains automatically, turning modest selling into cascading losses without any change in the fundamental thesis.
A crowded trade occurs when a narrow cluster of names absorbs the bulk of institutional positioning, consensus is overwhelmingly long with limited short interest, average position sizes are large, and participants all hold essentially the same thesis. The BofA June 2026 fund manager survey found 80% of managers named long global semiconductors as the most crowded trade ever recorded, accelerating from roughly 24% in April to 80% in June with no historical precedent in 12 years of survey data.
Micron is one of the purest reads on actual AI compute build-out volume because high-bandwidth memory is a bottleneck for AI accelerators. Expectations heading into its scheduled 25 June 2026 report are already lofty, meaning strong results are largely priced in, while any miss or cautious guidance could supply the trigger UBS and Citi warned about and drive a disorderly unwind across AI-linked semiconductors.
Yes. UBS and Citi are not questioning the underlying technology cycle; sustained demand for compute, memory, networking, and data-centre infrastructure remains intact. The concern is purely the pricing and positioning layer: valuations assume persistent double-digit growth and effective AI monetisation, and a correction would reprice expectations rather than invalidate the structural thesis.


