
What SpaceX’s $75B IPO Means for Canadian Index ETF Investors
54 mins ago

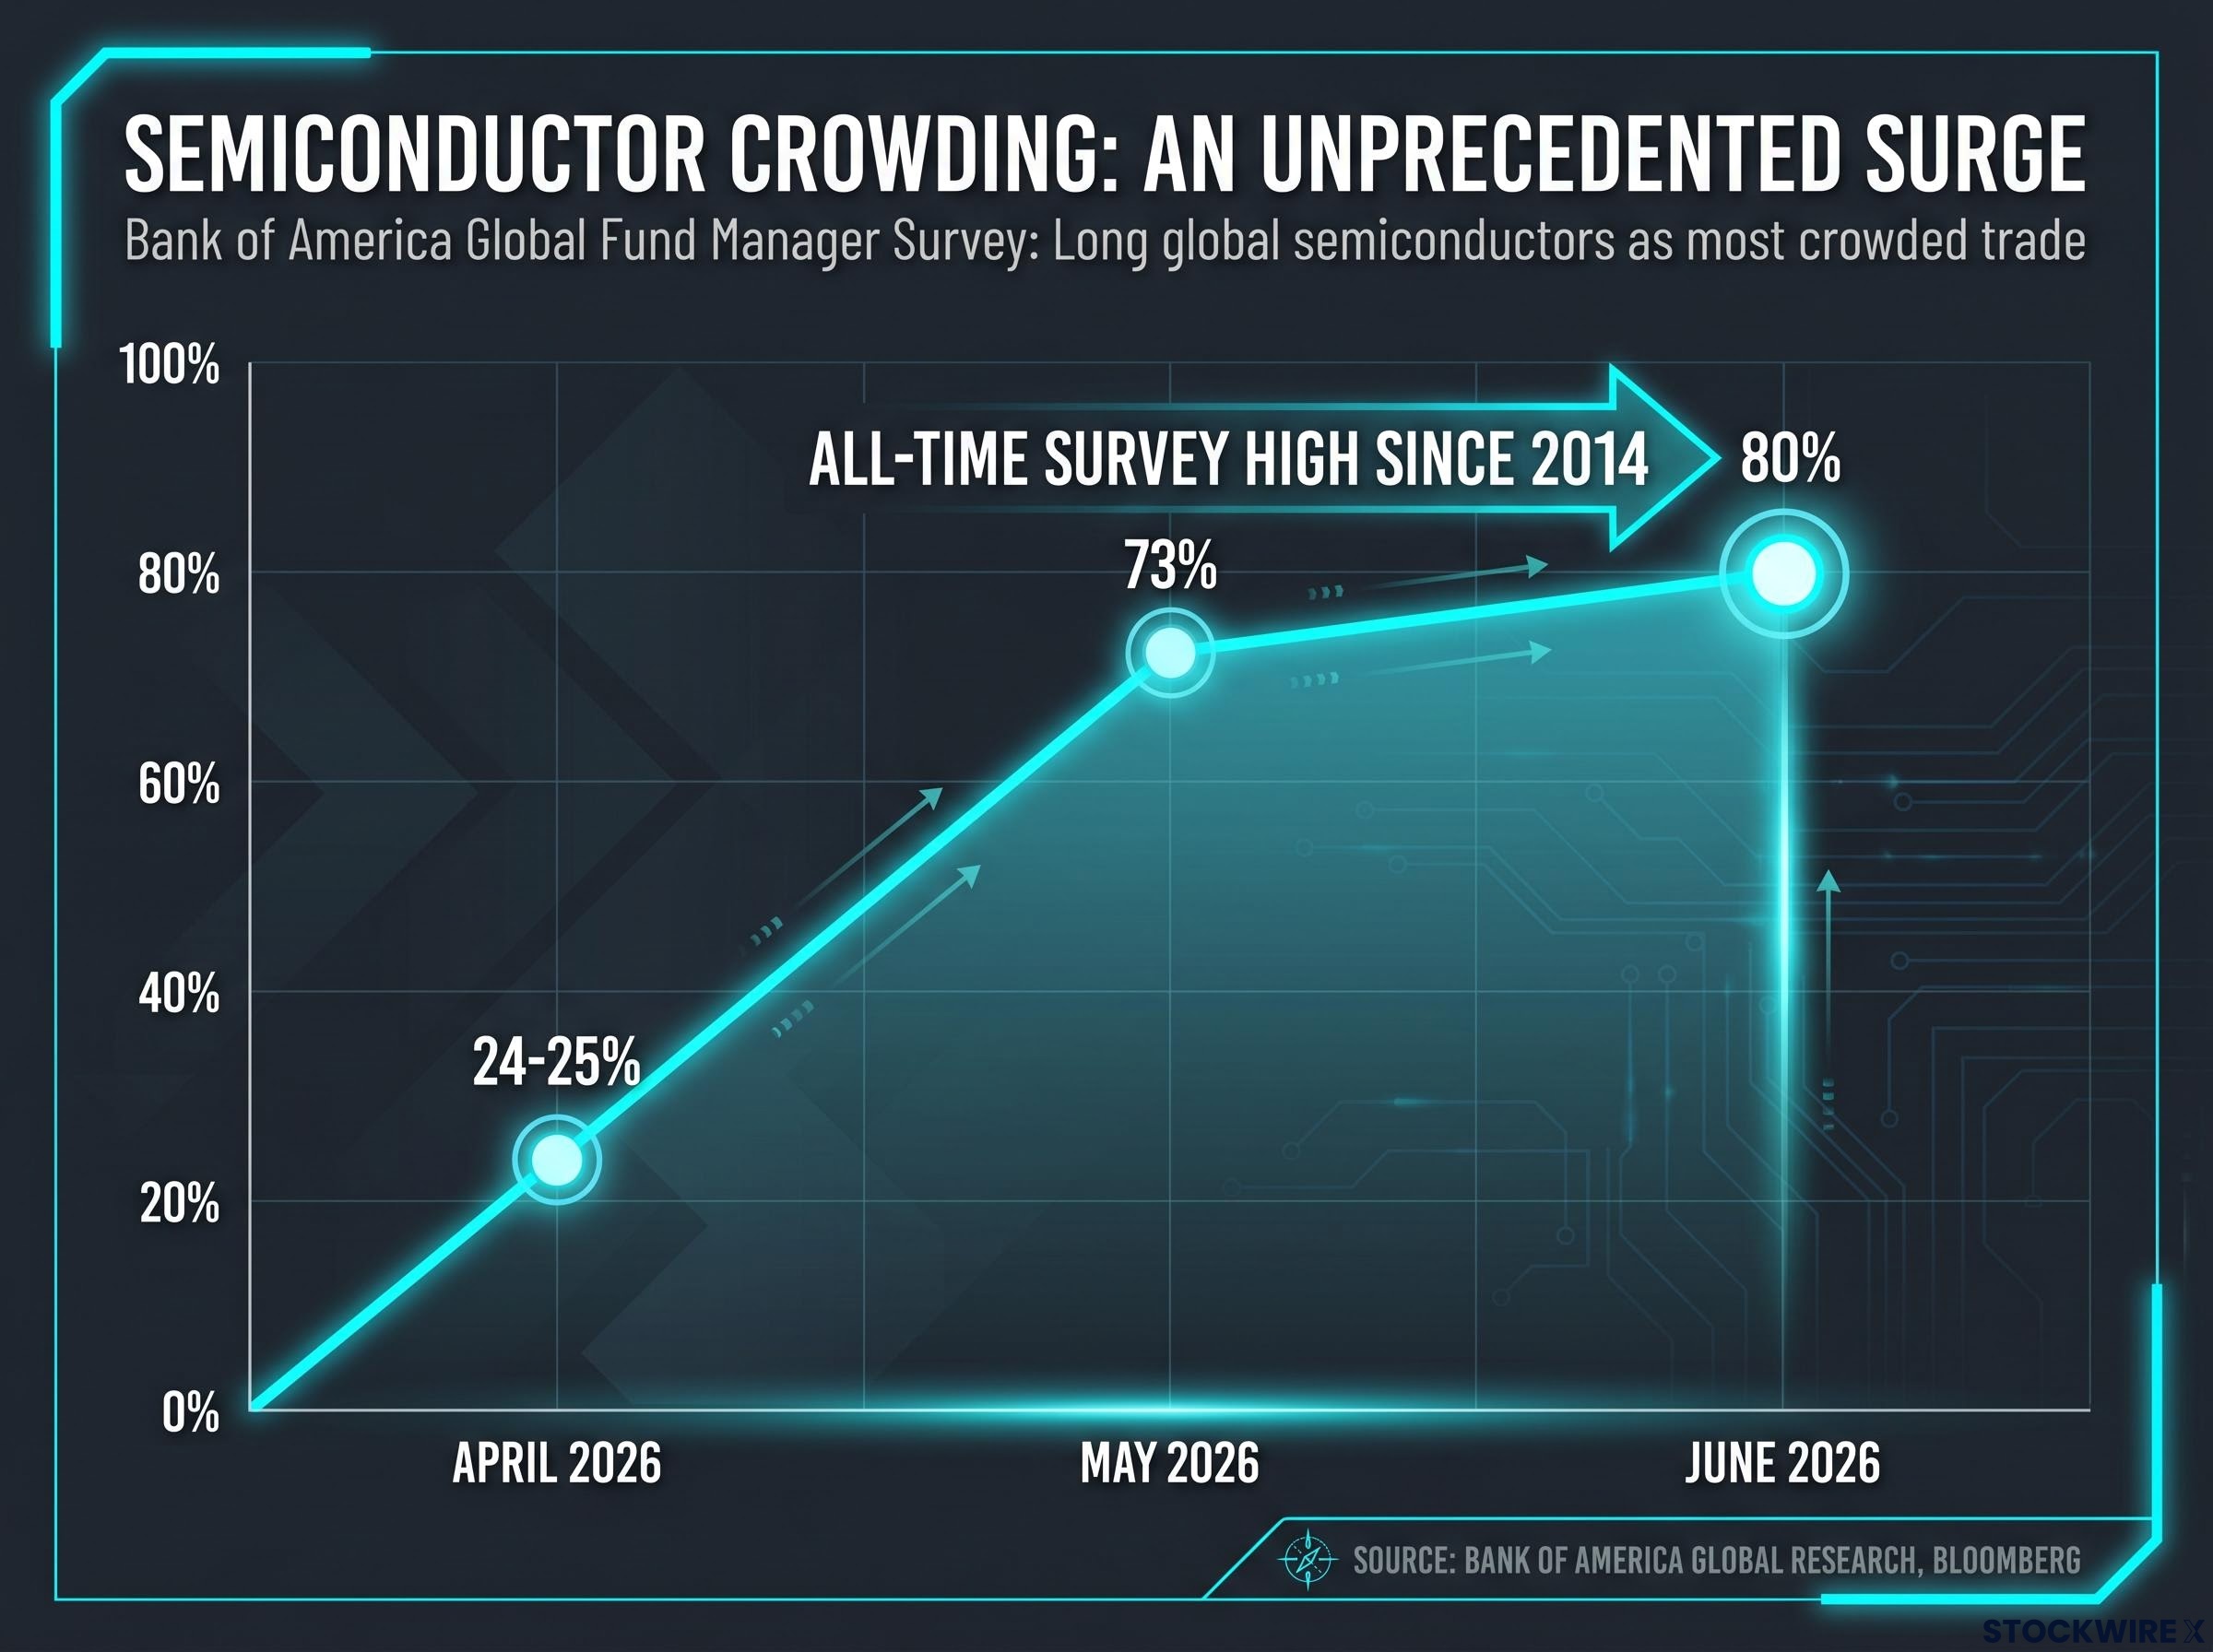
One data point defines the June 2026 Bank of America Global Fund Manager Survey: 80% of institutional managers identified long global semiconductors as the most crowded trade ever recorded in the survey’s history. The reading crystallises a tension that has been building inside professional portfolios for months, and it arrives at exactly the wrong moment.
Inflation fear has returned to the top of the institutional tail risk table. Fund managers are actively trimming equity and technology exposure while rotating toward inflation-resilient corners of the market. The confluence of record crowding, resurgent macro anxiety, and deliberate repositioning makes this edition of the survey one of the most consequential reads on institutional risk signals in recent memory.
What follows is an examination of what the June 2026 survey actually signals about where professional capital is moving, which risks institutional investors are pricing as most dangerous, and where Bank of America identifies contrarian opportunity in a market caught between an unbroken AI structural thesis and a positioning vulnerability that has never been larger.
The scale of the June 2026 reading has no precedent. The Bank of America Global Fund Manager Survey has tracked crowding data since 2014, sampling approximately 200 managers overseeing $517 billion in assets under management (AUM), the total value of investments a firm manages on behalf of clients. No prior edition produced a number like this one.
The speed of the escalation is as striking as the level itself:
The escalation from 73% in May to 80% in June did not occur in a vacuum; the BofA survey warning signals identified in the prior month already included sub-4% cash levels and a Bull and Bear Indicator approaching its second independent sell threshold, meaning the June reading arrived on top of a positioning structure that was already stretched to historically unusual limits.
The June 2026 reading of 80% represents the all-time high in the survey’s recorded history, surpassing every prior crowding reading for any single trade since the series began in 2014.
This is not a commentary on AI fundamentals. It is a positioning signal. When 80% of surveyed managers already own the same trade, the marginal buyer pool shrinks to its smallest possible size while the potential seller base sits at its largest. Semiconductors have become the default liquid proxy for AI exposure, meaning any institutional de-risking impulse hits this sector first and hardest.
A crowding reading tells investors something specific about the mechanics of price support. When most natural buyers are already positioned, the next leg of demand must come from new entrants rather than existing holders adding. That is a structurally weaker foundation for absorbing negative surprises.
The distinction matters. The long-term AI thesis can remain structurally correct while the trade is tactically dangerous. Both conditions can be simultaneously true, and the June 2026 survey suggests they are. The asymmetry has flipped: the upside requires continued new buying into an already saturated position, while the downside requires only a fraction of existing holders to reduce exposure at the same time.
Correlation compounds the risk. When institutional investors want to trim AI exposure quickly, semiconductors are the first and most liquid exit. A single disappointing earnings season, a shift in rate expectations, or a geopolitical shock does not need to invalidate the AI investment case to trigger a positioning-driven correction. It only needs to prompt enough holders to act at once.
BIS research on institutional herding in equity portfolios establishes that when a critical mass of professional investors converge on the same position, the probability of correlated selling during stress events rises sharply, creating the asymmetric downside mechanics that the June 2026 semiconductor crowding reading now embodies.
A specific earnings risk now operates in parallel with this positioning fragility. Capital expenditure into data centres, GPUs, and power infrastructure has surged throughout the AI build-out. If application-layer monetisation, the point at which businesses generate revenue from AI products rather than simply spending on AI infrastructure, lags this investment cycle, the earnings trajectory priced into semiconductor valuations becomes vulnerable.
A slower-than-expected monetisation timeline would force valuation re-pricing across the full AI chain: chips, equipment, infrastructure, and parts of software. This is not a binary question of whether AI works. It is a timing question of whether the payoff arrives fast enough to justify the multiples already embedded in share prices.
The AI capex-to-revenue lag that Morningstar analysts estimate at 18-24 months sits at the centre of this valuation vulnerability; hyperscalers have collectively committed upward of $725 billion in 2026 capital expenditure guidance, but Gartner estimates only 20% of current AI agent pilots are scalable to production by 2027, meaning the earnings trajectory already embedded in semiconductor multiples assumes a monetisation timeline that remains unverified.
The June 2026 tail risk rankings deliver a finding that reshapes how the crowding problem should be understood. Inflation is back at the top of the institutional worry list, and it converges directly onto the same positions that are already historically over-owned.
| Tail Risk | June 2026 % | May 2026 % |
|---|---|---|
| Second inflation wave | 34% | ~40% |
| AI asset bubble | 28% | N/A |
A majority of surveyed managers shifted their macro base case toward below-trend growth combined with above-trend inflation during early-to-mid 2026. That is the regime where rate cuts arrive later, shallower, and slower than markets have priced. Inflation expectations reached their highest levels since 2021 in spring 2026 survey readings.
The inflation impact on equity returns operates through a mechanical sequence that is well-documented in BofA’s own historical data: once headline CPI breaches 4%, average S&P 500 returns over the subsequent six months turn negative, a threshold that places the current macro environment within striking distance of the regime where rate-sensitive compression becomes the dominant market force.
The convergence is the structural story. Higher-for-longer rates compress multiples on long-duration growth assets at exactly the moment AI earnings face their own monetisation timing question. Two distinct risks, one macro and one sector-specific, now target the same set of crowded, long-duration, AI-proximate positions. That overlap is what makes the June 2026 survey readings unusually consequential.
The allocation shifts in the June survey read as a coherent institutional response to the crowding and macro risks identified above, not as a collection of unrelated trades.
| Asset / Sector | Prior Reading | June 2026 Reading | Direction |
|---|---|---|---|
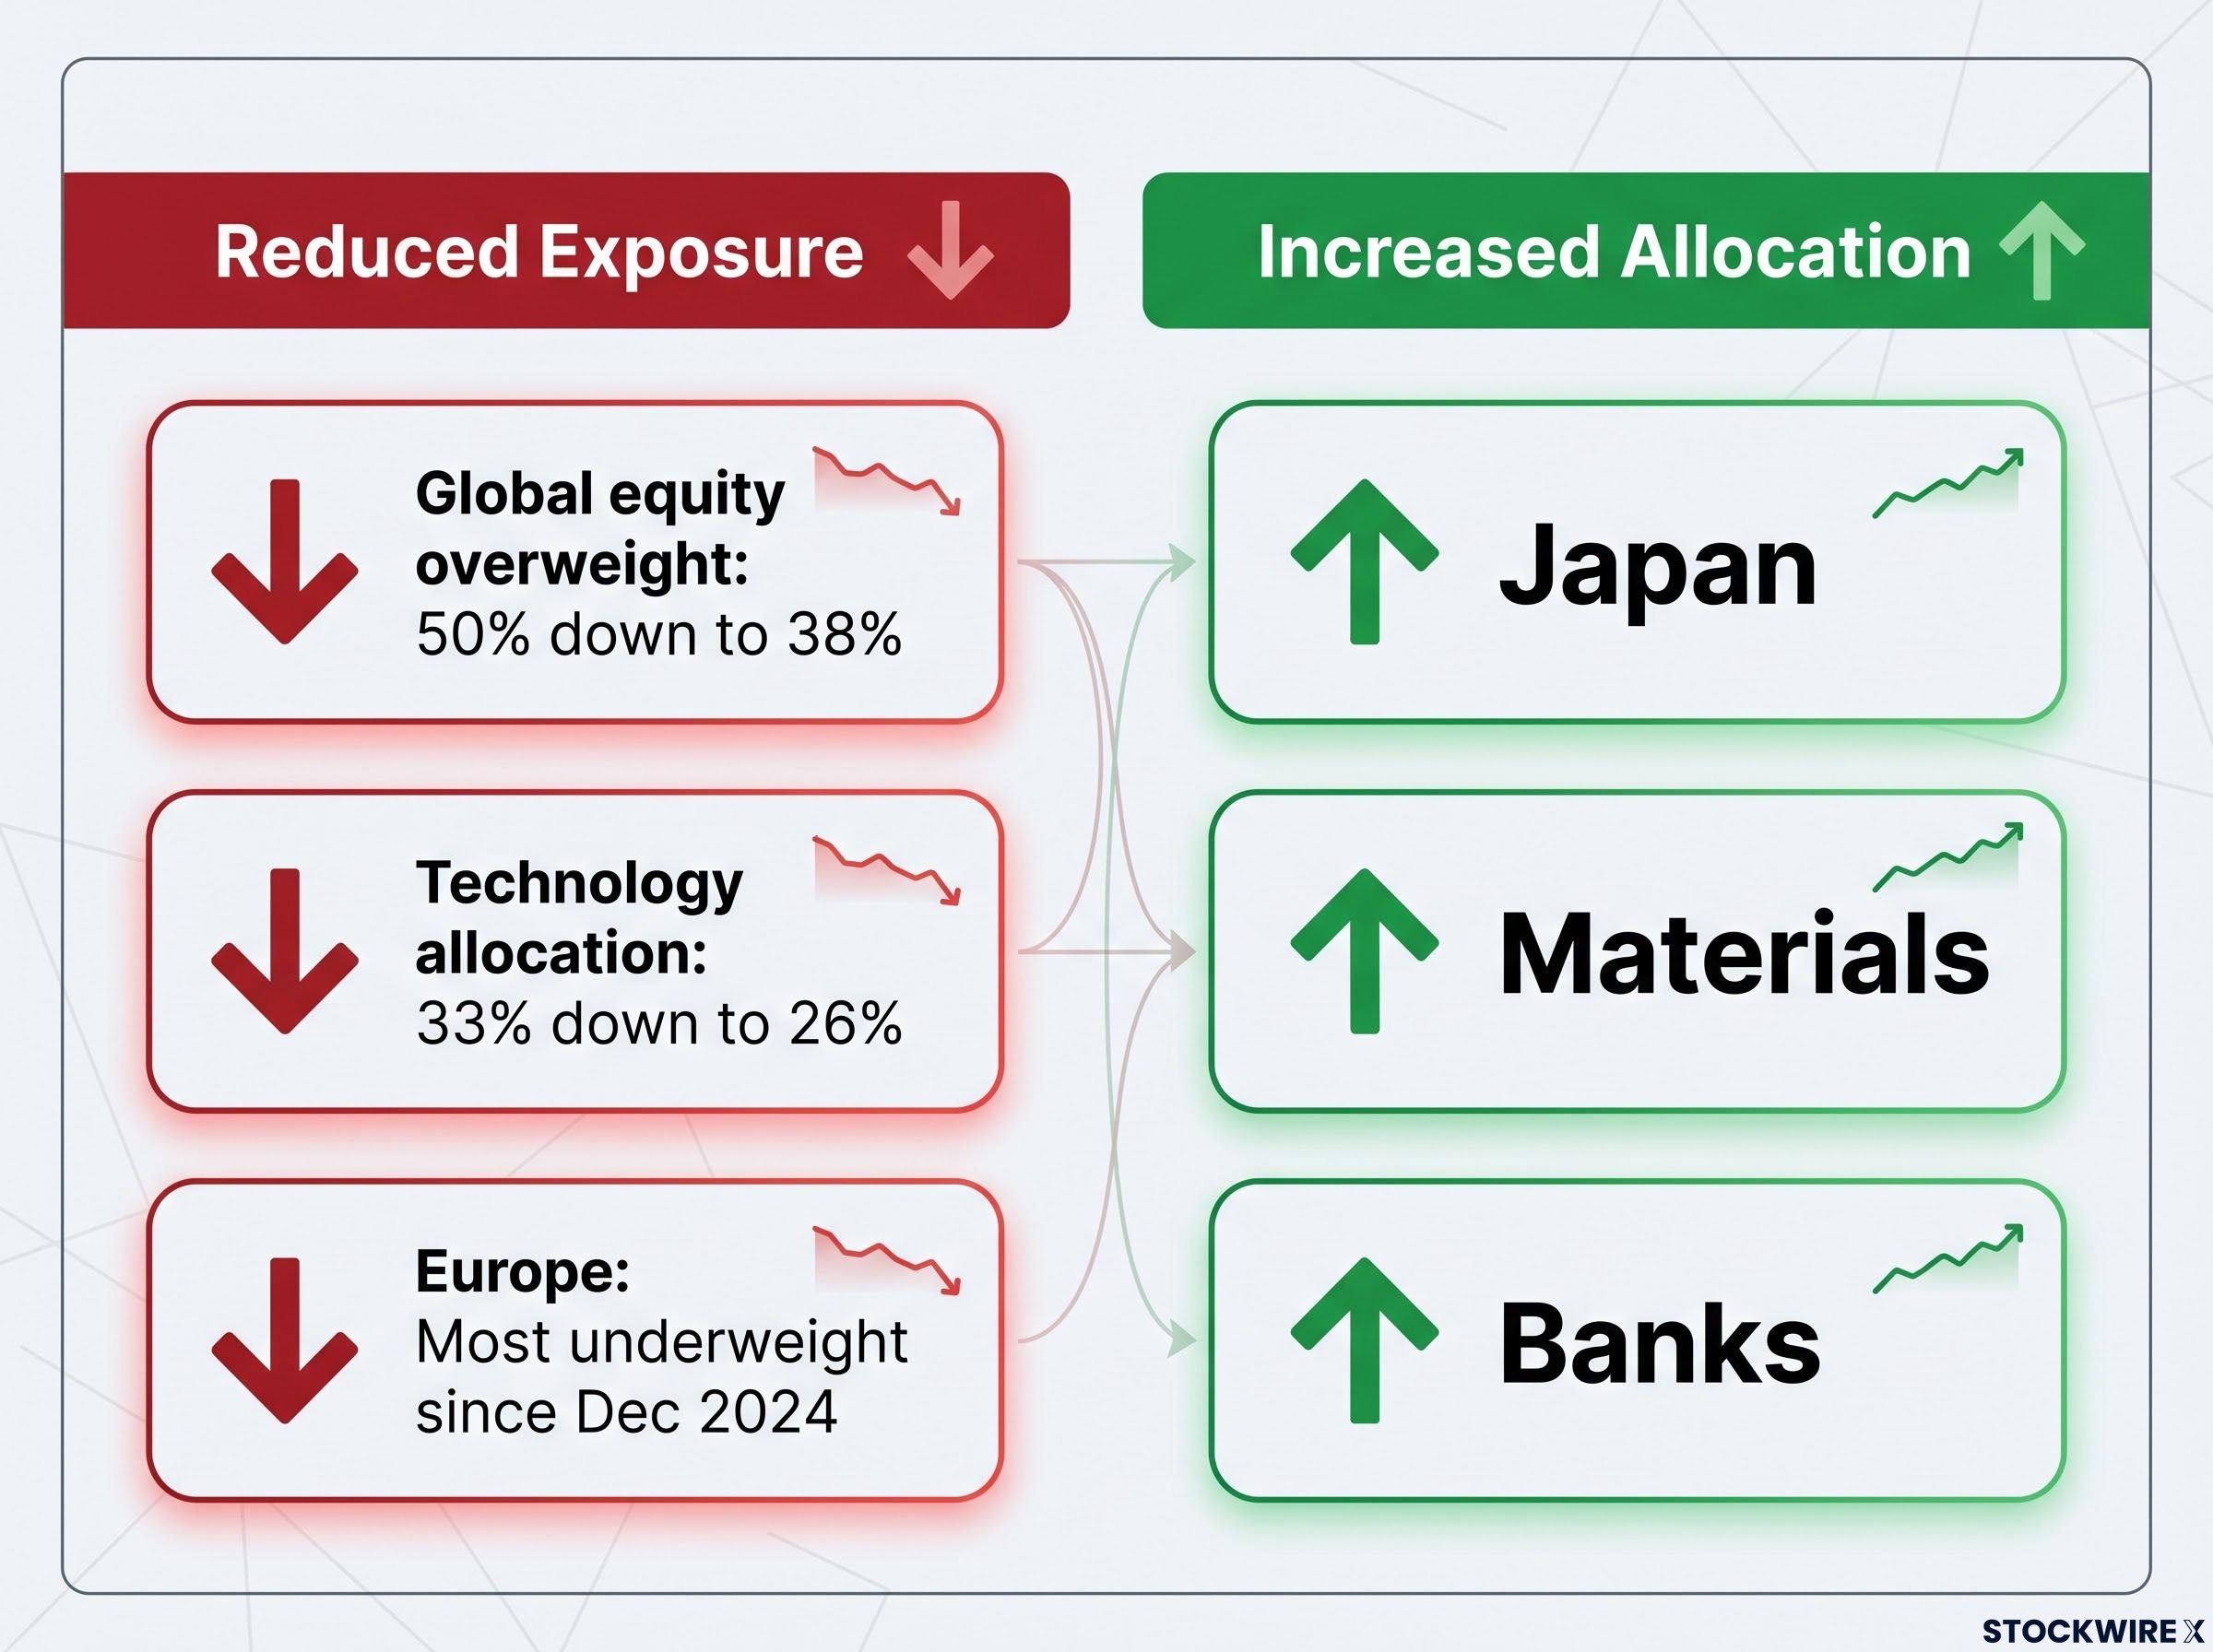
| Global equity overweight | 50% | 38% | Reduced |
| Technology allocation | 33% | 26% | Reduced |
| Europe | Underweight | Most underweight since Dec 2024 | Reduced further |
| Japan, materials, banks | Lower weight | Increased allocation | Rotation target |
The equity and technology cuts represent active de-risking at the margin rather than wholesale abandonment of the AI view. Fund managers are trimming position size from extreme levels while maintaining structural exposure. The rotation destinations each carry specific logic:
Gold, once cited alongside semiconductors as one of the most crowded trades, was assessed as fairly valued for the first time since February 2024. That transition, combined with Europe reaching its most underweight level since December 2024, marks a meaningful shift in where institutional capital sees residual risk versus already-priced opportunity.
The same consensus driving institutional repositioning has, by its own mechanics, created asymmetric opportunities in the areas being most aggressively sold. Bank of America identified three:
Each of these areas shares a common structural condition: they are simultaneously disliked, underowned, and priced for bad news. That combination creates the kind of asymmetric setup where even a modest improvement in the consensus outlook can drive meaningful outperformance, precisely because so few institutional holders need to reverse their positions to move prices.
The individual data points, taken together, draw a picture of a market that has priced AI perfection into its most concentrated positions at exactly the moment macro conditions are becoming less forgiving.
The escalation arc tells the story: semiconductor crowding moved from approximately 24-25% in April to 73% in May to 80% in June. Simultaneously, two tail risks, inflation at 34% and AI bubble concerns at 28%, converge onto those same positions. Fund managers responded by cutting global equity overweights from 50% to 38% and technology allocations from 33% to 26%.
The survey does not signal an end to the AI structural story. It signals that the easy phase of the trade, where conviction, positioning, and price all moved together, may be transitioning into a more complex phase where those forces diverge.
Strong individual earnings results at the company level may prove insufficient to prevent a positioning-driven correction if the macro regime shifts or if institutional holders reduce exposure simultaneously. Macro and positioning dynamics now carry as much weight as company-level fundamentals for the semiconductor trade.
The June 2026 survey captures a market at peak structural conviction and peak positioning risk simultaneously, a historically unusual and unstable configuration. The question is not whether AI remains a generational investment theme. The question is whether the positioning around that theme has outrun the market’s capacity to absorb adverse surprises.
Three near-term signals are most likely to resolve this tension: semiconductor earnings guidance revisions through the current reporting season, any unexpected stickiness in upcoming inflation data, and further institutional allocation shifts in the July 2026 survey. The AI thesis may still prove correct. The inflation scare may still subside. But the survey makes clear that professional investors are no longer treating either outcome as a certainty.
Investors wanting a more structured approach to assessing whether current valuations represent a genuine bubble or a sustainable structural re-rating will find our deep-dive into AI bubble analytical frameworks useful; it applies four independent lenses, including the Shiller CAPE ratio at 40.11, Minsky financing stage analysis, and behavioural sentiment indicators, to the same AI concentration question the survey’s 28% AI bubble tail risk reading raises.
This article is for informational purposes only and should not be considered financial advice. Investors should conduct their own research and consult with financial professionals before making investment decisions. Past performance does not guarantee future results. Financial projections are subject to market conditions and various risk factors.
A crowded trade occurs when a high proportion of institutional investors hold the same position simultaneously, which shrinks the marginal buyer pool and increases the risk of correlated selling during stress events, making the downside asymmetric even if the underlying thesis remains valid.
The June 2026 survey found that 80% of approximately 200 fund managers overseeing $517 billion in assets named long global semiconductors as the most crowded trade, the highest reading ever recorded in the survey's history since it began tracking crowding data in 2014.
Semiconductor crowding accelerated sharply over three months: roughly 24-25% of respondents named it the most crowded trade in April 2026, that figure jumped to approximately 73% in May, and then reached an all-time high of 80% in June 2026.
The article identifies three near-term signals: semiconductor earnings guidance revisions during the current reporting season, any unexpected stickiness in upcoming inflation data, and further institutional allocation shifts revealed in the July 2026 BofA Fund Manager Survey.
According to the June 2026 survey, fund managers increasing allocations to Japan (for governance reform tailwinds and attractive valuations), materials (for direct inflation linkage through commodity exposure), and banks (which benefit from higher net interest margins if rate cuts are delayed).