Why Sovereign Debt Is Reshaping the Long-Term Case for Gold
12 mins ago

Credit card delinquencies have hit their highest level in roughly 15 years. That is the headline, and it is accurate. The Federal Reserve Bank of New York’s Q1 2026 Household Debt and Credit report, released 12 May 2026, confirmed the figure, and it has since become the foundation for a wave of recession speculation across financial media. What has received considerably less attention: total US household net worth reached a record $184.1 trillion in Q4 2025, mortgage delinquency rates remain below levels observed at any point during the 2009-2020 expansion, and May 2026 payroll data marked the third consecutive month of job gains. The gap between the headline and the fuller dataset is wide enough to matter for anyone making allocation decisions around US consumer exposure. What follows is a dissection of what those competing signals actually mean for consumer financial durability, why aggregate US consumer debt statistics routinely mislead even sophisticated readers, and where the genuine pockets of stress are concentrated.
The New York Fed’s Q1 2026 report landed with a single data point that dominated coverage: serious credit card delinquencies had reached their highest level in approximately 15 years.
According to the Federal Reserve Bank of New York’s Q1 2026 Household Debt and Credit report, serious credit card delinquencies climbed to their highest level in roughly 15 years, with 4.8% of total outstanding debt in some stage of delinquency.
Financial media treated the figure as a standalone verdict. The framing was almost universally stripped of denominators, composition context, and historical baselines. Readers encountered the number without the surrounding architecture that would allow them to evaluate what it meant relative to total household liabilities.
Consumer sentiment readings have suffered from a related interpretive problem: record-low University of Michigan scores published in May 2026 generated recession headlines despite historical data showing sentiment deteriorates alongside or after equity market downturns rather than reliably leading them.
The number is real. The stress it captures is real. Credit card early delinquency transition rates stood at 8.6% in Q1 2026, ticking down marginally from 8.7% the prior quarter. Total credit card balances fell $25 billion to $1.25 trillion, a figure that itself received almost no coverage. The delinquency rate, however, is a lens, not a panorama. Used in isolation, it tells the reader something specific about one segment of the consumer credit stack. Used as a proxy for aggregate consumer health, it misleads.
The New York Fed Q1 2026 Household Debt and Credit report confirms that aggregate delinquency across all debt categories held at 4.8%, with credit card balances falling $25 billion to $1.25 trillion, details that went largely unreported in coverage focused exclusively on the card delinquency headline.
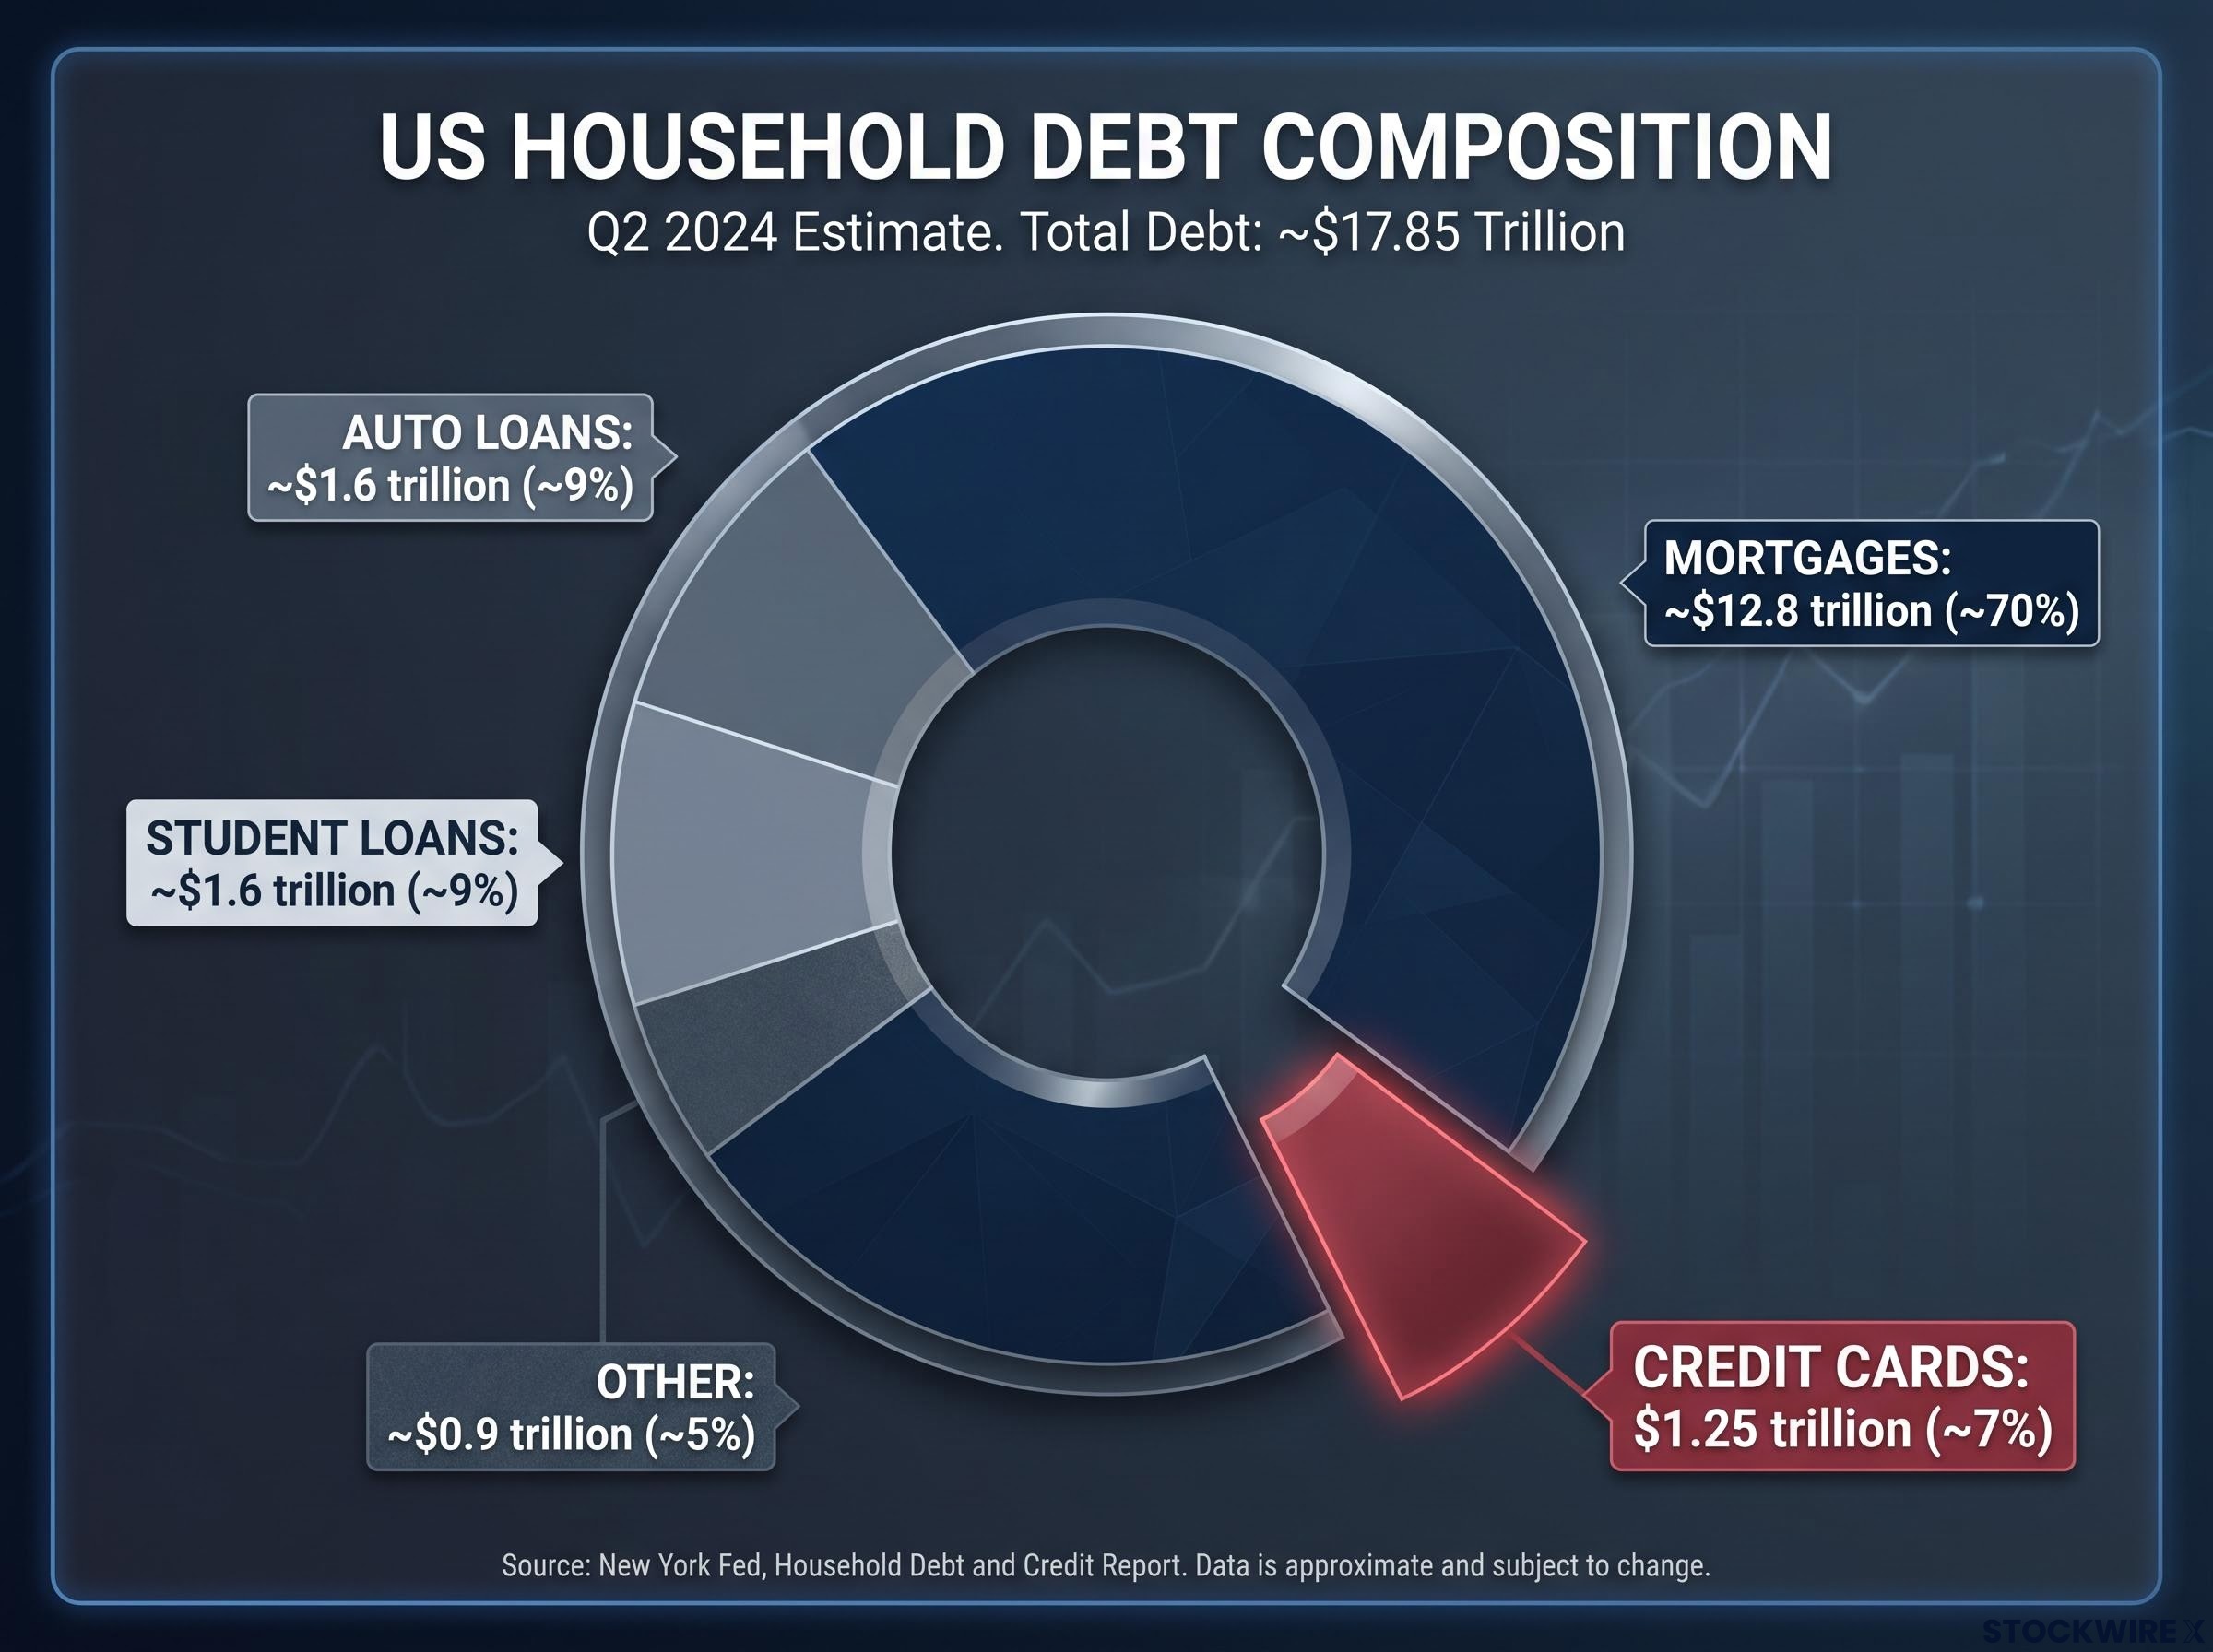
The proportional arithmetic is where the analytical discipline begins. Credit card debt represents approximately 7% of total US household debt. Mortgages represent approximately 70%. The remaining share is distributed across auto loans, student loans, and other consumer obligations.
That composition matters. A delinquency rate applied to 7% of the debt stack produces a materially different aggregate risk reading than the same rate applied to 70%. A 15-year high in card delinquencies is a legitimate signal of stress within a specific borrower cohort. It is not, by itself, evidence that aggregate consumer credit health is deteriorating.
| Debt Category | Approximate Balance | Share of Total Household Debt |
|---|---|---|
| Mortgages | ~$12.8 trillion | ~70% |
| Auto Loans | ~$1.6 trillion | ~9% |
| Student Loans | ~$1.6 trillion | ~9% |
| Credit Cards | $1.25 trillion | ~7% |
| Other | ~$0.9 trillion | ~5% |
Media reporting on consumer debt health frequently omits the asset side of the household balance sheet entirely, presenting liabilities without the offsetting context. For readers evaluating consumer-sector equities, credit ETFs, or broader macro positioning, understanding which debt categories carry systemic weight and which are high-signal-for-a-subset is where accurate risk assessment begins.
The liability column of the consumer balance sheet has dominated coverage. The asset column tells a different story.
According to the Federal Reserve’s Financial Accounts of the United States (Z.1) report for Q4 2025, released 19 March 2026, US household net worth reached $184.1 trillion, a nominal record high.
That figure does not eliminate the stress reflected in card delinquency data. It does, however, establish that aggregate consumer balance sheets are structurally sound at the macro level. The record was driven by rising equity holdings and housing values, and it should be read with a distributional caveat: aggregate net worth figures are heavily skewed toward wealthier households, meaning the macro-level picture does not erase real hardship experienced at lower income levels.
Household wealth distribution is what converts the $184.1 trillion net worth figure from a reassuring aggregate into a more nuanced structural picture: Federal Reserve data indicates the top 10% captured roughly 88% of total wealth growth over 2020-2024, meaning the macro-level record does not cancel out balance sheet fragility lower in the income stack.
The New York Fed’s Q1 2026 data reinforced the broader picture. Aggregate delinquency across all debt categories held at 4.8%, with little change quarter-over-quarter. The system-level reading was stability, not acceleration.
If mortgages account for roughly 70% of total household debt, then mortgage delinquency rates carry more systemic weight than any other single consumer credit metric.
The Mortgage Bankers Association (MBA) reported an overall mortgage delinquency rate of 4.44% in Q1 2026. The FRED series on commercial bank single-family mortgage delinquencies recorded a rate of just 1.89% in the same quarter. Both figures remain below levels observed throughout the 2009-2020 economic expansion, a period during which the US economy was officially in recovery and expansion.
The largest component of household liabilities is performing better than at virtually any point in the post-GFC era. That is the data point that matters most for assessing whether the consumer credit system is under systemic strain, and it has been largely absent from the recession-call coverage.
If the “normalisation” framing were limited to a single institution or a single earnings call, it could be dismissed as corporate spin. It is not. Across Q1 2026 earnings commentary, the characterisation converged across institutions with meaningfully different borrower-risk profiles.
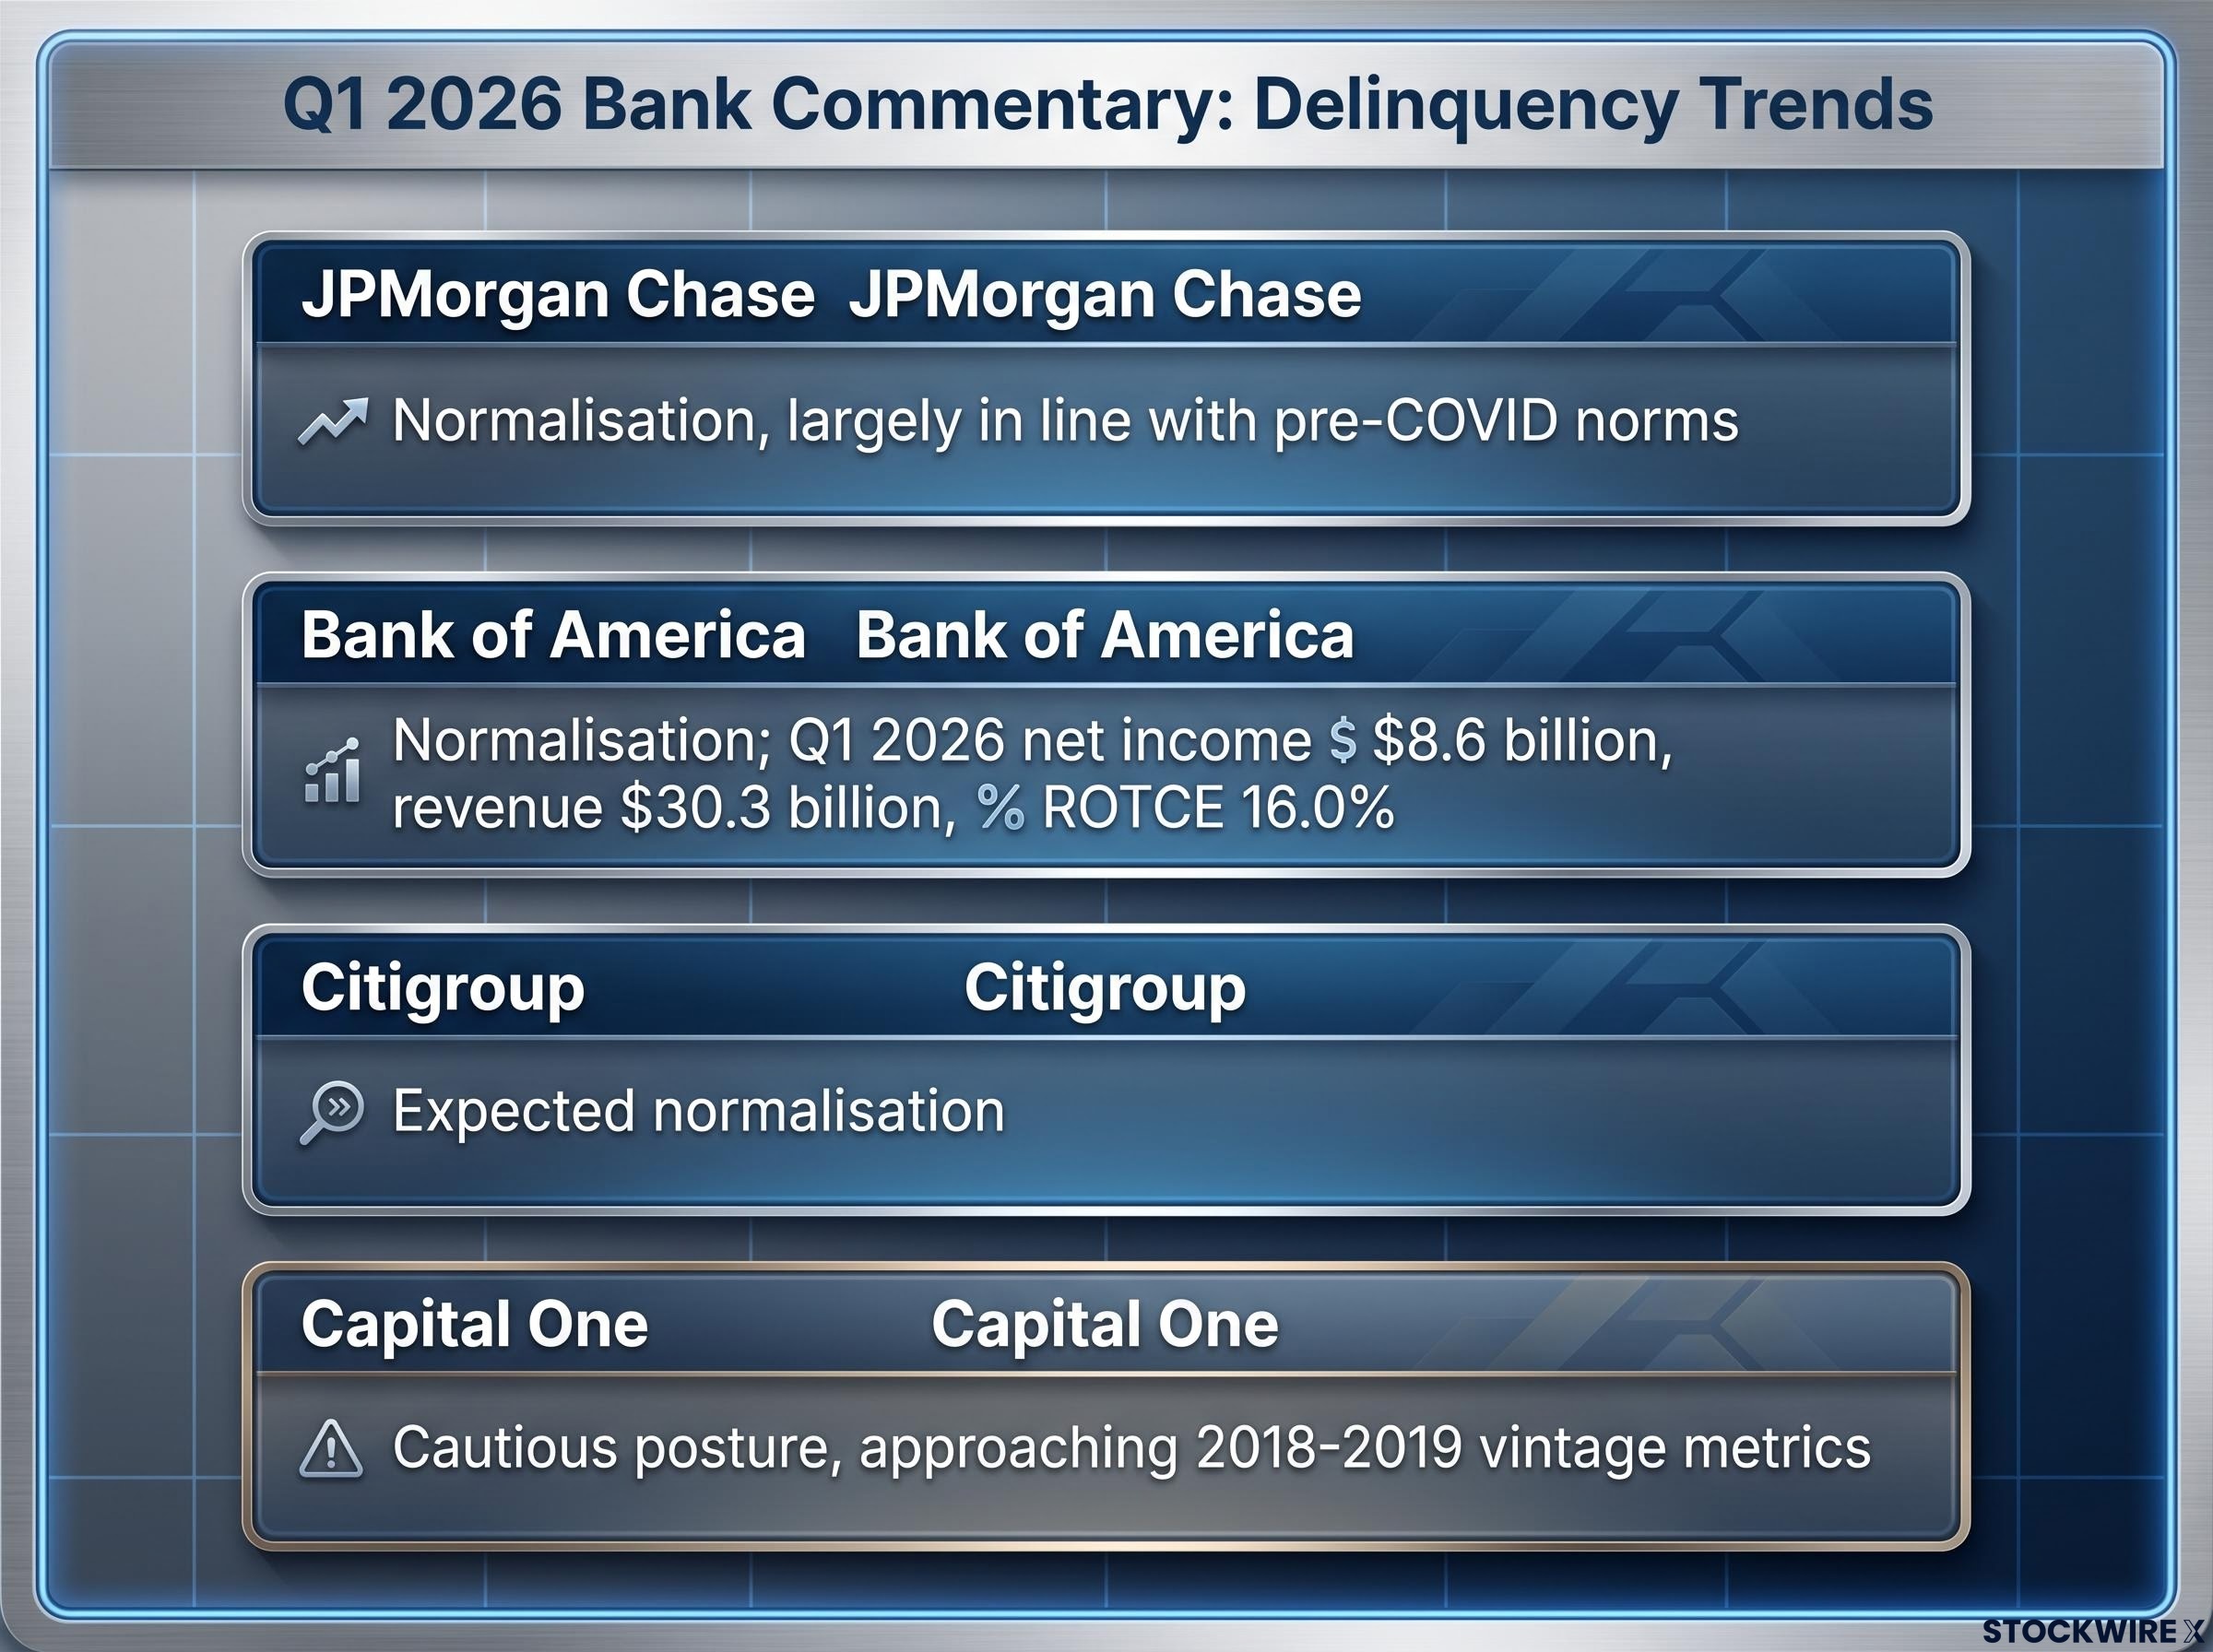
The New York Fed itself framed the trend as delinquencies “returning toward pre-pandemic norms” after being “unusually depressed” by stimulus and forbearance. The pandemic-era baseline is where interpretation hinges. Stimulus payments, forbearance programmes, and excess savings produced an artificially depressed delinquency environment in 2021-2022. Any return toward historical norms from that trough appears as a dramatic spike on a chart, even when the destination level is unremarkable by pre-pandemic standards.
Nathan Peterson of Charles Schwab, writing in April 2026, characterised rising delinquencies as “not yet indicative of broad-based credit stress,” consistent with “a normal credit cycle re-emerging.” The distinction between normalisation and systemic deterioration carries direct implications for how to interpret bank provisioning levels, charge-off guidance, and consumer-lending sector valuations.
The aggregate story does not apply uniformly. The New York Fed’s Q1 2026 commentary identified a specific cohort driving the headline delinquency figures: younger, lower-income, and lower-credit-score borrowers. This is the group experiencing the fastest deterioration, and their stress is genuine.
Capital One’s more cautious posture reflects this concentration. Greater subprime exposure means the normalisation framework applies less cleanly to its portfolio. The borrowers under pressure are not the same borrowers holding record equity wealth or benefiting from locked-in low mortgage rates.
Savings depletion among lower-income households is the mechanism linking concentrated card stress to broader consumption risk: a borrower cohort running a personal savings rate near 4% has limited buffer to absorb income disruption before revolving credit becomes the primary spending source.
The current macroeconomic environment, however, provides a buffer that has kept concentrated stress from becoming systemic contagion. Key May 2026 labour market data from the Bureau of Labor Statistics (released 5 June 2026):
Employment is a lagging indicator. Equity markets had already priced in labour market improvement for several months prior to this report. The data provides useful but backward-looking reassurance.
The “no systemic crisis” conclusion carries an explicit condition: it holds in the current employment environment. If unemployment were to rise meaningfully, the lower-income, subprime cohort already under pressure would see its delinquency trajectory accelerate. These are borrowers with limited savings buffers and higher sensitivity to income disruption. The labour market is the variable that determines whether concentrated card stress remains a sector-level headwind or converts into something with broader macro relevance. No forecast is warranted here, but the conditionality should be clear to any reader using this analysis for positioning decisions.
Two descriptions of the US consumer are simultaneously accurate, and the failure to hold both in view is what produces the analytical errors on either side.
Real and concentrated stress exists among lower-income and subprime credit card borrowers. Delinquencies in this cohort have reached levels not seen in 15 years, and Capital One’s more cautious posture reflects that pressure. At the same time, the aggregate consumer balance sheet remains structurally sound: record household net worth of $184.1 trillion, mortgage delinquency rates below the entire 2009-2020 expansion, 4.3% unemployment, and 172,000 payrolls added in the most recent month. Credit card balances fell $25 billion in Q1 2026, suggesting some consumer deleveraging at the margin.
| Stress Indicators | Balance Sheet Strengths |
|---|---|
| Card delinquencies at ~15-year high (NY Fed Q1 2026) | Household net worth: $184.1 trillion record (Fed Z.1, Q4 2025) |
| Younger, lower-income borrowers deteriorating fastest | MBA mortgage delinquency: 4.44%, below 2009-2020 norms |
| Capital One reports subprime pressure increasing | Unemployment: 4.3%, three consecutive months of job gains |
| Card delinquency transition rate: 8.6% | Card balances fell $25 billion in Q1 2026 |
The single most important forward variable is the labour market. If employment holds, the current delinquency trajectory is likely to remain a sector-level headwind rather than a systemic catalyst. If it does not, the calculus changes, and the borrower cohort already under pressure becomes the transmission mechanism.
A 15-year high in a debt category that represents 7% of total household liabilities is a legitimate signal. It is not, on its own, a sufficient basis for a recession call or a broad consumer crisis thesis. Readers who separate the signal from the noise are better positioned to assess consumer-sector risk accurately and avoid reactive repositioning based on an incomplete read of the data.
For investors translating this consumer credit analysis into portfolio positioning, our comprehensive walkthrough of cyclical and defensive allocation covers how institutional allocators are currently using barbell approaches that maintain exposure to consumer cyclicals while building defensive ballast, with sector-weighting frameworks calibrated to the mixed signals that characterise the current environment.
This article is for informational purposes only and should not be considered financial advice. Investors should conduct their own research and consult with financial professionals before making investment decisions. Past performance does not guarantee future results.
According to the Federal Reserve Bank of New York's Q1 2026 Household Debt and Credit report, aggregate delinquency across all US household debt categories held at 4.8%, with credit card serious delinquencies reaching their highest level in roughly 15 years.
Credit card debt represents only about 7% of total US household debt, compared to mortgages which account for roughly 70%, so a delinquency spike in card balances reflects stress in a specific borrower cohort rather than a system-wide deterioration of consumer credit health.
The Federal Reserve Bank of New York identified younger, lower-income, and lower-credit-score borrowers as the cohort experiencing the fastest deterioration, with Capital One noting more pronounced pressure among subprime and lower-income customers.
The Federal Reserve's Q4 2025 Financial Accounts report recorded US household net worth at a nominal record of $184.1 trillion, though this aggregate figure is heavily skewed toward wealthier households and does not eliminate real stress at lower income levels.
May 2026 payroll data showed 172,000 nonfarm jobs added and unemployment steady at 4.3%, the third consecutive month of gains; analysts note that if unemployment rises meaningfully, the lower-income subprime cohort already under pressure would be the primary transmission mechanism for broader credit deterioration.