
How to Spot a Dividend Trap Before It Costs You
12 hrs ago

Over the last century, a globally diversified equity portfolio has returned roughly twice what bonds have delivered in nominal terms. That single fact has shaped retirement plans, institutional mandates, and the default advice given to anyone with a multi-decade horizon. Yet since 2022, billions of dollars have rotated back into fixed income as real yields turned genuinely positive for the first time in a decade, reopening a debate that seemed settled during the low-rate era.
The stocks vs bonds question remains one of the most consequential allocation decisions a long-term investor faces. 2024-2025 market conditions, persistent elevated yields, disinflation from the 2022-2023 peaks, and AI-driven equity valuations, have added genuine complexity to what was once a straightforward answer. What follows is an evidence-based examination of the historical return data, the equity risk premium, the role of investment horizon, and how recent conditions actually shift (or fail to shift) the long-run calculus.
The return gap between equities and bonds is not a matter of interpretation. It is a compounding fact documented across decades, geographies, and market cycles.
According to BlackRock’s 2025 Long-Term Capital Market Assumptions (November 2024) and Fidelity’s 2025 Long-Term Capital Market Update (October 2024), global equities have delivered approximately 7-8% nominal annualised over multi-decade horizons. Global investment-grade bonds have delivered approximately 3-4% nominal over the same periods.
The US-specific record is even more pronounced. Vanguard’s Economic and Market Outlook for 2025 (December 2024), citing Global Chief Economist Joe Davis, places US equities at approximately 10% nominal per year over the last century, with US bonds at approximately 5-6%.
Stocks have outpaced bonds by approximately 3-4 percentage points per year over the last century, according to Vanguard’s research.
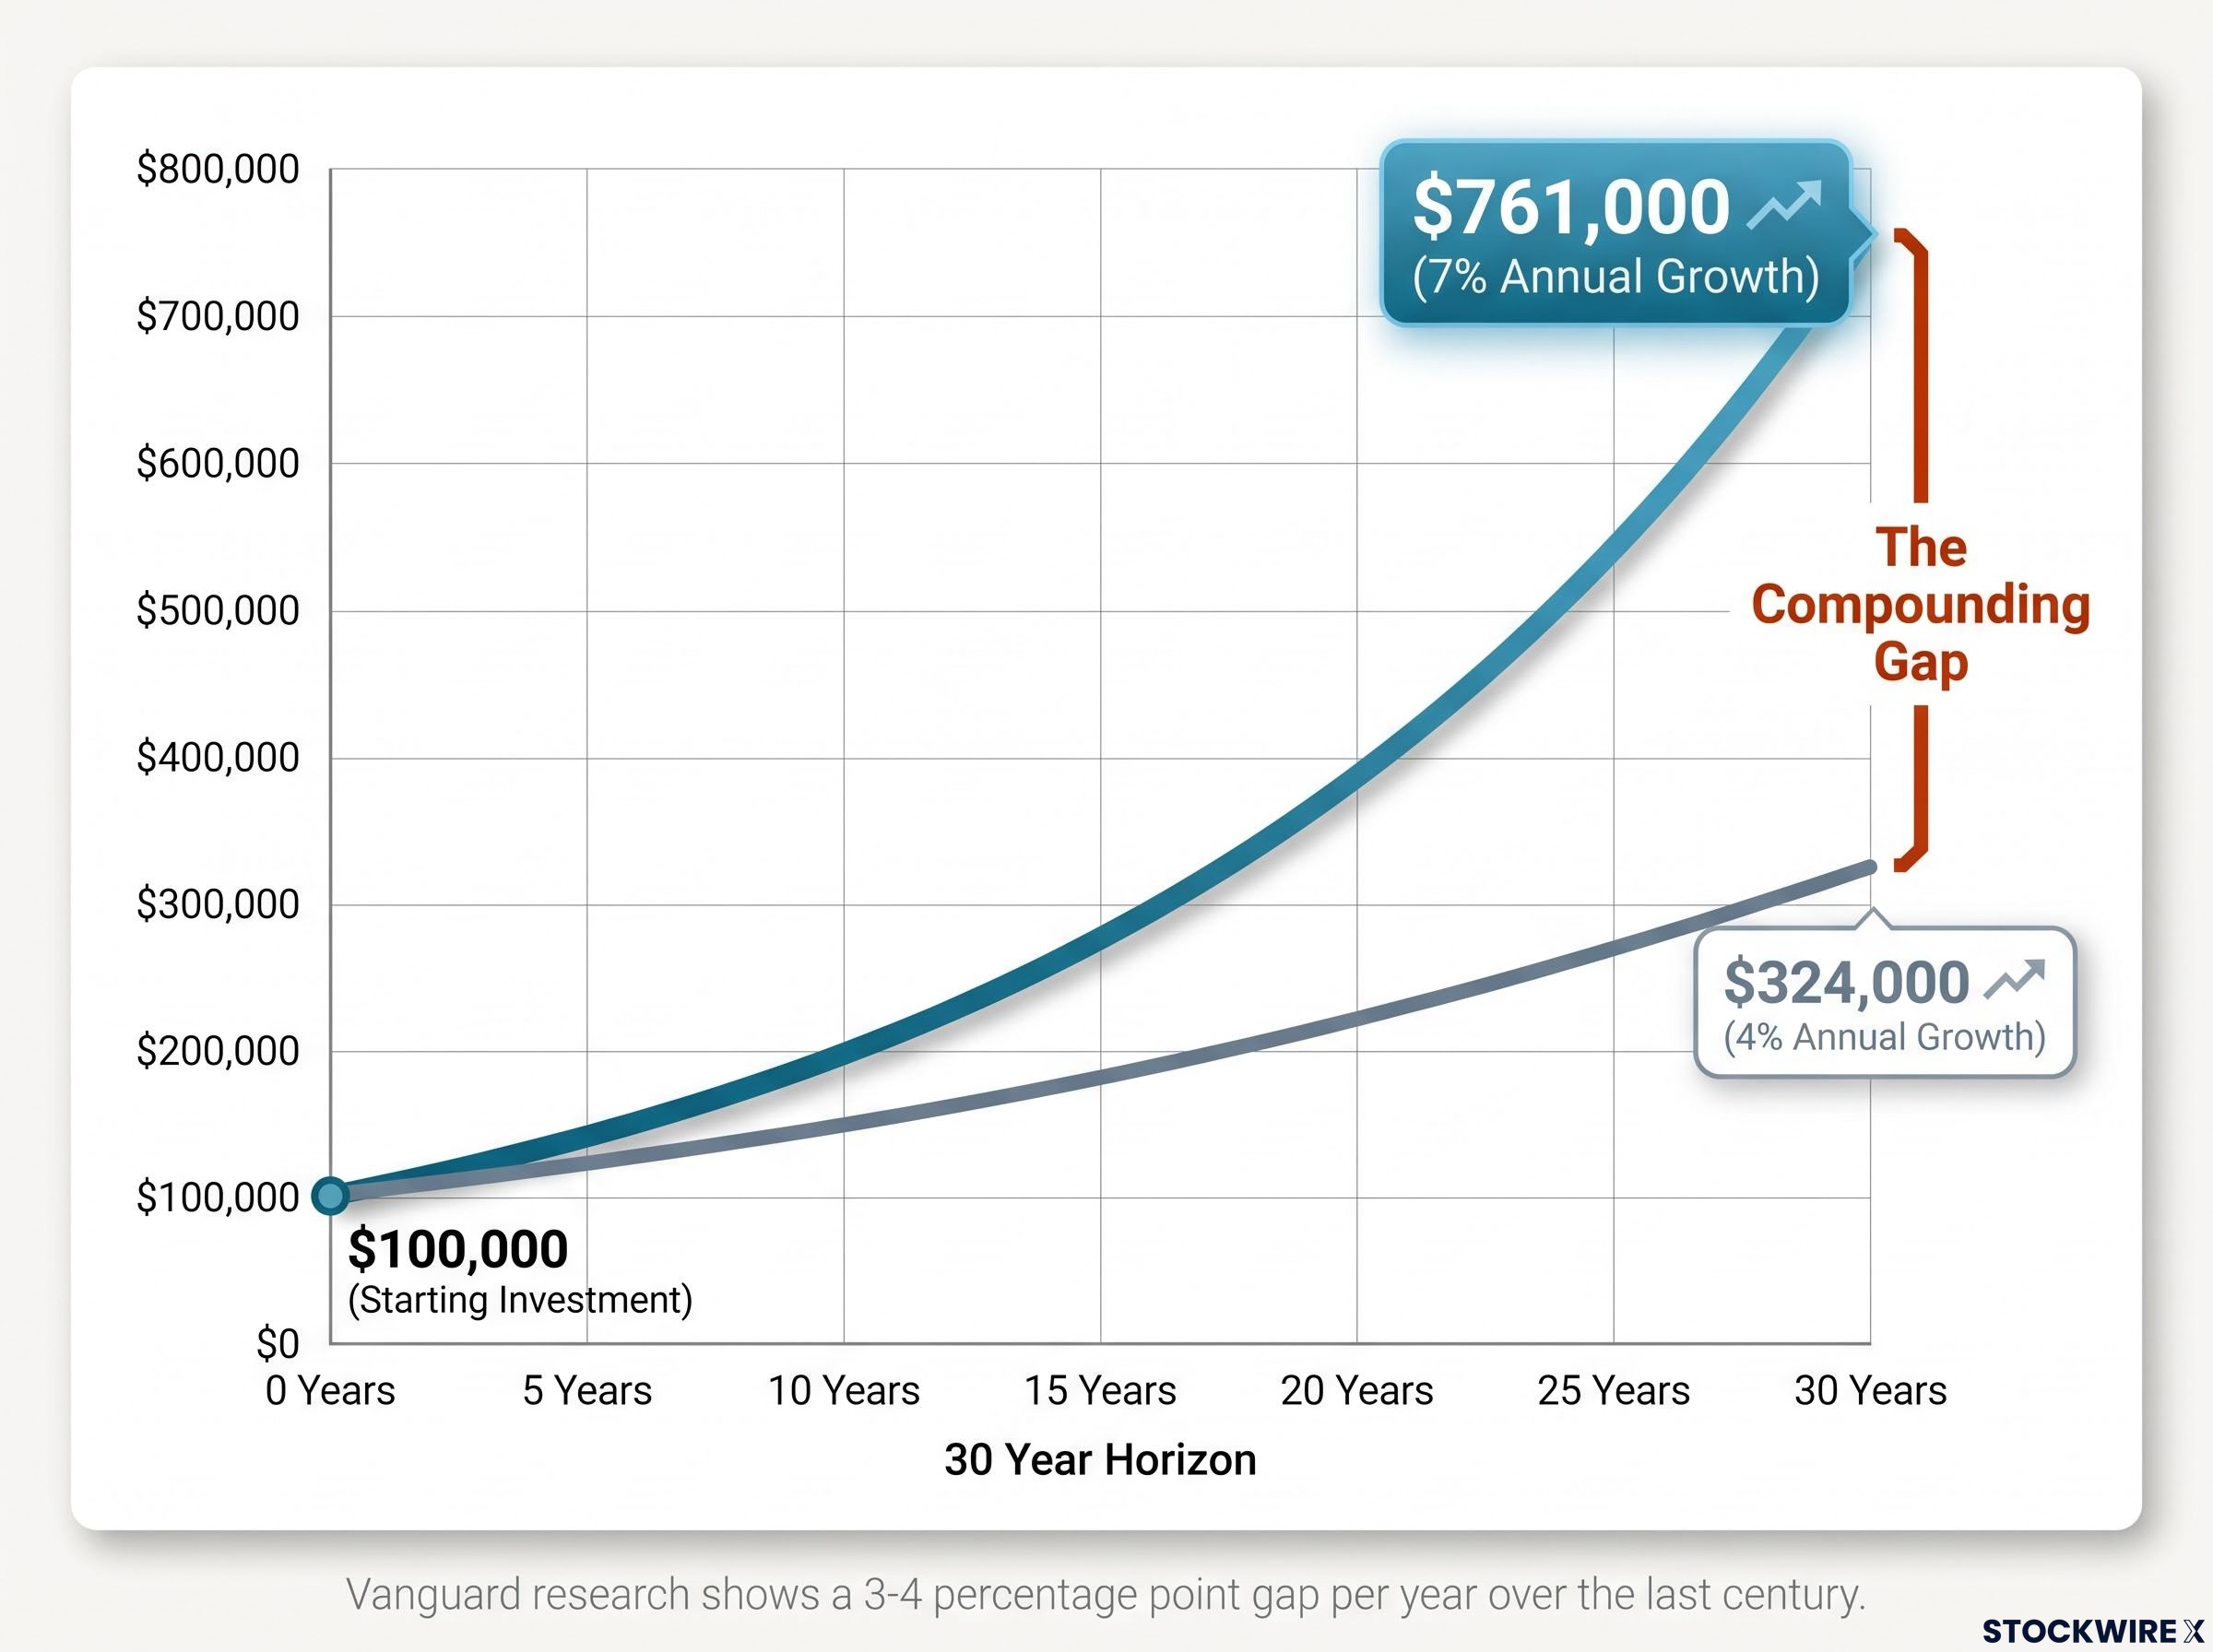
A 3-4 percentage point annual gap may sound modest in a single year. Compounded over 30 years, however, it produces a dramatically different terminal wealth outcome. A $100,000 portfolio growing at 7% annually reaches approximately $761,000 over three decades; the same amount at 4% reaches roughly $324,000.
The UBS/Credit Suisse Global Investment Returns Yearbook 2024, using data for 35 countries since 1900, confirms the pattern holds globally, even through the tech bust, the Global Financial Crisis, and COVID.
| Asset Class | Nominal Annualised Return | Real Annualised Return | Source / Horizon |
|---|---|---|---|
| Global Equities | ~7-8% | ~4-5% | BlackRock / Fidelity (multi-decade) |
| Global Bonds | ~3-4% | ~1-2% | BlackRock / Fidelity (multi-decade) |
| US Equities | ~10% | ~6.5-7% | Vanguard (100-year) |
| US Bonds | ~5-6% | ~2-3% | Vanguard (100-year) |
Different indices and start dates produce minor variations across sources. The direction of the gap, however, has not been in dispute in any authoritative 2024-2025 publication.
The equity risk premium (ERP) is the additional return investors demand for bearing the higher volatility and drawdown risk that equities carry relative to bonds. It is not a gift. It is compensation, and it comes at a price paid in sleepless nights during bear markets.
The distinction matters. If the return advantage were free, it would not persist; every investor would hold equities exclusively, and the premium would be bid away. It endures precisely because equities are uncomfortable to hold through 30-40% drawdowns, and many investors sell at the worst possible moment.
Current academic estimates put the premium in concrete terms:
The arithmetic-versus-geometric gap is worth noting briefly. Arithmetic averages treat each year independently and run higher; geometric averages reflect actual compounding experience and are the more conservative, investor-relevant figure.
Damodaran’s 4.6% implied ERP for the US, derived from forward-looking earnings and current Treasury yields, sits above the long-run geometric average. That suggests the market is still pricing in a meaningful equity advantage even at today’s elevated valuations.
BlackRock’s forward-looking assumptions are more modest at 2.5-3%, partly reflecting the possibility that stretched US mega-cap valuations may compress future returns. Global diversification, where valuations are more moderate, may preserve more of the historical premium than a US-only allocation.
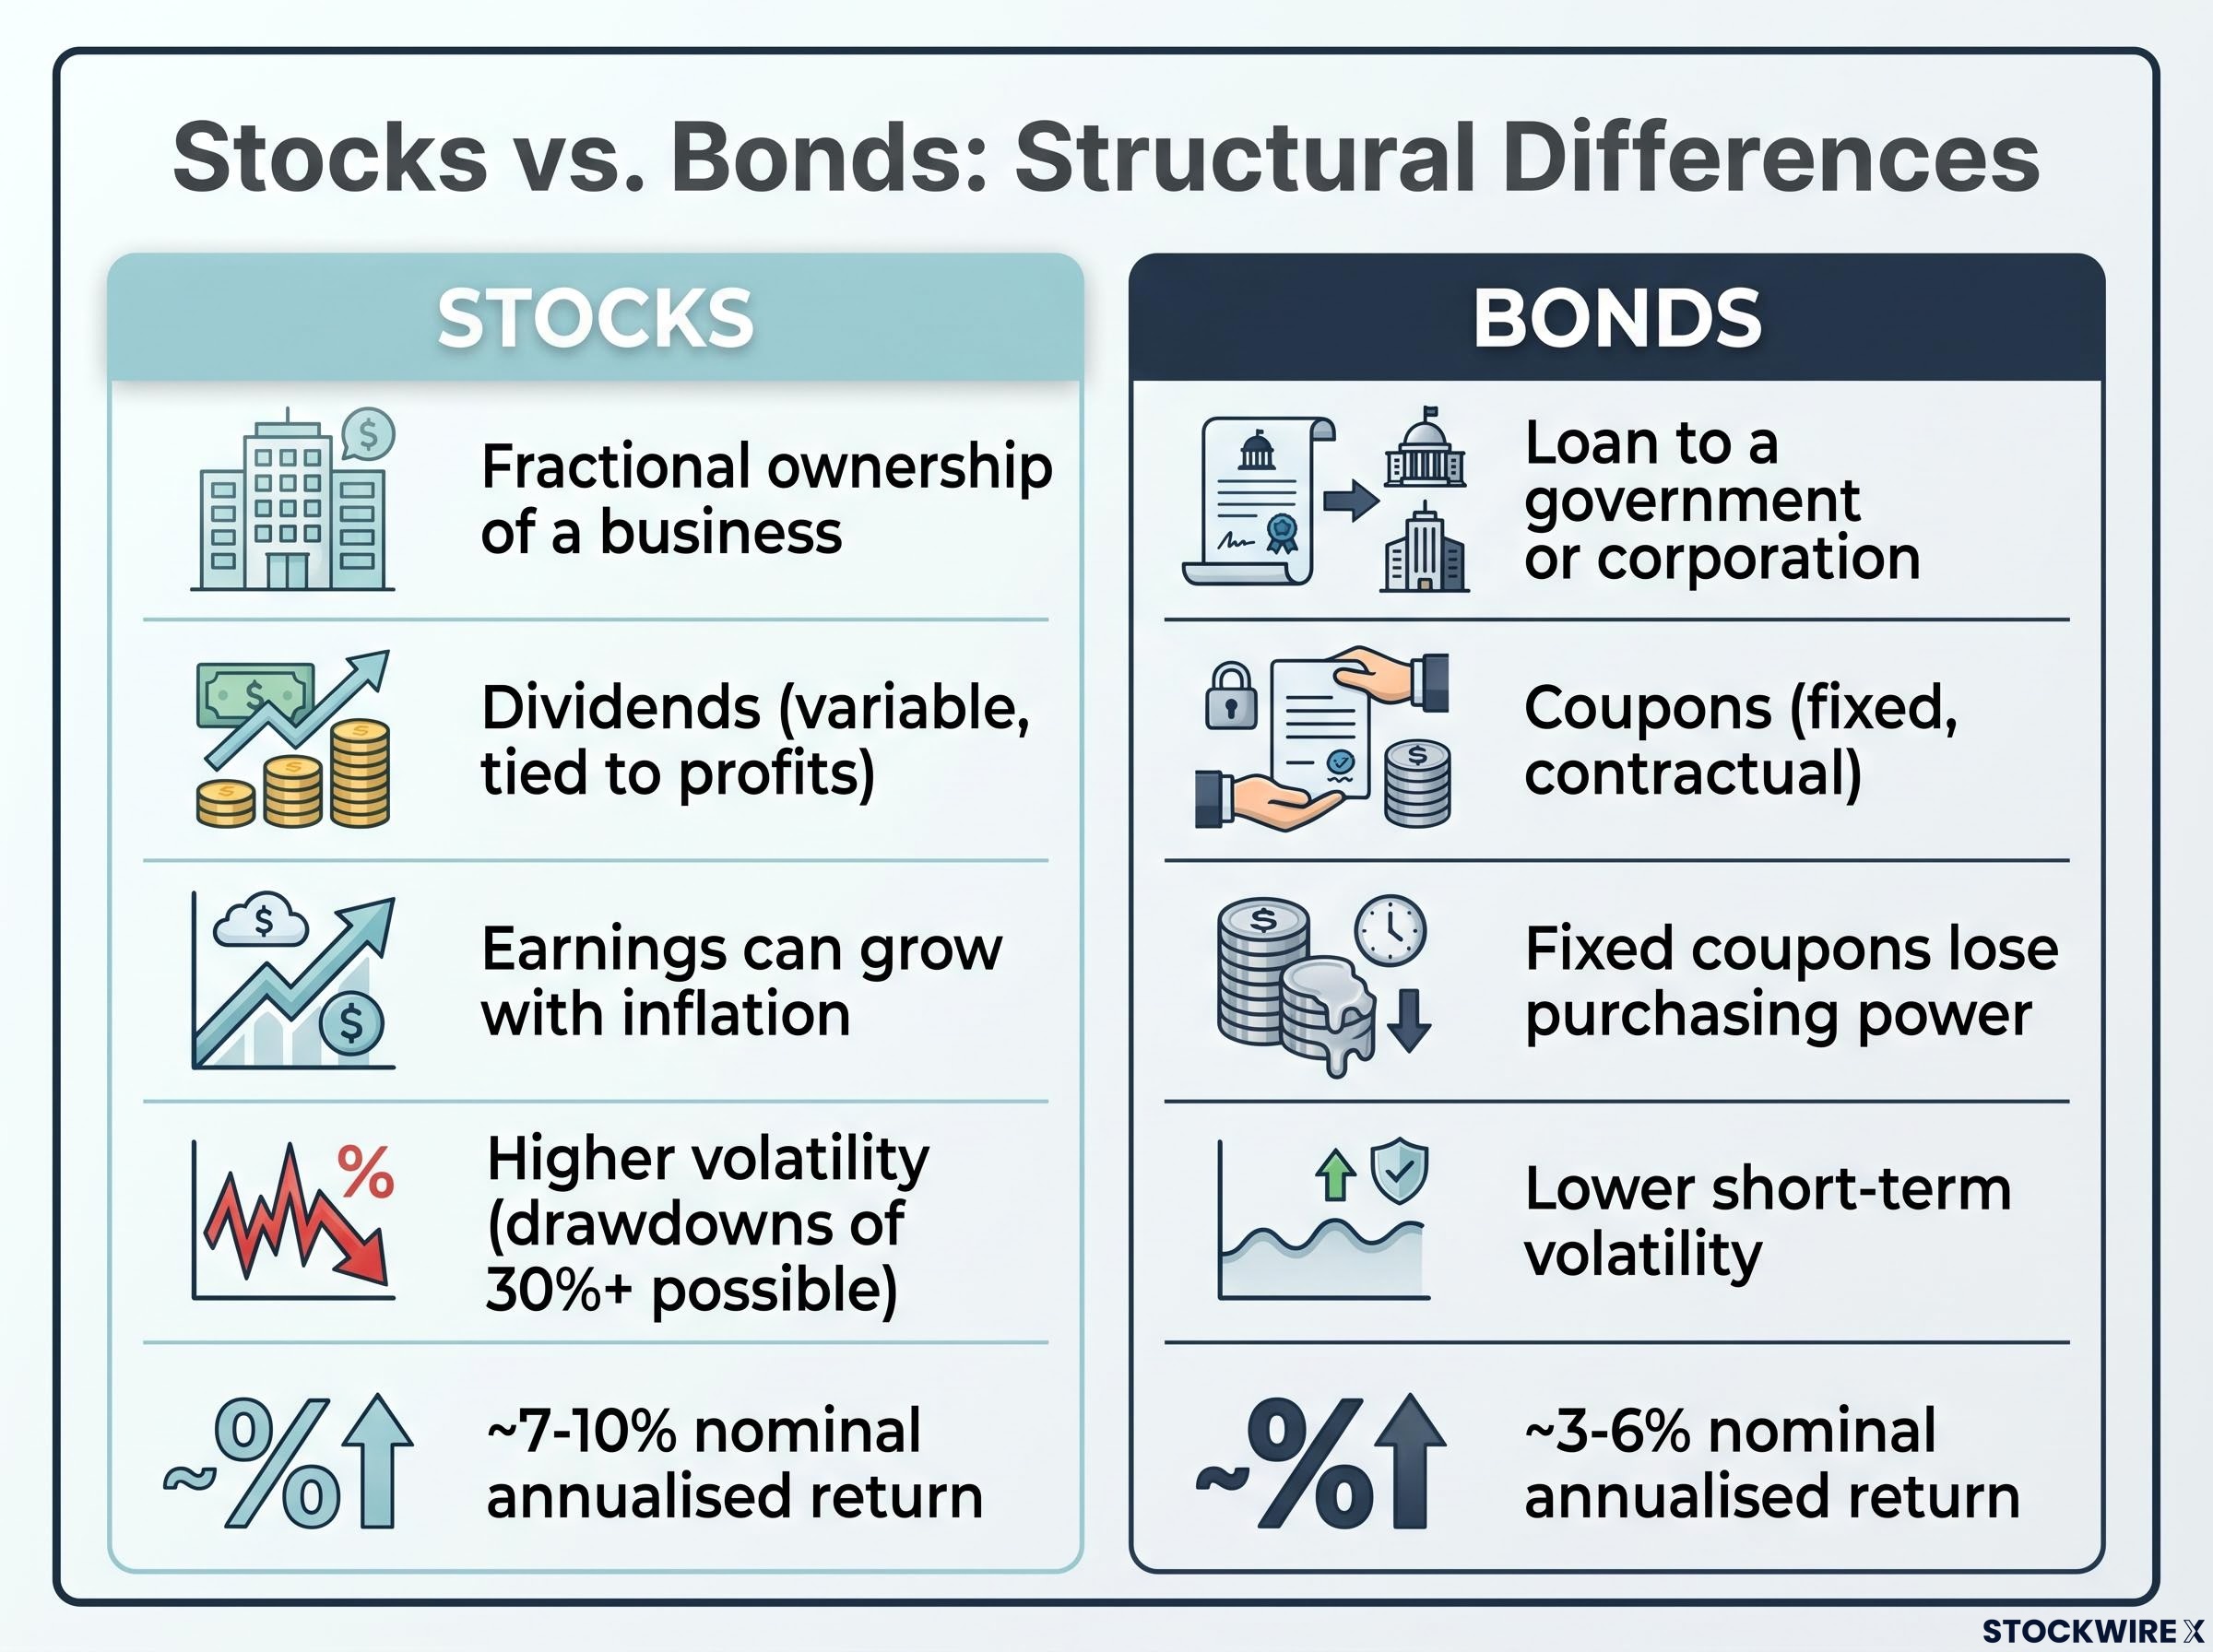
A stock represents fractional ownership of a business. The holder has a claim on future earnings and growth, which means returns are tied to how well the company performs and how the broader economy expands. There is no guaranteed payout, but there is no ceiling either.
A bond is a loan. The investor lends money to a government or corporation and receives a fixed schedule of interest payments plus the return of principal at maturity. The income is predictable, but it does not grow with the economy.
This structural difference explains the return profiles. Equity earnings can compound alongside economic growth and inflation; bond coupons are fixed in nominal terms and lose purchasing power as prices rise. Over extended periods, nominal government bonds have historically delivered low or sometimes negative real returns, a vulnerability that becomes pronounced across multi-decade horizons.
The shift from the 2010s “TINA era” (There Is No Alternative to equities), when 10-year US Treasury yields languished below 2%, to the current environment, where yields have hovered around 4-4.5% through late 2024, has materially changed the income picture for bonds. As Morningstar’s Christine Benz noted in March 2024, bonds are “finally offering a real return again.” That improvement, however, does not alter the structural growth advantage equities hold over the long run.
| Dimension | Stocks | Bonds |
|---|---|---|
| Ownership Structure | Fractional ownership of a business | Loan to a government or corporation |
| Income Type | Dividends (variable, tied to profits) | Coupons (fixed, contractual) |
| Inflation Sensitivity | Earnings can grow with inflation | Fixed coupons lose purchasing power |
| Short-Term Volatility | Higher (drawdowns of 30%+ possible) | Lower (smaller price swings in most conditions) |
| Long-Run Return Expectation | ~7-10% nominal annualised | ~3-6% nominal annualised |
The equity return advantage is not a constant benefit. It is a time-dependent one. Over 20-year rolling periods, the probability of equities outperforming bonds in real terms is historically overwhelming. Over 2-year periods, the outcome is far less certain.
According to J.P. Morgan’s David Kelly (January 2025), over 20-year rolling periods, US equities have not lost money in real terms, whereas bonds have had several long stretches of low or negative real returns.
That finding reframes the debate. For investors with decades ahead, the short-term volatility of equities is not a risk to long-run wealth; it is the admission price for a structurally higher return. For investors drawing down a portfolio in retirement, however, the calculus shifts dramatically.
Sequence-of-returns risk is the reason. A 30% equity drawdown in the first two years of retirement, combined with ongoing withdrawals, can permanently impair a portfolio’s ability to sustain spending. The same drawdown in year 15 of a 30-year retirement does far less damage. This makes the timing of returns, not just the average, the decisive variable for retirees.
Three investor profiles illustrate how horizon should drive allocation:
Something genuinely changed after 2022. US CPI inflation fell from over 8% to approximately 3% by late 2024, according to Bureau of Labor Statistics data. Meanwhile, 10-year US Treasury yields settled around 4-4.5%, meaningfully above the sub-2% levels that defined the 2010-2021 decade.
The combination of lower inflation and higher nominal yields produced something bonds had not offered in years: positive real yields. That shift prompted a rational reallocation.
According to J.P. Morgan’s 2024 Institutional Investor Survey (October 2024), institutional investors have been increasing target allocations to fixed income after years of underweighting during the low-yield era. Equities remain a core holding, but many institutions reported modestly trimming equity targets in favour of bonds and private markets.
BlackRock’s Wei Li put the shift in context during a June 2024 outlook: higher yields “restore income to fixed income” and make bonds more competitive for income-oriented investors. For long-horizon investors, however, “equities remain the core growth engine.”
Higher real yields improve the risk-adjusted case for holding bonds in a diversified portfolio. Income-seeking and drawdown-sensitive investors benefit the most. Both BlackRock and Vanguard continue to recommend diversified stock-bond portfolios rather than single-asset concentration, a position that the return of real yields strengthens rather than changes.
The conclusion is specific: bonds are more attractive today than at any point since before the Global Financial Crisis. That does not mean bonds will outperform equities over the next 20 years. It means the cost of holding bonds for stability and income has fallen significantly.
The evidence assembled across a century of data, multiple academic studies, and the 2024-2025 institutional consensus points to a clear hierarchy. Equities deliver superior long-run returns. Bonds deliver stability and income. The right mix is a function of when the money is needed, not a universal answer.
Three principles emerge from the research:
The UBS/Credit Suisse Global Investment Returns Yearbook 2024 confirms that across 35 countries since 1900, equities have significantly outperformed bonds, even through the tech bust, the Global Financial Crisis, and COVID.
No authoritative 2024-2025 source recommends an all-stocks or all-bonds portfolio for any investor profile. As Vanguard’s Joe Davis stated in December 2024, equities remain the primary driver of long-term portfolio growth, while bonds are primarily for diversification and income. The debate is about weight, not exclusivity.
Over long horizons and across global markets, equities have consistently outperformed bonds. The 2024-2025 research consensus, from Damodaran’s equity risk premium calculations to the UBS Yearbook’s century-spanning dataset, confirms that advantage remains intact.
What has changed is the quality of the alternative. Higher yields have meaningfully improved bonds’ role in diversified portfolios, making a balanced approach more rational today than it was in 2015. The cost of holding bonds for income and stability is lower than it has been in over a decade.
The stocks versus bonds question is not a one-time decision. It evolves with an investor’s horizon, circumstances, and the market environment. Reviewing a current allocation against the lifecycle logic covered in this analysis is a practical starting point, one that translates a century of evidence into a personal decision.
This article is for informational purposes only and should not be considered financial advice. Investors should conduct their own research and consult with financial professionals before making investment decisions. Past performance does not guarantee future results. Financial projections are subject to market conditions and various risk factors.
The equity risk premium is the additional return investors earn for holding stocks instead of bonds, compensating them for higher volatility and drawdown risk. As of January 2025, Aswath Damodaran estimated the US implied equity risk premium at approximately 4.6%, suggesting the market still prices in a meaningful advantage for equities over fixed income.
Global equities have delivered approximately 7-8% nominal annualised returns over multi-decade horizons, compared to 3-4% for global investment-grade bonds, according to BlackRock and Fidelity 2025 long-term capital market assumptions. In the US specifically, equities have averaged around 10% nominal per year over the last century versus 5-6% for bonds.
Investors with 20 or more years before drawing on their savings have historically benefited from a dominant equity allocation, as over 20-year rolling periods US equities have not lost money in real terms according to J.P. Morgan research. Investors approaching or in retirement should increase bond allocations to manage sequence-of-returns risk, where early portfolio drawdowns can permanently impair spending sustainability.
Higher yields have improved bonds materially: 10-year US Treasury yields around 4-4.5% with real yields of approximately 1-1.5% mean bonds now offer genuine income for the first time in over a decade. However, both BlackRock and Vanguard maintain that equities remain the primary long-run growth engine, and bonds are more competitive for income and stability rather than as a replacement for equity returns.
A $100,000 portfolio growing at 7% annually reaches approximately $761,000 over 30 years, while the same portfolio growing at 4% reaches roughly $324,000. This compounding gap illustrates why the 3-4 percentage point annual return advantage equities hold over bonds translates into dramatically different long-term wealth outcomes.