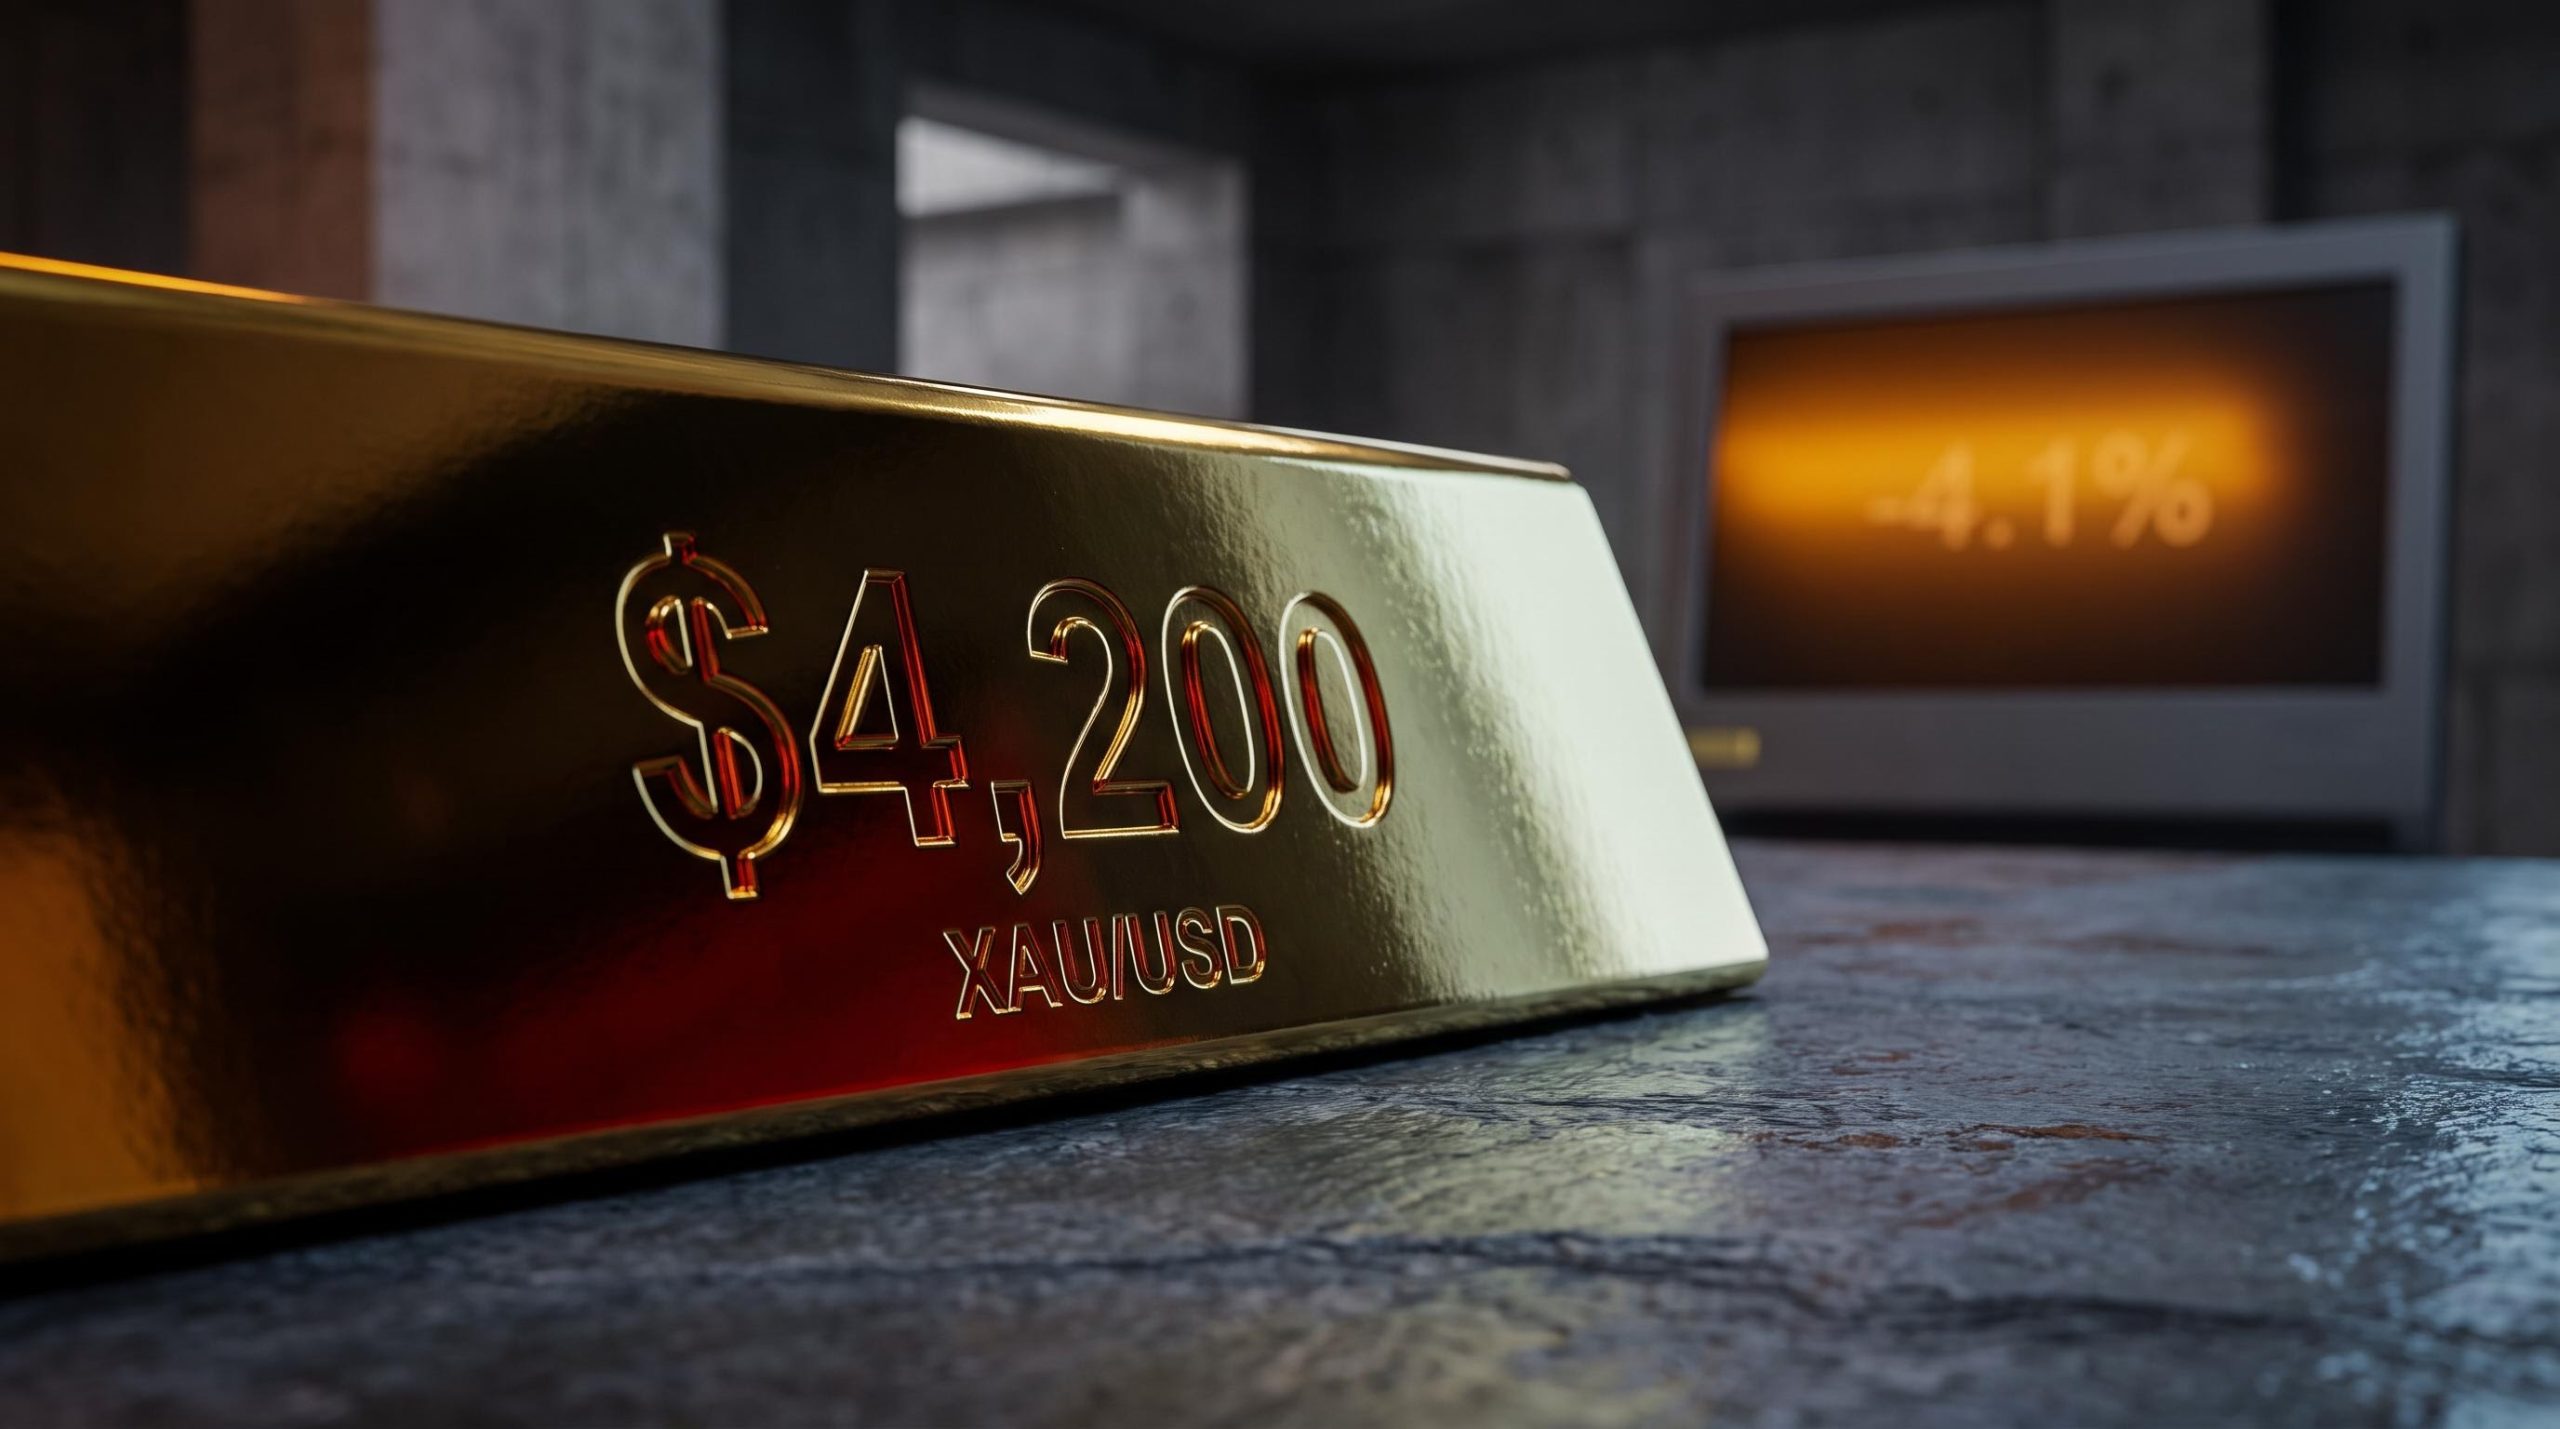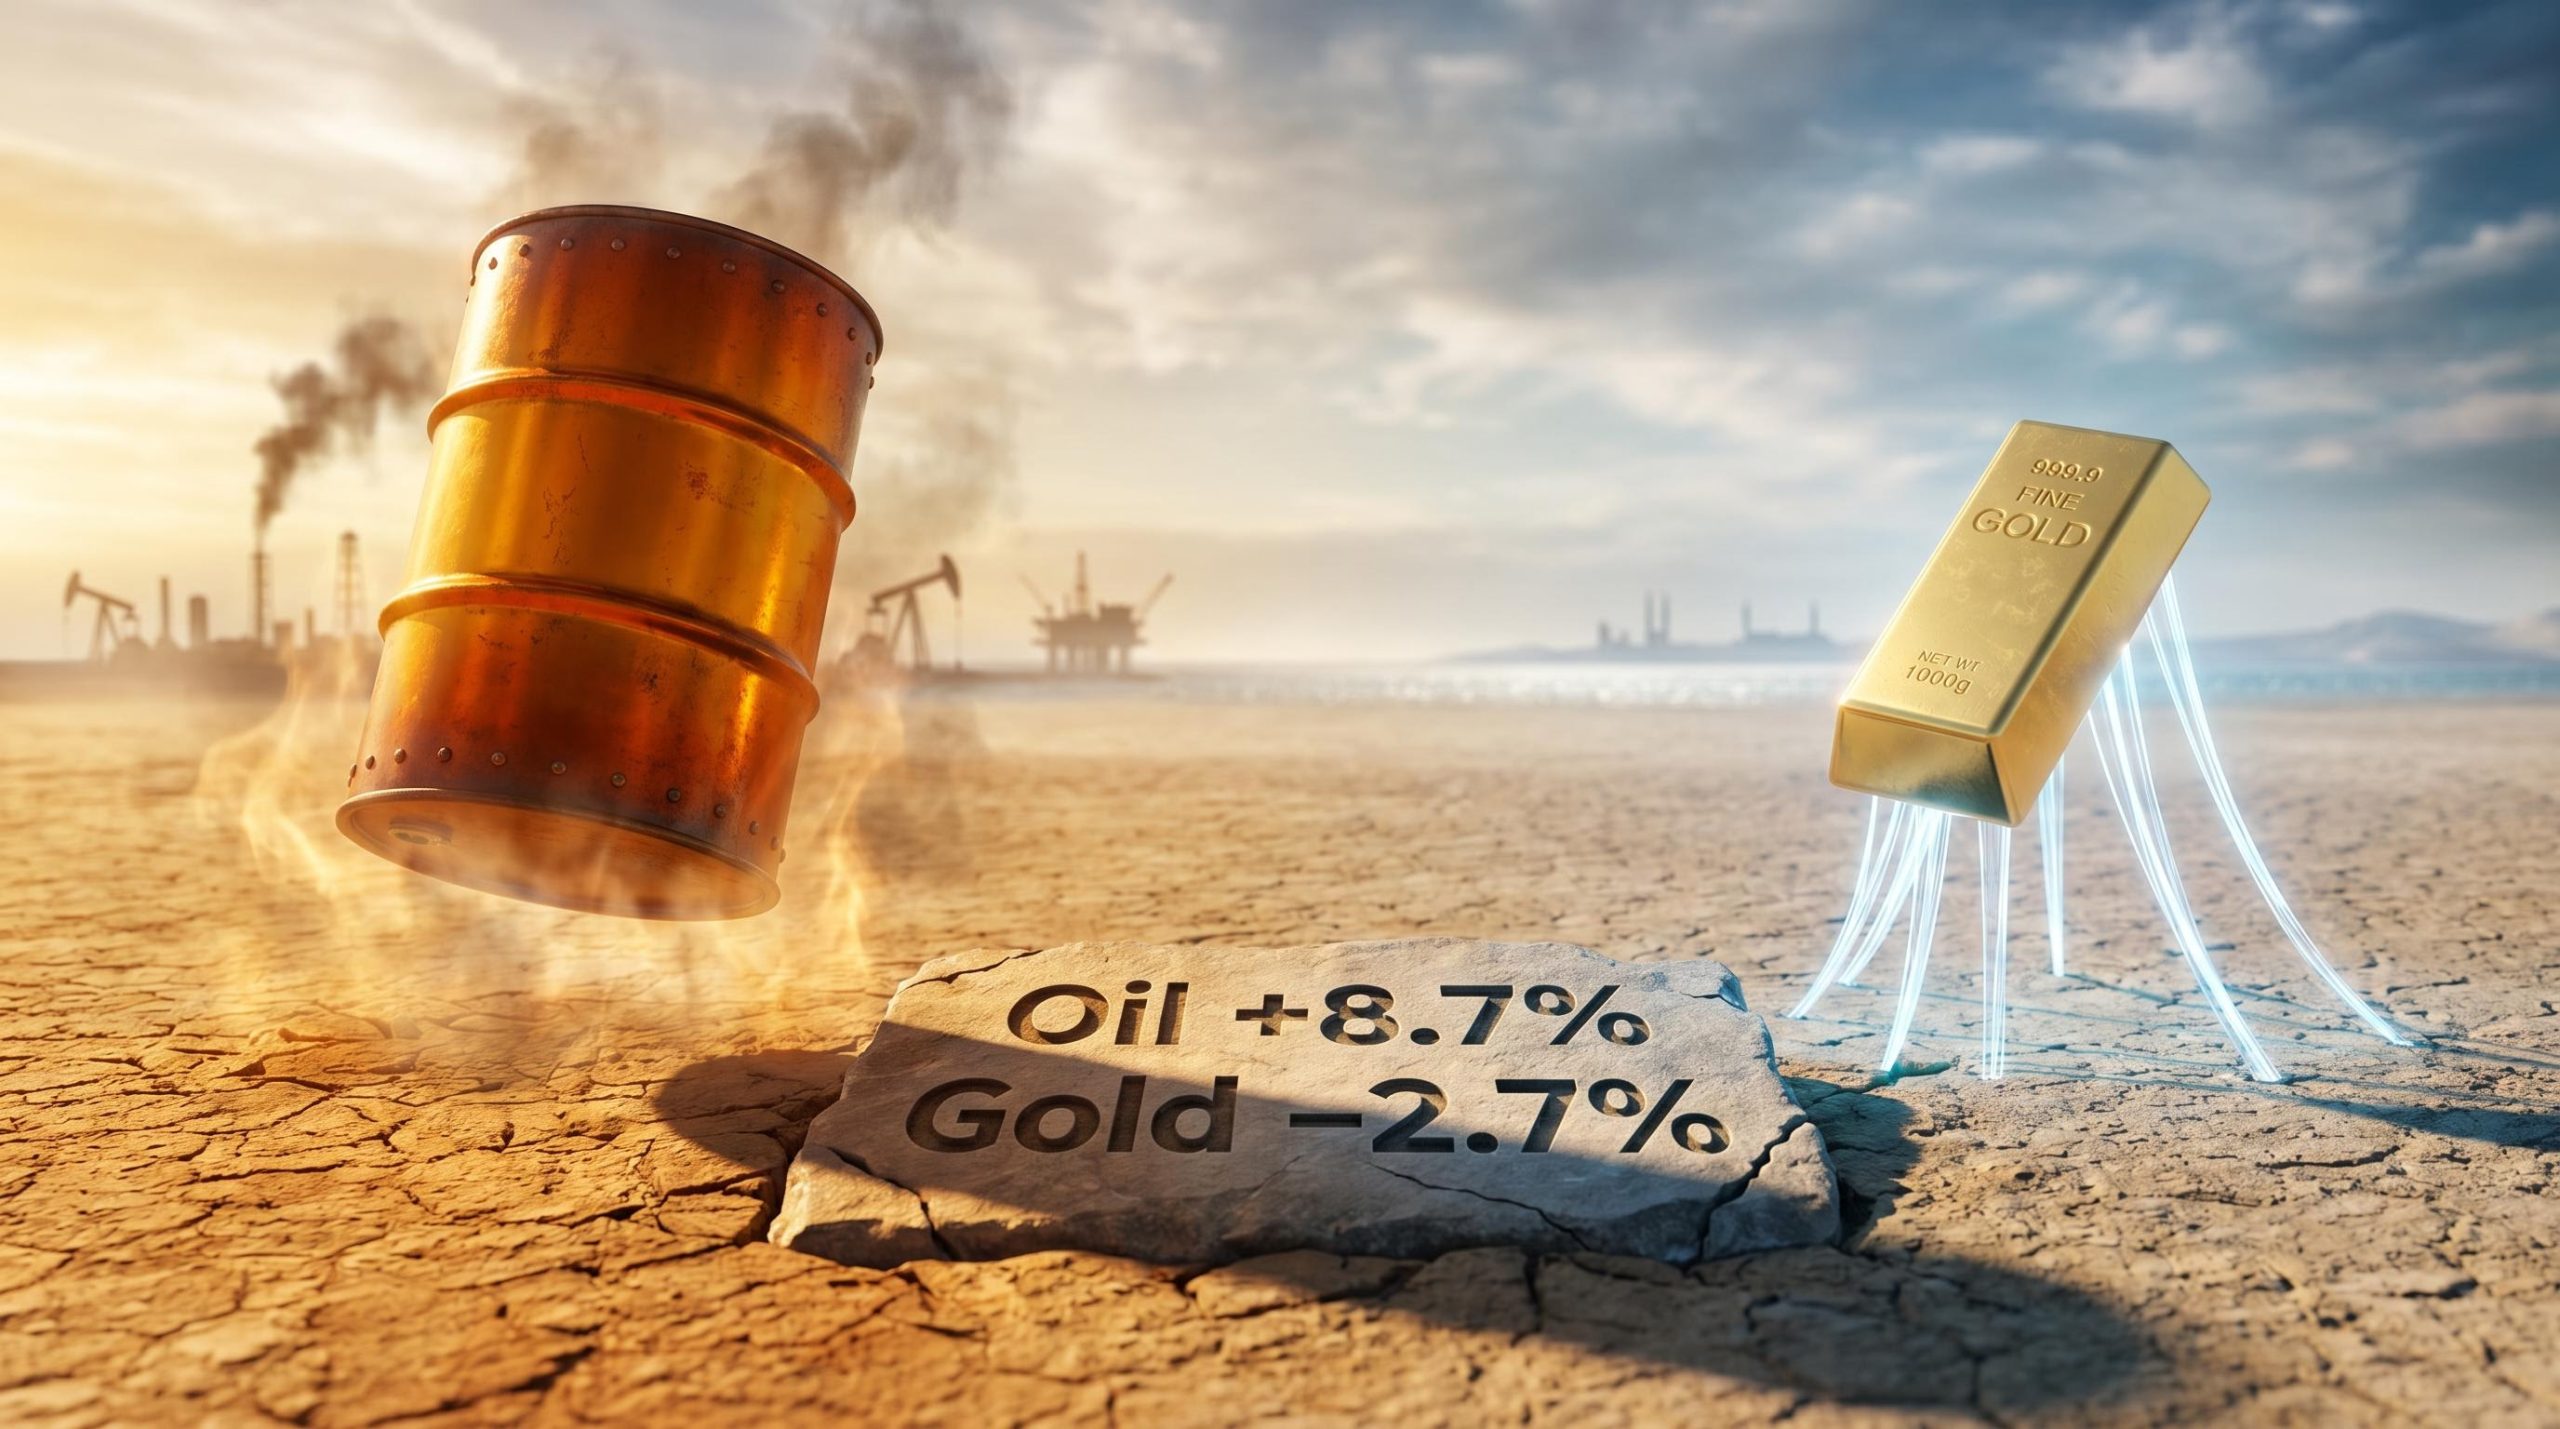
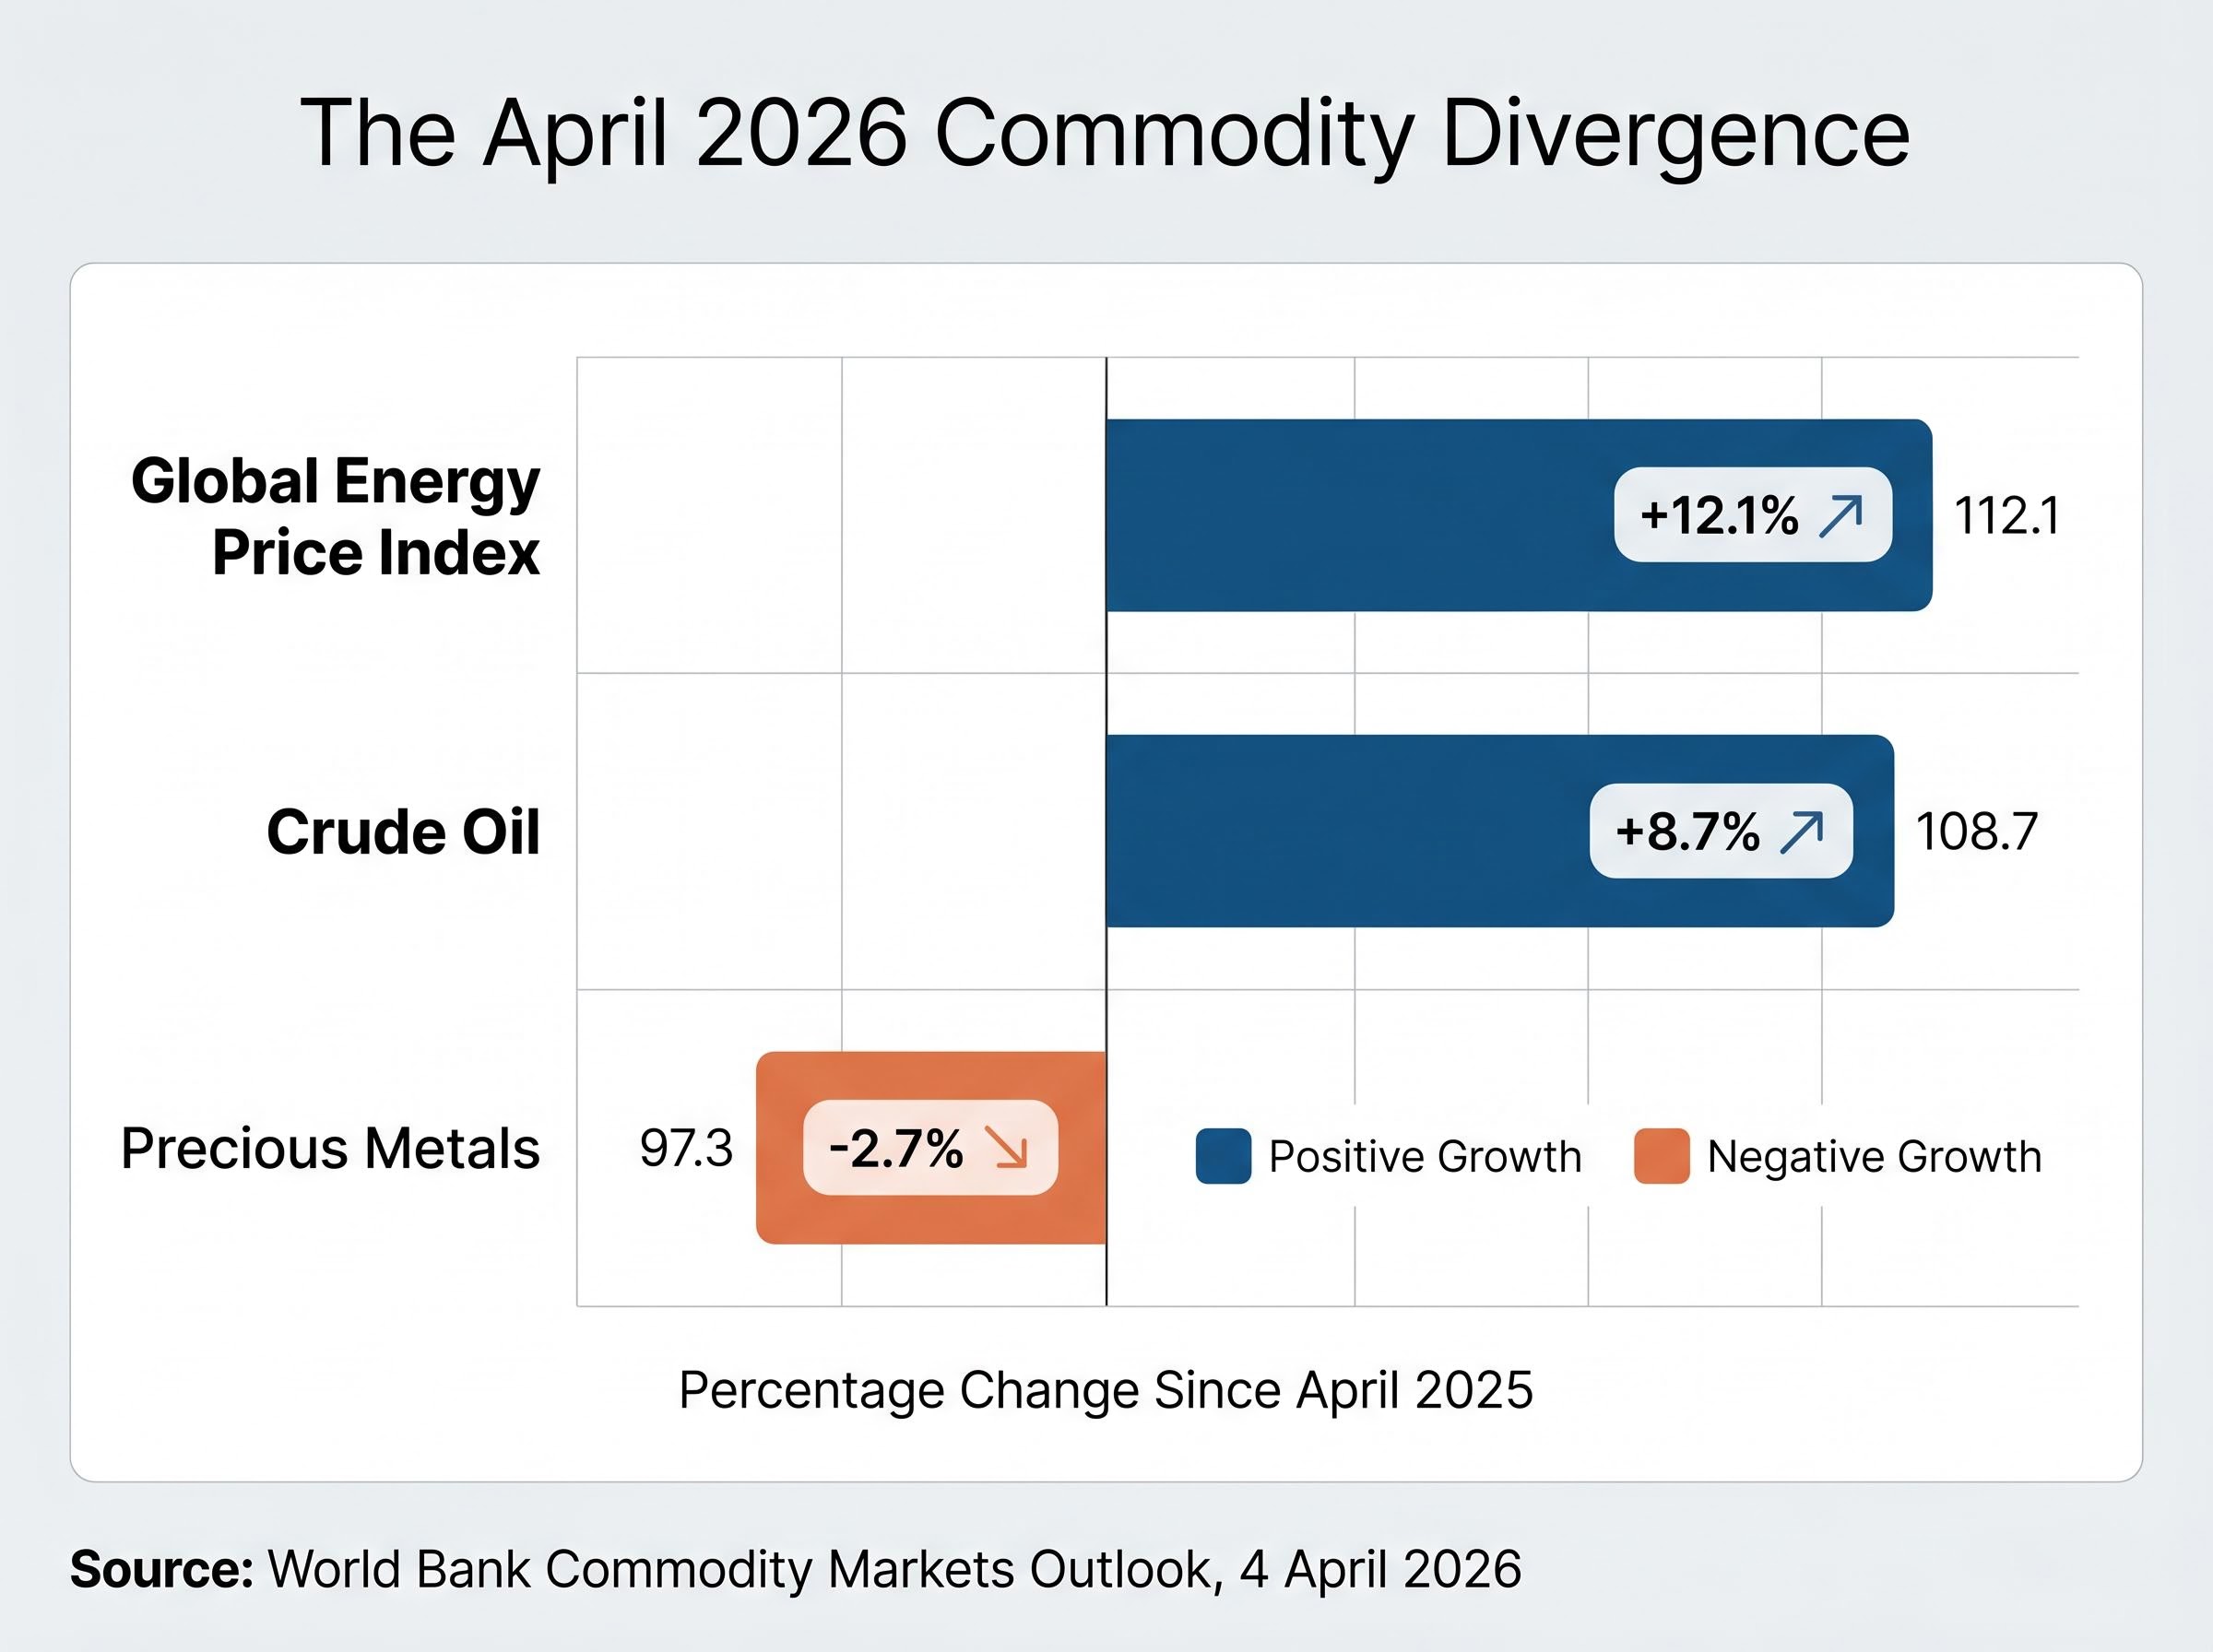
In April 2026, the Middle East war sent the global energy price index surging 12.1% in a single month. Crude oil climbed 8.7%. Precious metals, the asset class most investors associate with geopolitical fear, fell 2.7% over the same period. If geopolitical crises are supposed to be good for safe-haven assets, why did gold drop while oil spiked?
The assumption that war and instability automatically lift gold alongside energy prices is one of the most persistent and costly misunderstandings in commodity investing. The relationship between geopolitical risk and commodity prices is conditional, not automatic. Understanding why requires unpacking how geopolitical shocks travel through energy markets, feed into inflation data, and ultimately shape central bank behaviour before they reach gold. What follows is an explanation of the mechanics behind that transmission chain, why oil absorbs Strait of Hormuz risk premiums but faces structural ceilings of its own, and how a two-layer framework can help investors read these signals with greater clarity.
Why the “geopolitical crisis equals higher gold” rule keeps breaking down
The intuition is straightforward. Conflict in the Middle East raises uncertainty. Uncertainty drives safe-haven demand. Gold rises. It is a mental model that most investors carry, and during certain historical episodes it has held.
The World Bank’s Commodity Markets Outlook, published on 4 April 2026, offers a direct empirical contradiction. While the energy price index jumped 12.1% and crude oil gained 8.7%, precious metals declined 2.7%, all during the same conflict-driven period.
The World Bank Commodity Markets Outlook, published in April 2026, provides the underlying data behind the divergence, recording the 12.1% energy price surge and the simultaneous 2.7% decline in precious metals across the same conflict-driven month.
World Bank, April 2026: Energy prices surged 12.1% while precious metals fell 2.7% in the same month, driven by the same Middle East war. The divergence confirms that geopolitical energy shocks do not automatically translate into precious-metals breakouts.
Gold held above $4,500/oz through this period but could not sustain gains above the $4,640-$4,750 resistance zone, despite ongoing Middle East tension. WTI crude traded above $93/bbl. The crisis was real. The divergence was real. And it was not an anomaly; it was a representative case of a pattern that has repeated across 2024-2026.
The explanation requires assessing three forces simultaneously, not just one:
The relationship between bond yields and commodity prices runs through two distinct channels: the opportunity cost of holding non-yielding assets like gold rises directly as risk-free rates climb, and a stronger dollar simultaneously raises the effective local-currency cost of USD-denominated commodities for major importers like China and India, softening physical demand.
- The severity of the geopolitical shock itself
- The degree to which that shock transmits into energy prices and then into inflation data
- The central bank policy response that higher inflation triggers, and how that response affects real yields and the dollar
Each of these layers can reinforce or cancel the others. The rest of this article unpacks how.
When big ASX news breaks, our subscribers know first
How the Strait of Hormuz turns a regional conflict into a global price signal
The Strait of Hormuz is the single most consequential chokepoint in global oil supply. Roughly one-fifth of the world’s petroleum passes through a waterway narrow enough that any credible threat of disruption moves prices immediately. Markets do not wait for a closure to react; the probability of one is sufficient.
Capital Economics frames the risk explicitly: “the outlook for oil prices largely depends on how the conflict in Iran evolves. The longer the Strait of Hormuz remains effectively closed, the higher oil prices could rise.” Their baseline, however, assumes only partial and temporary disruptions, not a prolonged shutdown.
The US-Iran conflict market impact across oil, the dollar, gold, and equities has followed the same conditional logic described here: Brent climbed roughly 40% from pre-conflict levels while gold fell 0.8% over the same three-month period, with dollar strength and higher-for-longer rate expectations working against bullion simultaneously.
That distinction between a genuine closure and the partial disruption analysts treat as realistic matters enormously for how much risk premium oil can sustain.
| Scenario | Implied oil price impact | Analyst baseline probability |
|---|---|---|
| Strait open (moderate tension) | Brent near $74/bbl (EIA baseline) | Embedded in forward curves |
| Partial or temporary closure | WTI $90-$100+; elevated but bounded | Treated as primary risk scenario |
| Prolonged full closure | Significant sustained premium above $100 | Low probability; tail risk |
Deutsche Bank, summarising Energy Information Administration projections, forecasts Brent averaging $74/bbl in 2025, falling to $66/bbl in 2026, implying a relatively modest embedded geopolitical risk premium even amid active conflict. The World Bank projects energy prices rising 24% in 2026 to their highest level since Russia’s 2022 invasion of Ukraine, but stabilisation projections suggest markets view the disruption as severe rather than permanent.
The structural ceiling on oil’s risk premium comes from three directions. Non-OPEC supply growth, particularly from US shale, provides a natural cap. OPEC+ spare capacity acts as a buffer. And weaker-than-expected global demand growth limits how long an elevated premium can persist. OPEC+’s December 2024 decision to delay planned output increases to April 2025, later extended further, tightened near-term supply to provide a higher floor. But even that support operates within bounds.
The risk premium is real. It is also bounded. And that distinction is what determines whether oil’s gains help or hurt gold.
The transmission mechanism: why higher oil prices can cap gold rather than lift it
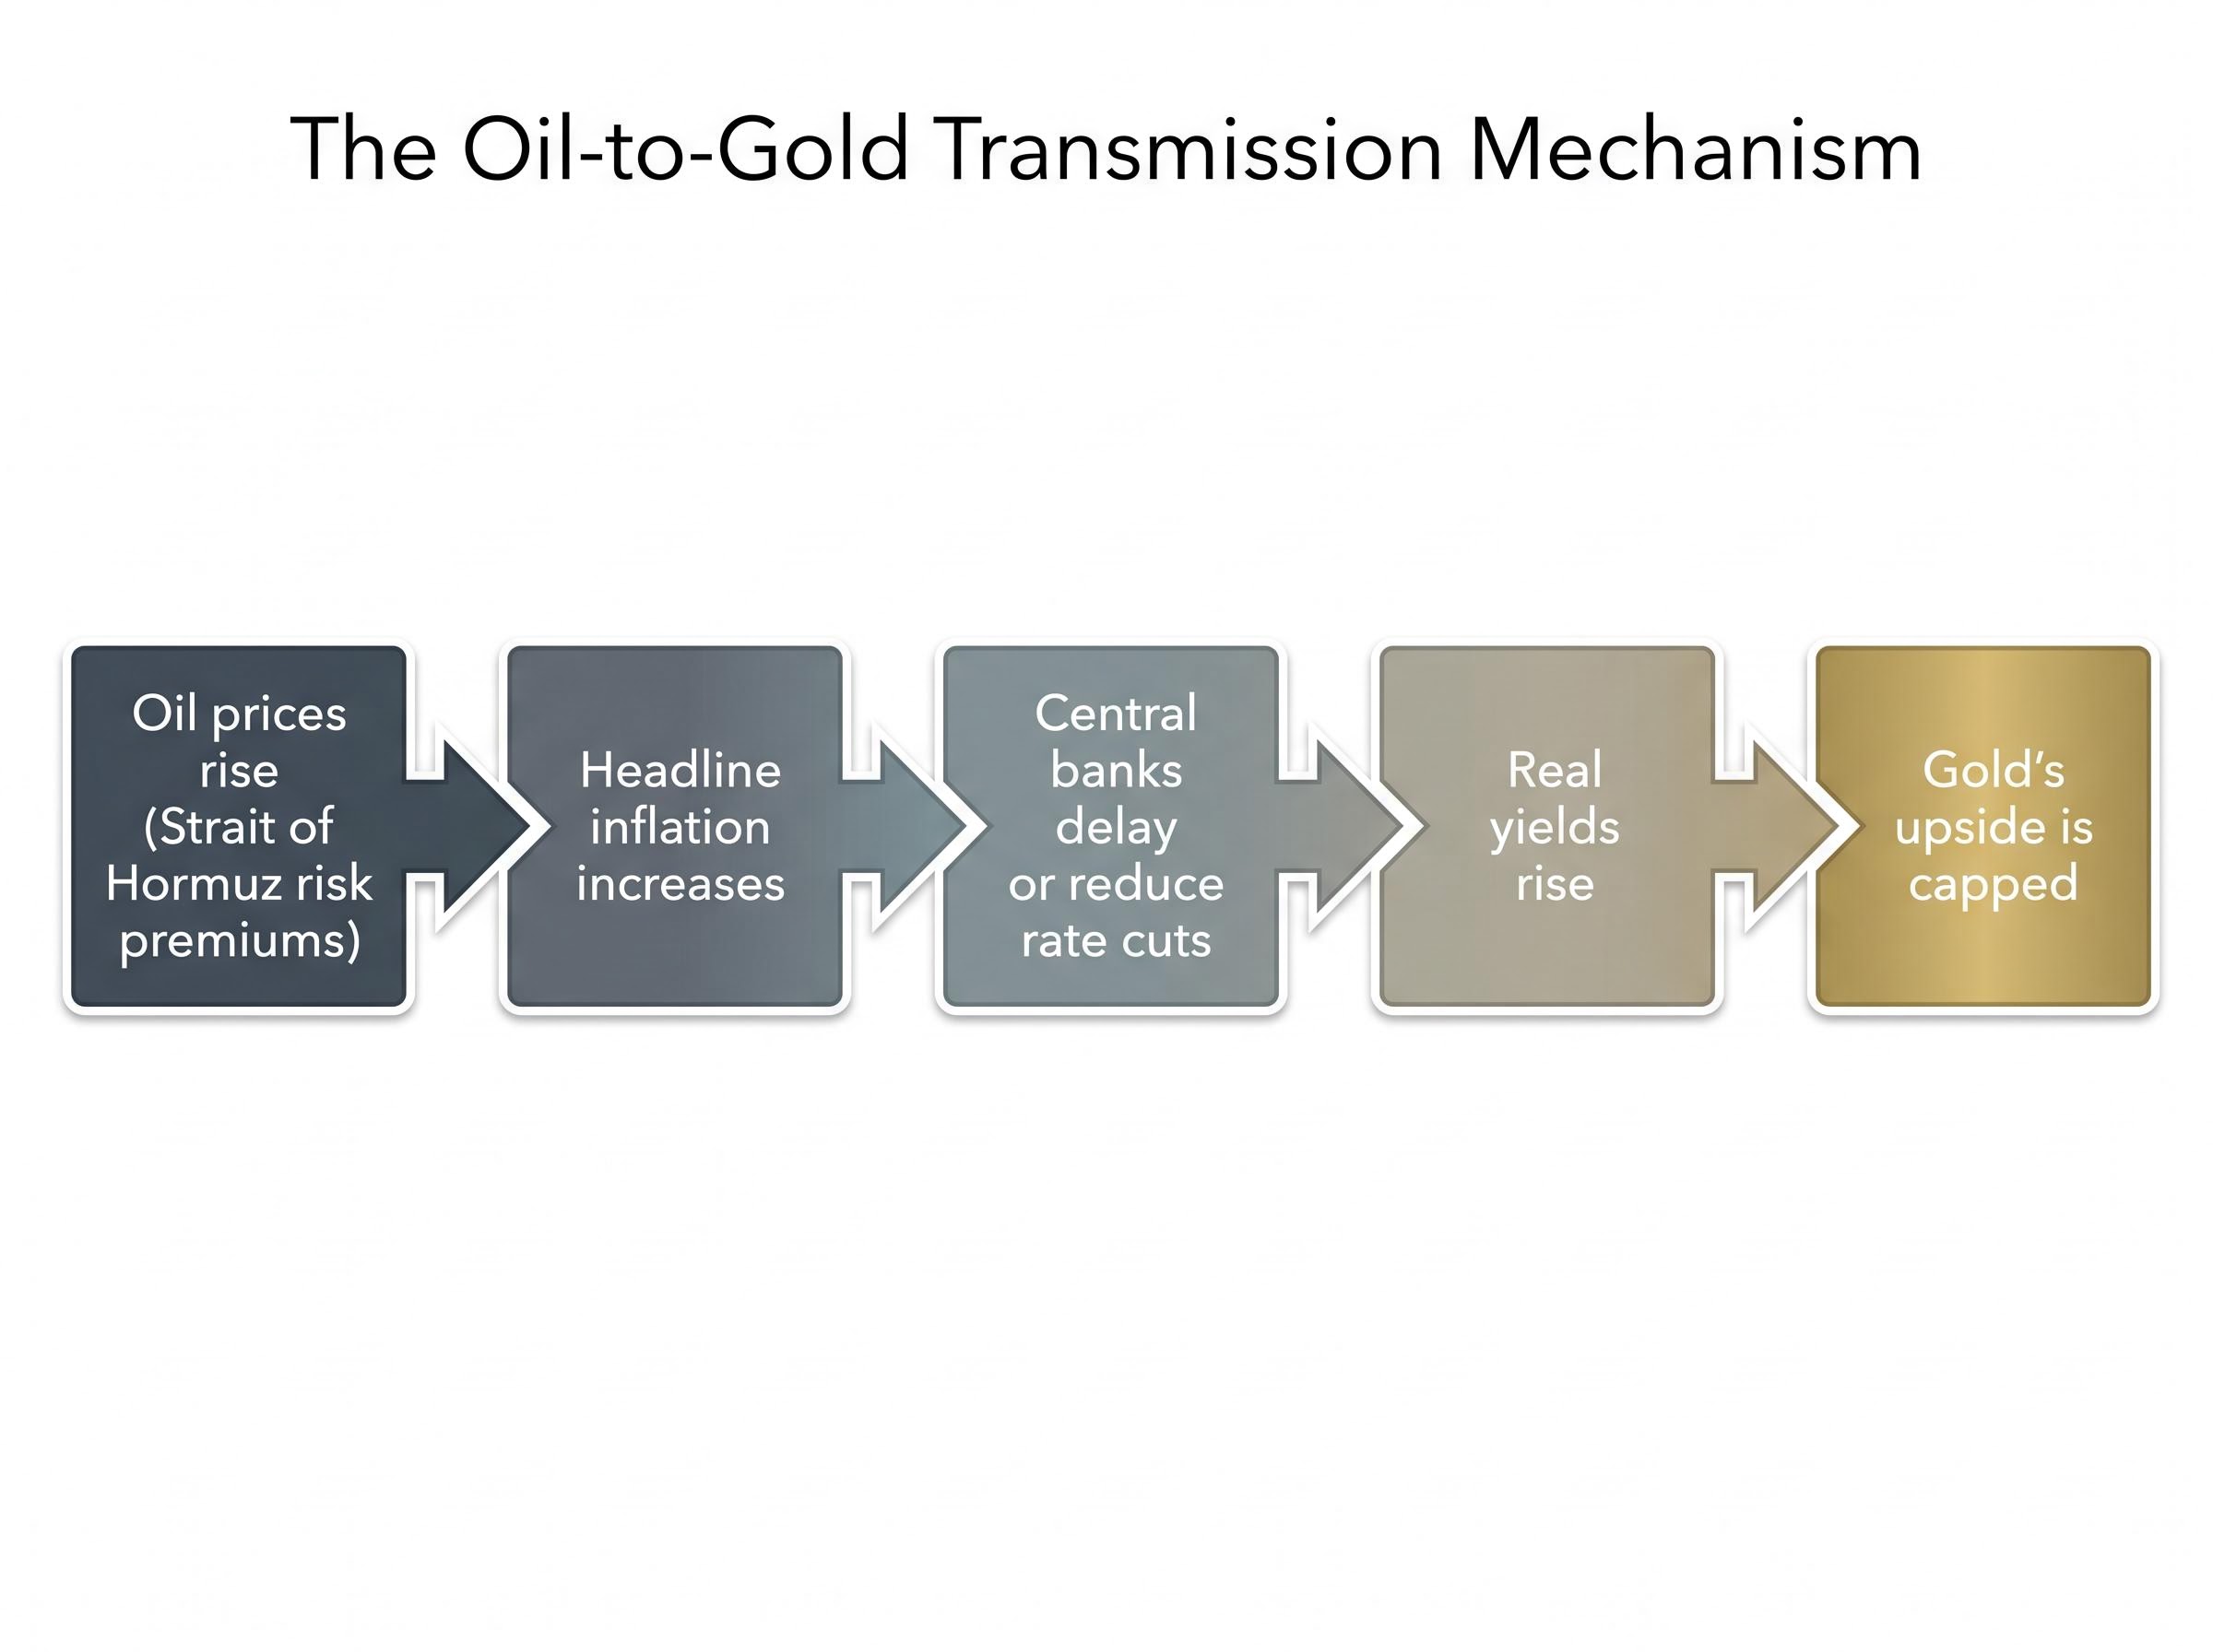
This is the concept that resolves the paradox. The chain has five links, and each must be followed in sequence to see why a geopolitical event that pushes oil higher can simultaneously suppress gold.
- Oil prices rise as Strait of Hormuz risk premiums are priced into energy markets
- Headline inflation increases as higher energy costs feed into consumer and producer price data
- Central banks delay or reduce rate cuts because sticky inflation constrains their ability to ease monetary policy
- Real yields rise as markets price in a higher-for-longer interest rate environment
- Gold’s upside is capped because the opportunity cost of holding a non-yielding asset increases, and rallies fade as yield-seeking investors rotate elsewhere
This is not a theoretical construct. Capital Economics identifies real interest rates and dollar strength as the dominant medium-term drivers for gold, outweighing most geopolitical shocks unless those shocks become systemically disruptive. Their explicit conclusion: higher oil prices that prevent central bank easing are net-negative for gold because the higher real-yield path dominates the inflation-hedge argument.
Capital Economics: Higher oil prices that prevent aggressive central bank easing are net-negative for gold, because the higher path for real yields dominates the inflation-hedge argument.
Deutsche Bank reinforces the point: any sustained oil move well above the $74/bbl Brent baseline would “re-ignite inflation concerns and temper rate-cut expectations,” limiting the tailwind for gold rather than boosting it. According to abrdn, investors have been selling gold to pursue income from high rates or returns from risk assets, including equities and crypto, even as geopolitical tension persists.
The mechanism means oil-driven geopolitical shocks are not simply neutral for gold. They can be actively negative. The same crisis that lifts energy prices simultaneously strengthens the forces that enforce gold’s ceiling.
The dollar compounding effect
Hawkish central bank expectations do not operate in isolation. When markets price in fewer rate cuts because of oil-driven inflation, the US dollar strengthens simultaneously. A stronger dollar competes directly with gold as a safe-haven vehicle, creating a second headwind alongside rising real yields.
Gold’s floor is held by central bank buying and geopolitical hedging demand, both of which remain active. But the dollar headwind and the real-yield headwind must both ease before gold can sustain a breakout above technical resistance. Until that shift occurs, rallies during Middle East escalations follow a consistent pattern: an intraday spike on safe-haven bids, followed by a fade as yields and the dollar reassert their influence.
What keeps gold from falling further: the floor mechanics
If rising real yields and a stronger dollar cap gold’s upside, why does it not simply collapse during oil-shock episodes? The answer lies in structural buying that operates independently of the interest rate environment.
Central bank gold purchases have been the primary structural floor across 2024-2026. According to abrdn, central banks have bought enough to offset ETF selling across a “nearly three-year spate,” keeping prices supported even as private-sector investors rotate into yield-bearing alternatives. This buying is driven by reserve diversification away from dollar-denominated assets and by geopolitical hedging at the sovereign level, motivations that do not respond to short-term rate expectations.
Sovereign gold demand from central banks is forecast at 850 tonnes for 2026 by the World Gold Council, a buying pace large enough to absorb sustained ETF outflows and private-sector rotation into yield-bearing assets, which is precisely why the floor holds even when the yield and dollar headwinds are strongest.
- Central bank purchasing programmes absorb ETF outflows and private-sector selling
- Geopolitical hedging demand from institutional and sovereign investors spikes during escalation episodes
- Reserve diversification away from dollar assets provides a structural, non-cyclical bid
- ETF inflows during acute escalation phases provide intermittent but meaningful support
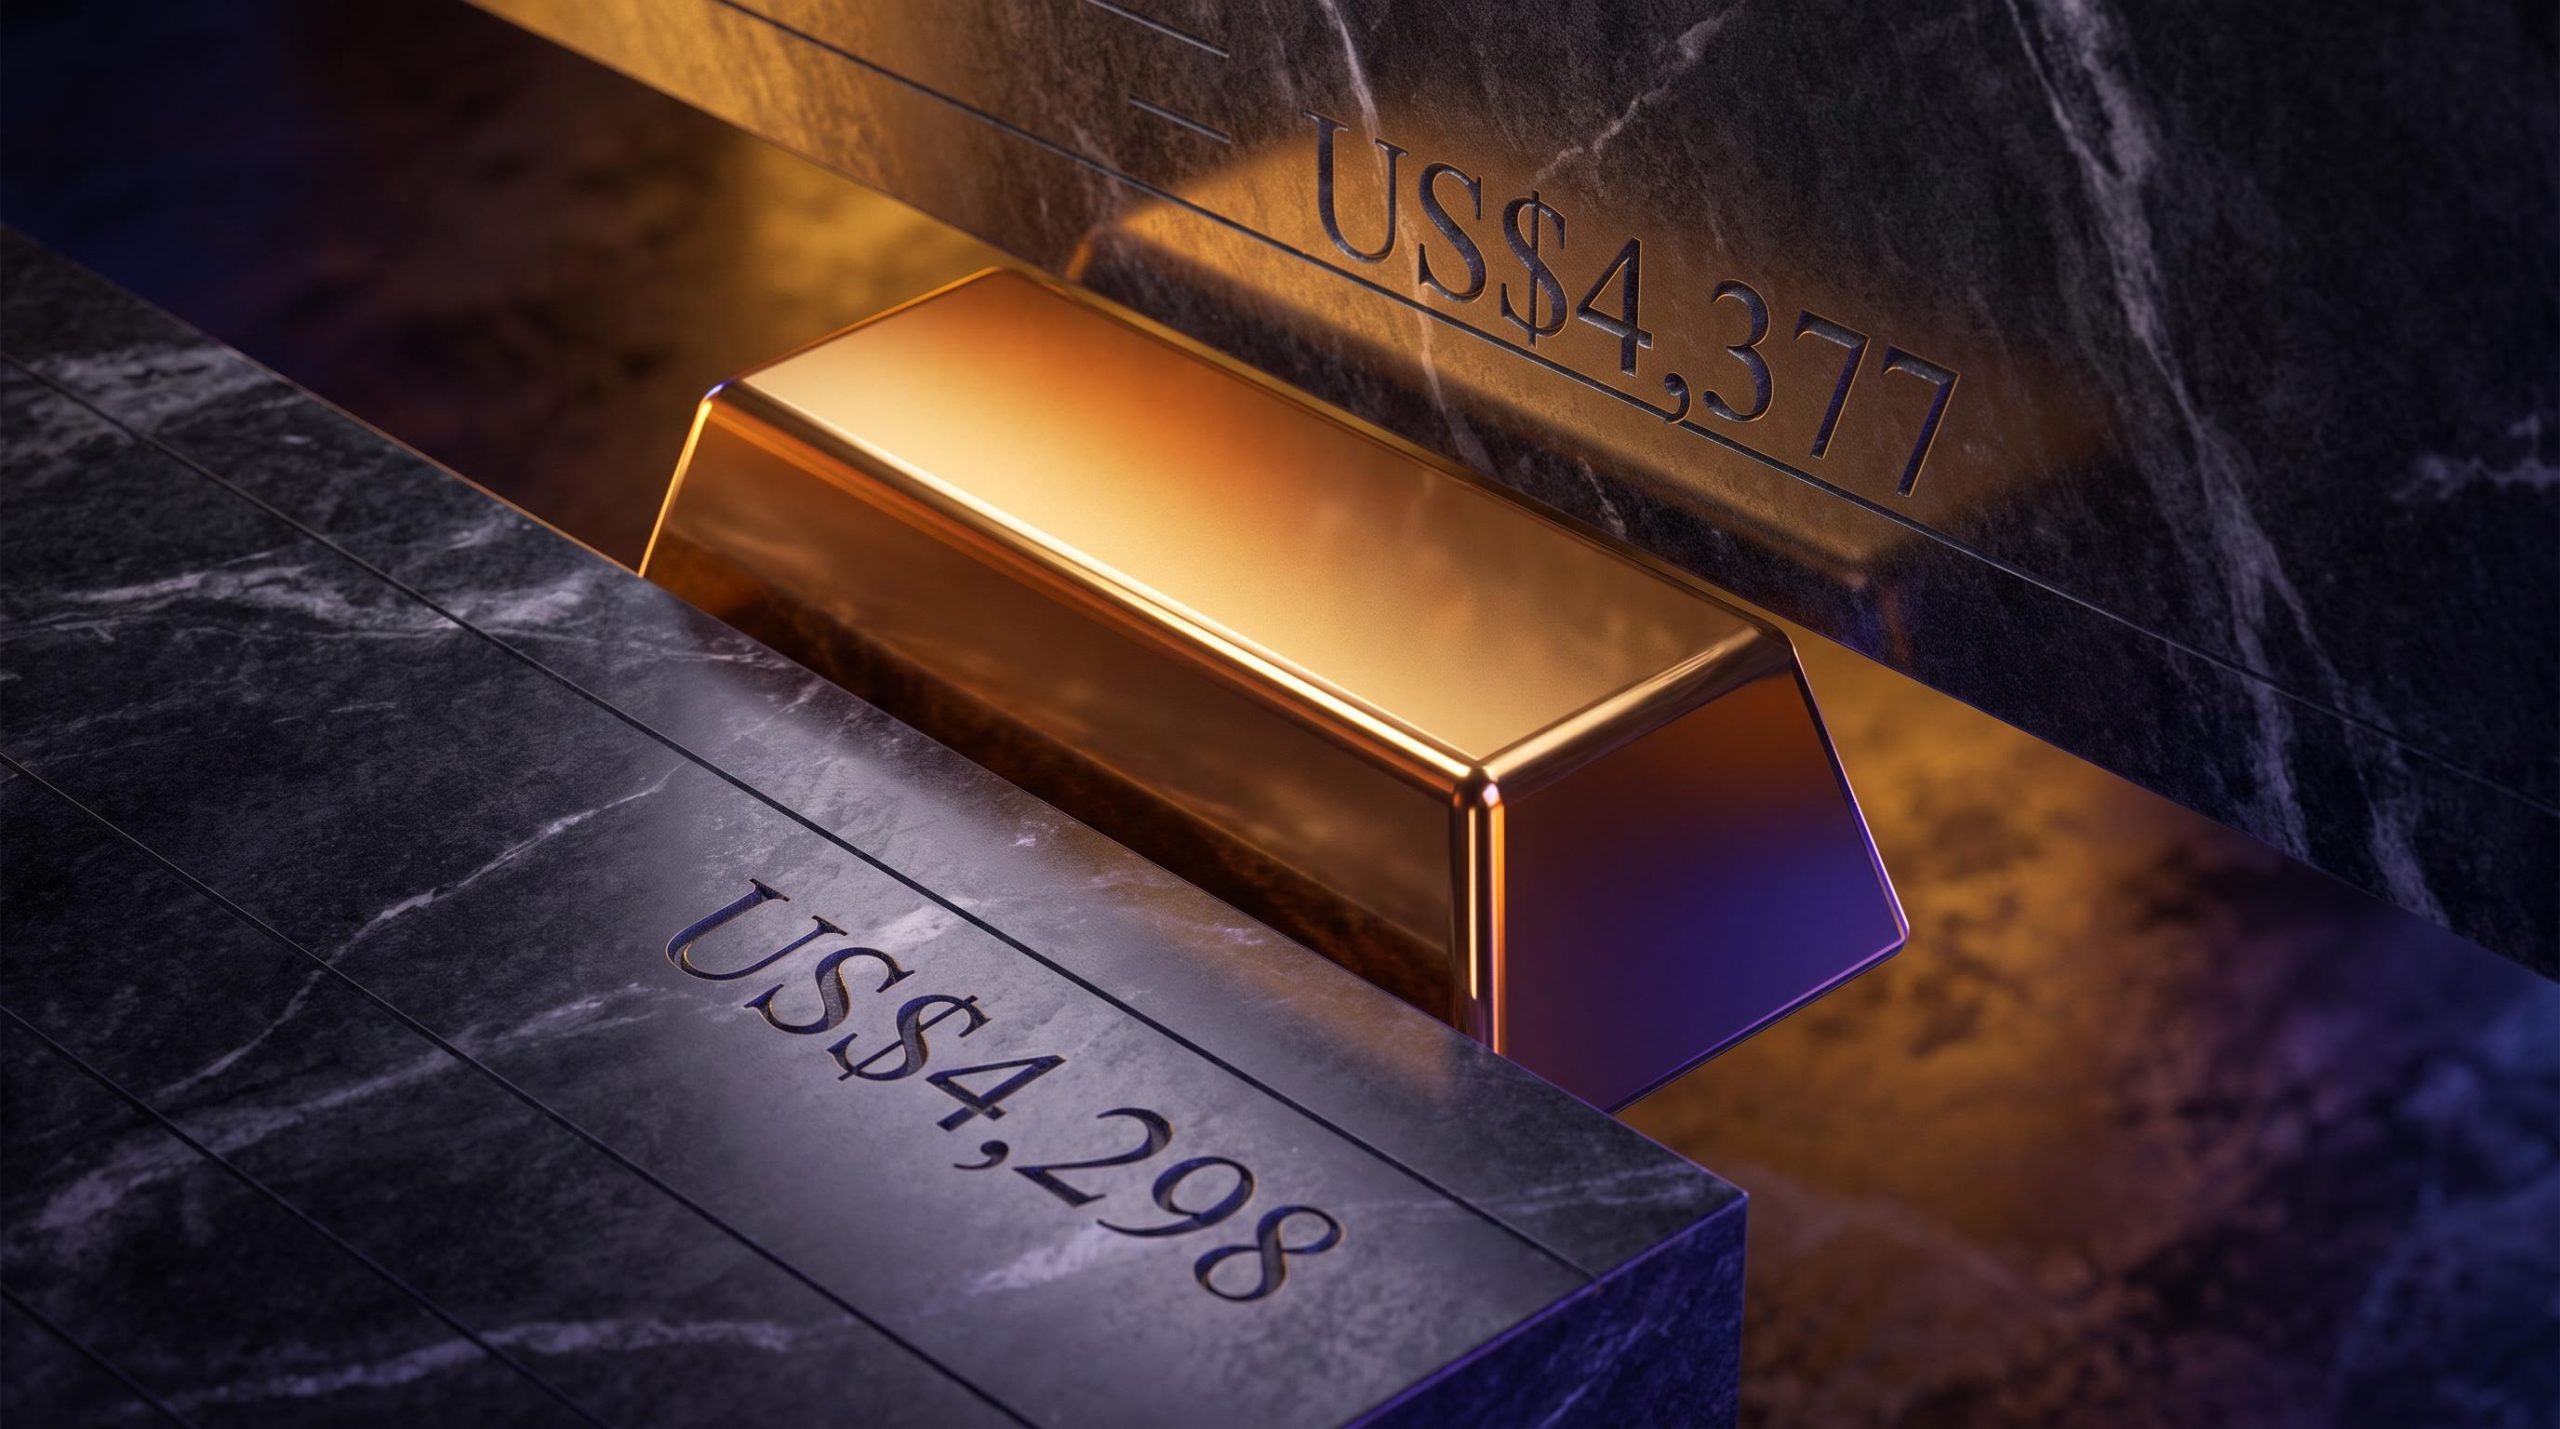
Gold’s technical levels reflect this ceiling-and-floor dynamic. Near-term support sits at approximately $4,490, with a deeper floor near $4,375-$4,389 (the 200-day moving average). Resistance holds at $4,640-$4,750, with a stronger ceiling near $4,875. The World Bank projects overall commodities to rise 16% by 2026, confirming a broadly supportive but not explosive backdrop.
Geopolitical hedging versus systematic selling
The intraday behaviour of gold during Middle East flare-ups reveals the tension between these forces. Sovereign and institutional buyers add positions at escalation, generating the initial spike. Systematic macro funds sell when real yields back up, generating the fade. Closes consistently off intraday highs during conflict episodes are the technical signature of this supply-demand tension.
The range-bound outcome is not a failure of the safe-haven thesis. It is the analytically expected result when structural buying provides a durable floor and monetary policy dynamics enforce a persistent ceiling.
A practical two-layer framework for reading commodity signals during geopolitical episodes
The mechanics described above can be distilled into a decision framework with two layers. Layer 1 assesses macro and geopolitical fundamentals to determine price bands. Layer 2 reads technical resistance levels as the market’s behavioural expression of those fundamentals.
The layers interact in a specific way: a geopolitical shock must be severe enough to shift Layer 1’s fundamental bands before Layer 2’s technical resistance levels can be expected to give way. If the macro picture does not change, technical resistance will hold.
Oliver Wyman (2025): Traders increasingly treat geopolitical shocks as trading opportunities within established technical ranges rather than triggers for structural repricing, unless those shocks fundamentally alter supply, demand, or logistics.
Deutsche Bank’s fundamental price bands approach provides the Layer 1 logic for oil: if WTI or Brent trade well above the EIA-consistent range, the premium is largely attributable to geopolitical risk, signalling vulnerability to reversal if tensions ease. Capital Economics supplies the scenario structure: baseline (Hormuz open, moderate prices), upside risk (prolonged closure, sustained premium), with baseline probability embedded in forward curves.
For gold, Layer 2 resistance at $4,640-$4,750 and the stronger ceiling near $4,875 are reinforced by the macro headwinds described earlier. These levels will not break until a structural shift in real yields or central bank posture occurs.
| Asset | Layer 1: Macro/geopolitical signal | Layer 2: Technical signal | Combined read |
|---|---|---|---|
| Oil (WTI/Brent) | Hormuz risk premium real but bounded by non-OPEC supply and OPEC+ spare capacity | Prices above EIA baseline indicate geopolitical premium vulnerable to reversal | Spike-and-fade pattern likely unless prolonged closure shifts fundamental bands |
| Gold | Real yields and USD strength cap upside; central bank buying supports floor | $4,640-$4,750 resistance reinforced by macro headwinds; $4,490 support intact | Range-bound until rate-cut expectations or central bank posture structurally shift |
Applied to the April 2026 divergence: oil’s Layer 1 signal (genuine Hormuz disruption risk) was strong enough to push prices above $93/bbl, but Layer 2 structural ceilings from non-OPEC supply and demand weakness limited the duration. Gold’s Layer 1 signal (higher oil transmitting into sticky inflation and delayed rate cuts) was actively negative, reinforcing technical resistance rather than challenging it. The framework predicted the divergence.
The paradox resolves: reading the next Middle East headline with clearer eyes
Geopolitical risk does not flow into commodity prices in a straight line. It must pass through an energy-to-inflation-to-monetary-policy filter before reaching gold, and that filter can reverse the expected direction entirely. The same crisis that sends oil higher can suppress gold if the inflation transmission is strong enough to constrain central bank easing.
There are genuine cases where the simple rule holds. A truly prolonged Hormuz closure, a systemically disruptive supply shock, or a sudden shift toward central bank dovishness would alter the ceiling-and-floor dynamic. These are tail risks, not baseline scenarios, but they exist.
Investors who monitor real yields, central bank policy signals, and Hormuz shipping data simultaneously will be better positioned than those who rely on the geopolitical headline alone. The relationship between geopolitical risk and commodity prices is mediated, not direct. That single insight changes how every subsequent Middle East headline should be read.
For investors wanting to translate the two-layer analytical framework into concrete portfolio decisions, our dedicated guide to geopolitical investing strategy covers gold allocation targets recommended by BlackRock and Vanguard, rebalancing cadence across geopolitical shock cycles, and a five-component resilience checklist that applies before, during, and after the next crisis.
This article is for informational purposes only and should not be considered financial advice. Investors should conduct their own research and consult with financial professionals before making investment decisions. Financial projections referenced are subject to market conditions and various risk factors. Past performance does not guarantee future results.