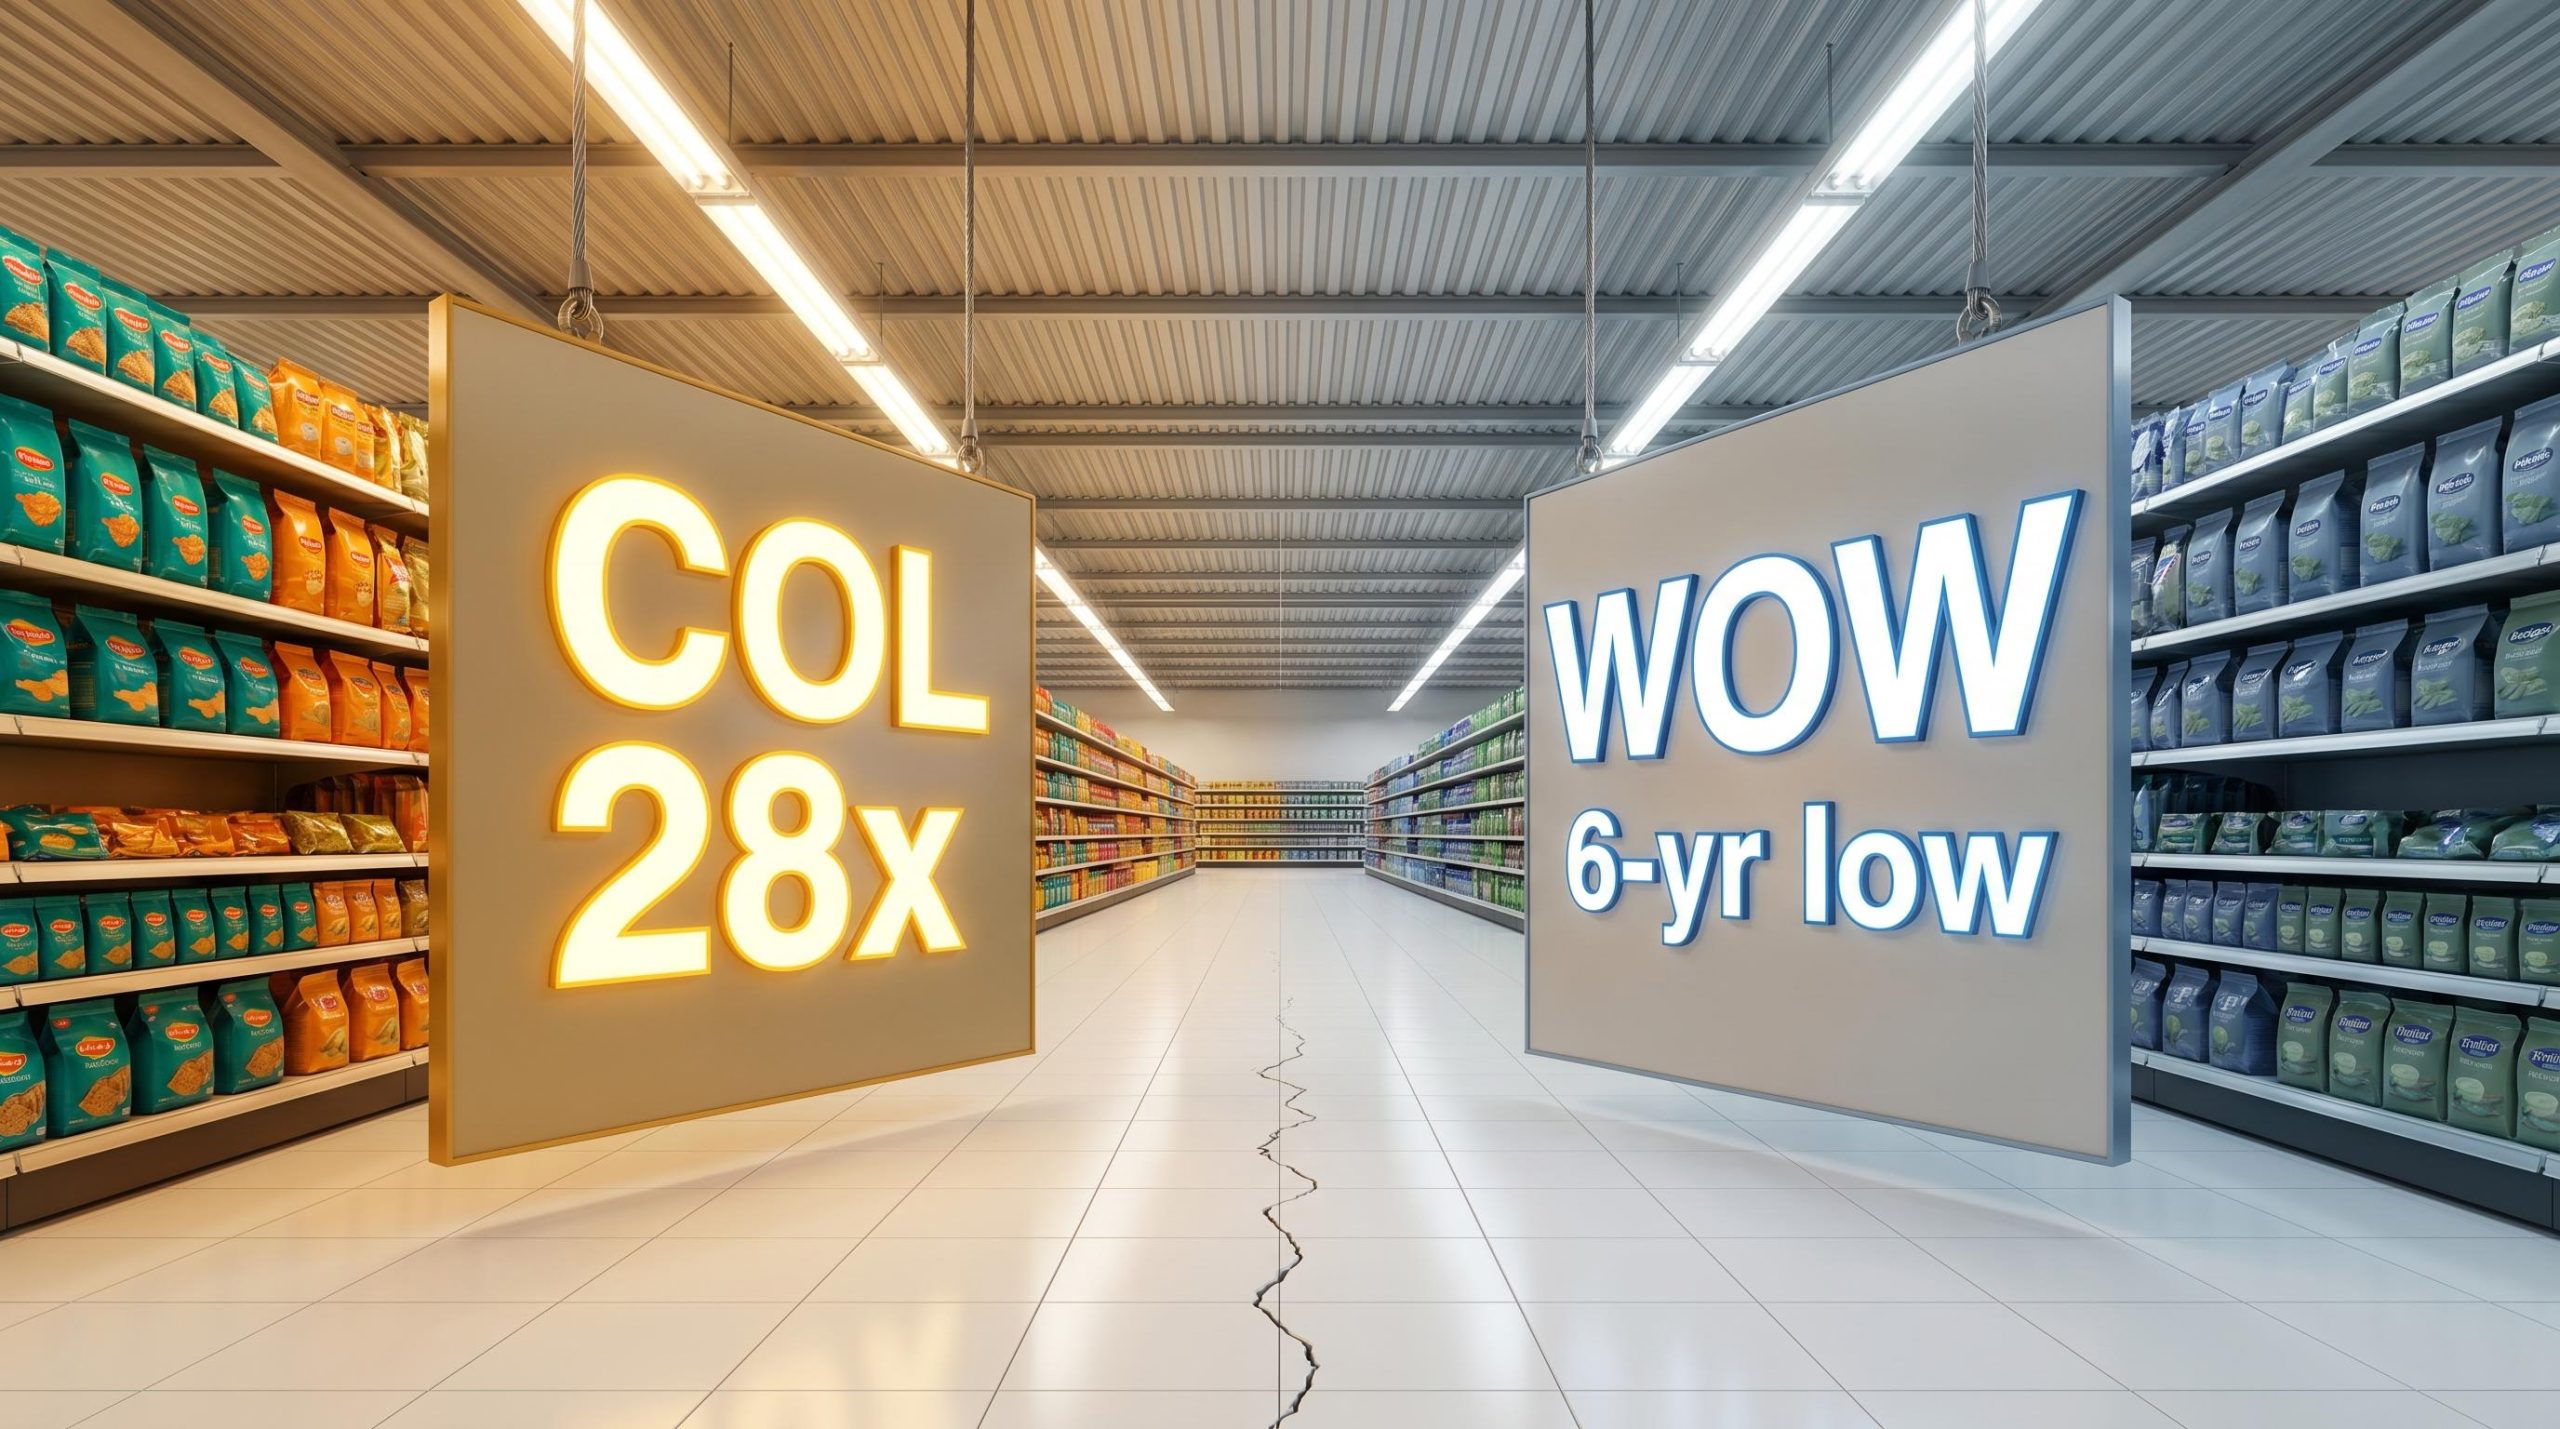
In September 2025, two companies selling groceries to the same Australians, in the same economic conditions, were priced by the market in ways that could not have been more different. Coles sat at record highs. Woolworths traded near its lowest share price in six years. That kind of divergence within a duopoly is rare, and it surfaces a question that matters to ASX investors: does a record high mean a stock has run too far, and does a multi-year low signal an opportunity, or a structural problem that has taken hold?
From a May 2026 vantage point, with half-year results from both companies now on the table, investors can begin to assess which verdict the numbers are starting to confirm. This article uses the Coles and Woolworths divergence as a real-world case study in comparative stock analysis, explaining what drove the gap, what the most recent financials revealed, and what concepts like relative valuation and mean reversion actually mean when applied to a sector investors know well.
How the same sector produced two opposite share price stories
On 11 September 2025, the ASX presented a genuine analytical puzzle. Coles closed at a record high. Woolworths sat near a six-year low. Same customers, same inflation environment, same regulatory pressures. Yet the market was pricing one as a company with its best days ahead and the other as a business under strain.
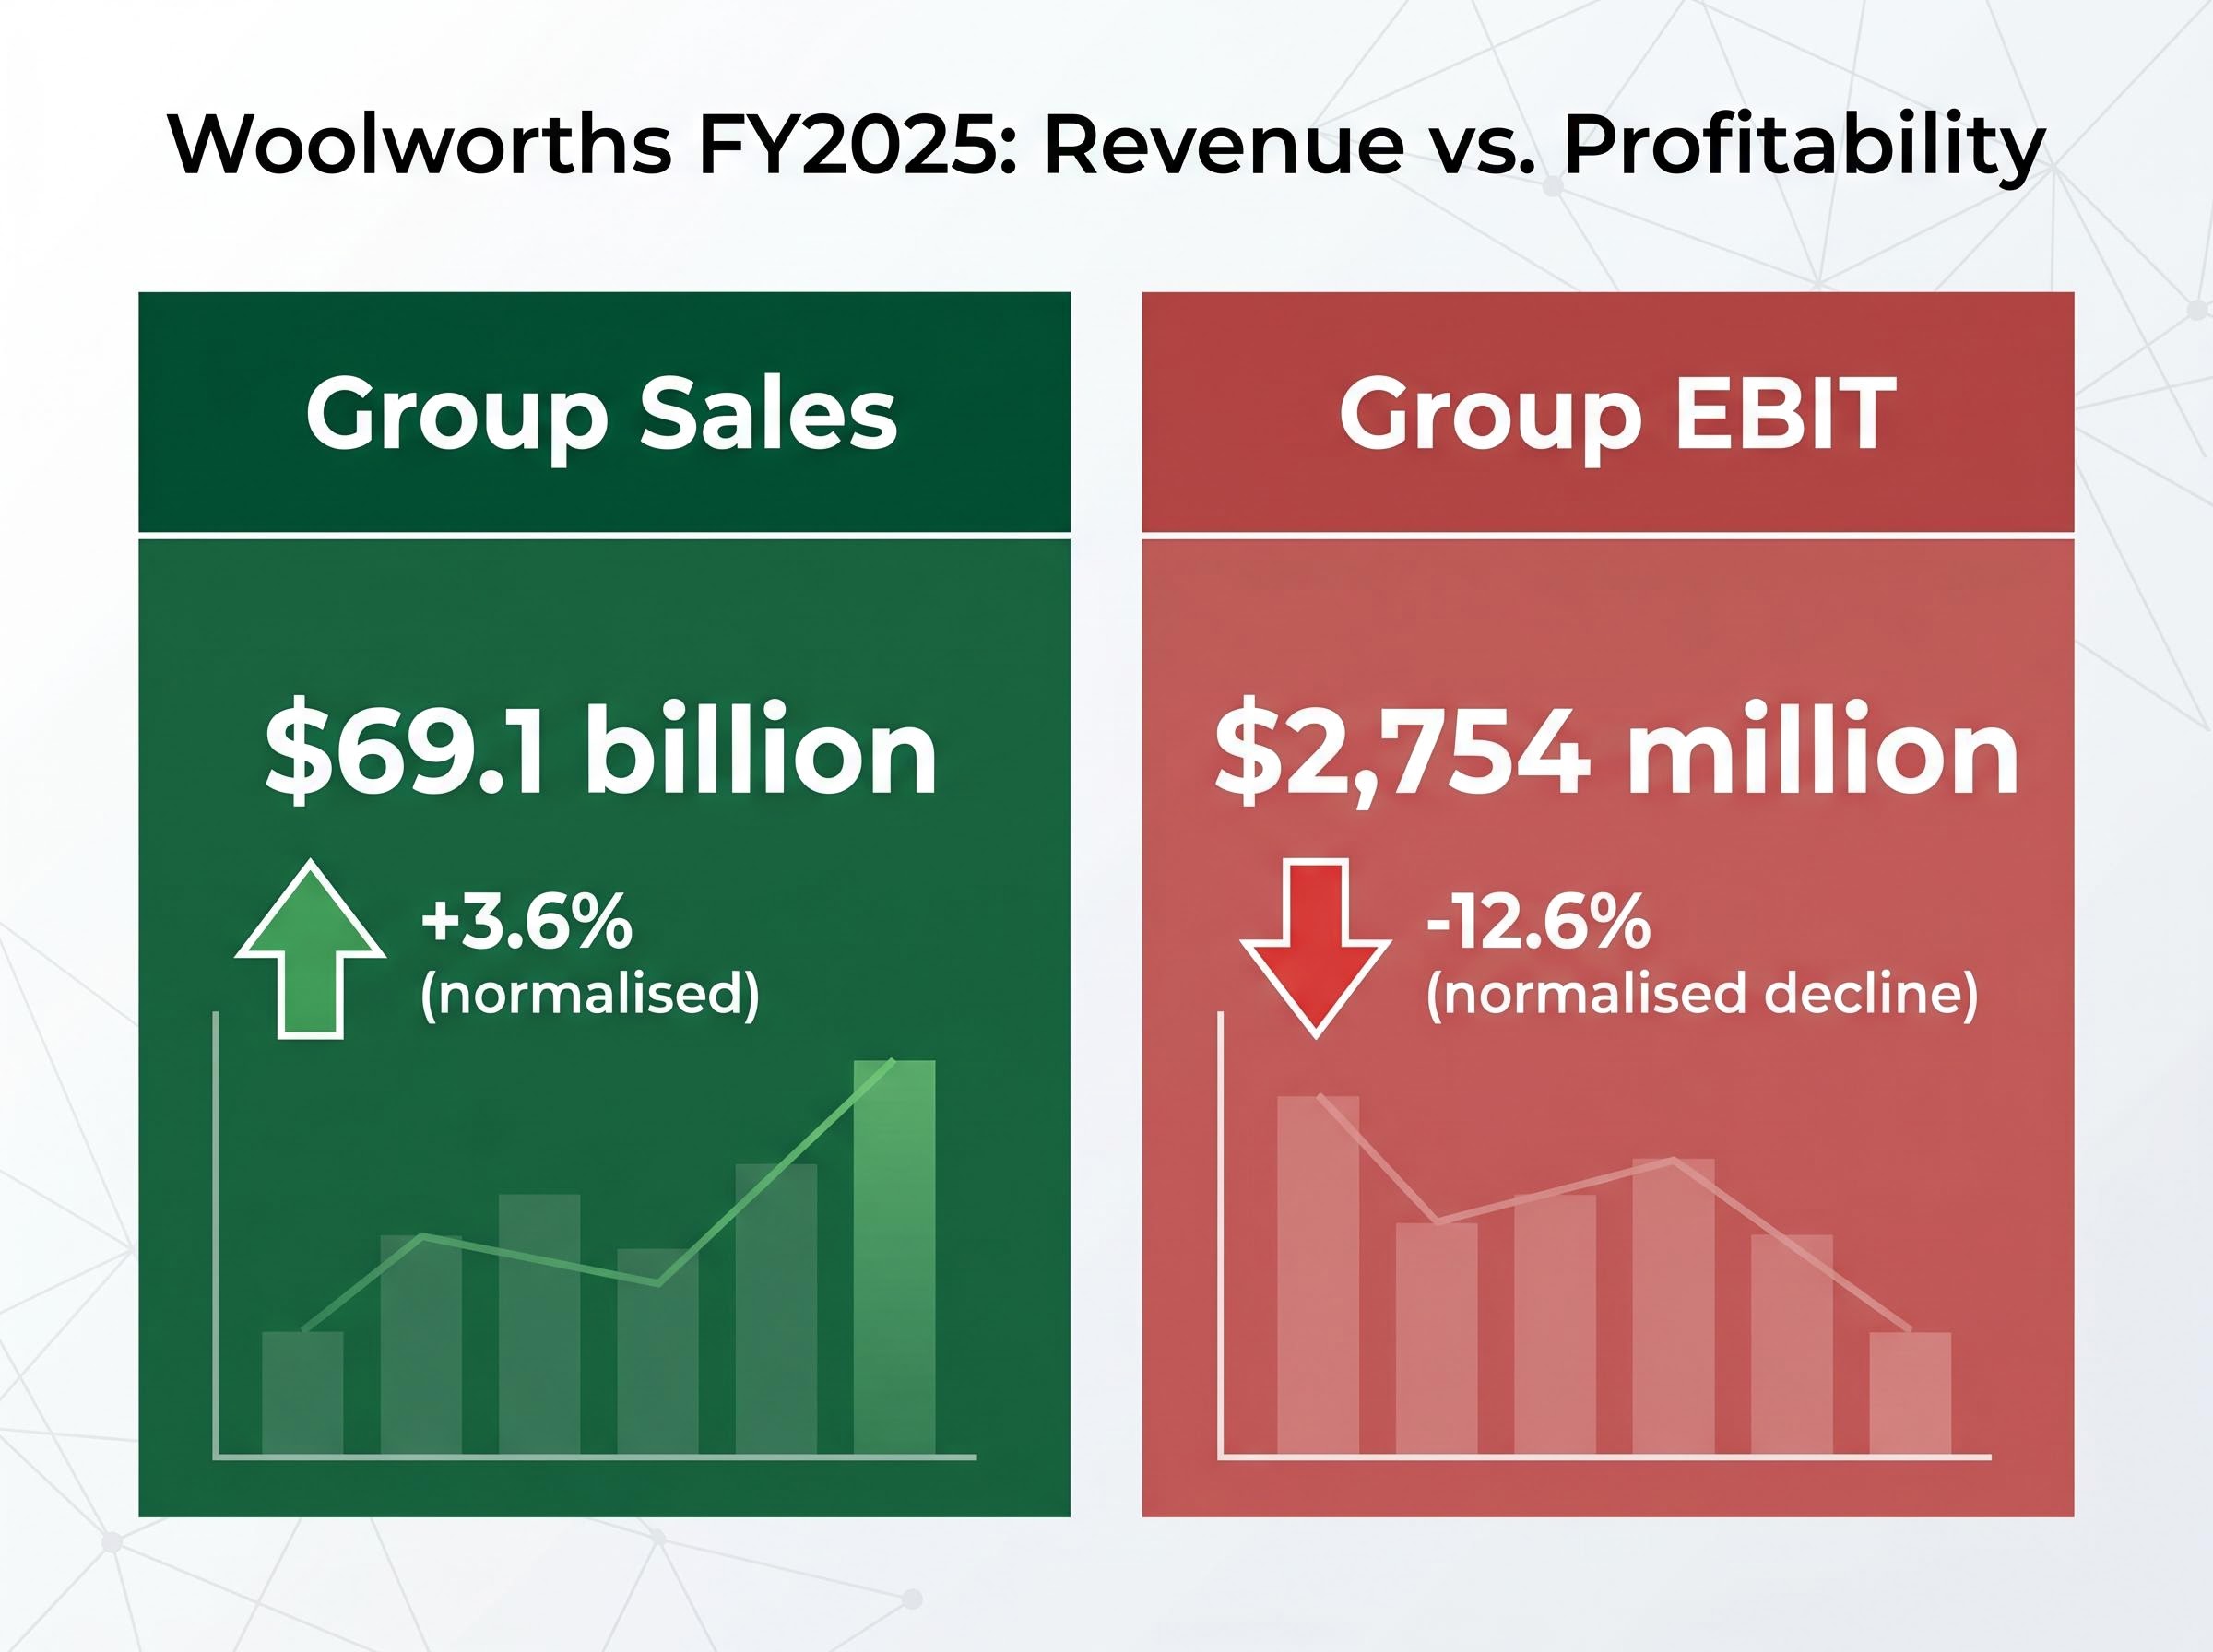
This was not a story of one company collapsing. Woolworths posted Group sales of $69.1 billion in FY2025, up 3.6% on a normalised basis. Revenue held up. Profitability did not.
Woolworths’ FY2025 Group EBIT came in at $2,754 million, a normalised decline of 12.6%.
Three factors drove the underperformance that opened the gap:
- A 12.6% normalised decline in Group EBIT, reflecting cost pressures that revenue growth could not offset
- Operational disruptions across the Australian Food segment that compressed margins through the second half
- Rising input and labour costs at a pace that outstripped pricing adjustments
Coles, by contrast, delivered comparatively stable results over the same period, giving the market little reason to reprice the stock downward. The divergence reflected genuine earnings differences, not sentiment alone. Understanding that distinction is where any serious comparison of these two stocks begins.
When big ASX news breaks, our subscribers know first
What relative valuation actually means in a duopoly context
A stock trading at a lower price than its competitor is not necessarily cheaper. Price alone tells an investor almost nothing. What matters is the price paid for each dollar of earnings the company generates, and the tool that captures this relationship is the price-to-earnings ratio, or P/E.
What P/E tells you
P/E measures how many years of current earnings the market is paying for a stock today. A company trading at a P/E of 28x is being valued at 28 years of its current annual earnings. A higher P/E reflects the market’s confidence that earnings will grow, or that the earnings stream is more reliable and less likely to deteriorate.
As of May 2026, Coles traded at a trailing P/E of approximately 28.15-28.39. That number represents what investors were willing to pay for each dollar of Coles earnings. Woolworths’ equivalent P/E figure was not independently confirmed in available research for this article, a gap that limits direct numerical comparison but does not prevent the analytical framework from being applied.
Why duopoly comparisons are particularly revealing
When two companies compete in the same market and face the same macroeconomic conditions, a large P/E gap cannot be attributed to sector effects alone. Both stocks carry the same consumer spending exposure, the same regulatory environment, and the same competitive dynamics. A persistent premium for one over the other tells investors the market sees a meaningful difference in earnings quality, growth trajectory, or operational risk.
| What P/E measures | What a premium P/E signals |
|---|---|
| Price paid per dollar of earnings | Higher expected earnings quality or consistency |
| Market confidence in future earnings growth | Stronger growth expectations relative to peers |
| Implied risk assessment of the earnings stream | Lower perceived operational or competitive risk |
This makes the COL versus WOW comparison a cleaner analytical case than most ASX sector pairings, where different end markets and customer bases introduce noise that obscures the signal.
Sector-adjusted PE valuation, which benchmarks a company’s earnings multiple against its direct peers rather than against the broader market, is particularly powerful in duopoly contexts because it isolates genuine earnings quality differences from the sector-wide conditions both companies share.
The half-year results that started to reshape the narrative
Eight months after the September divergence peak, both companies reported half-year results within two days of each other in February 2026. The numbers offered the first hard test of whether the market’s pricing had been prescient or excessive.
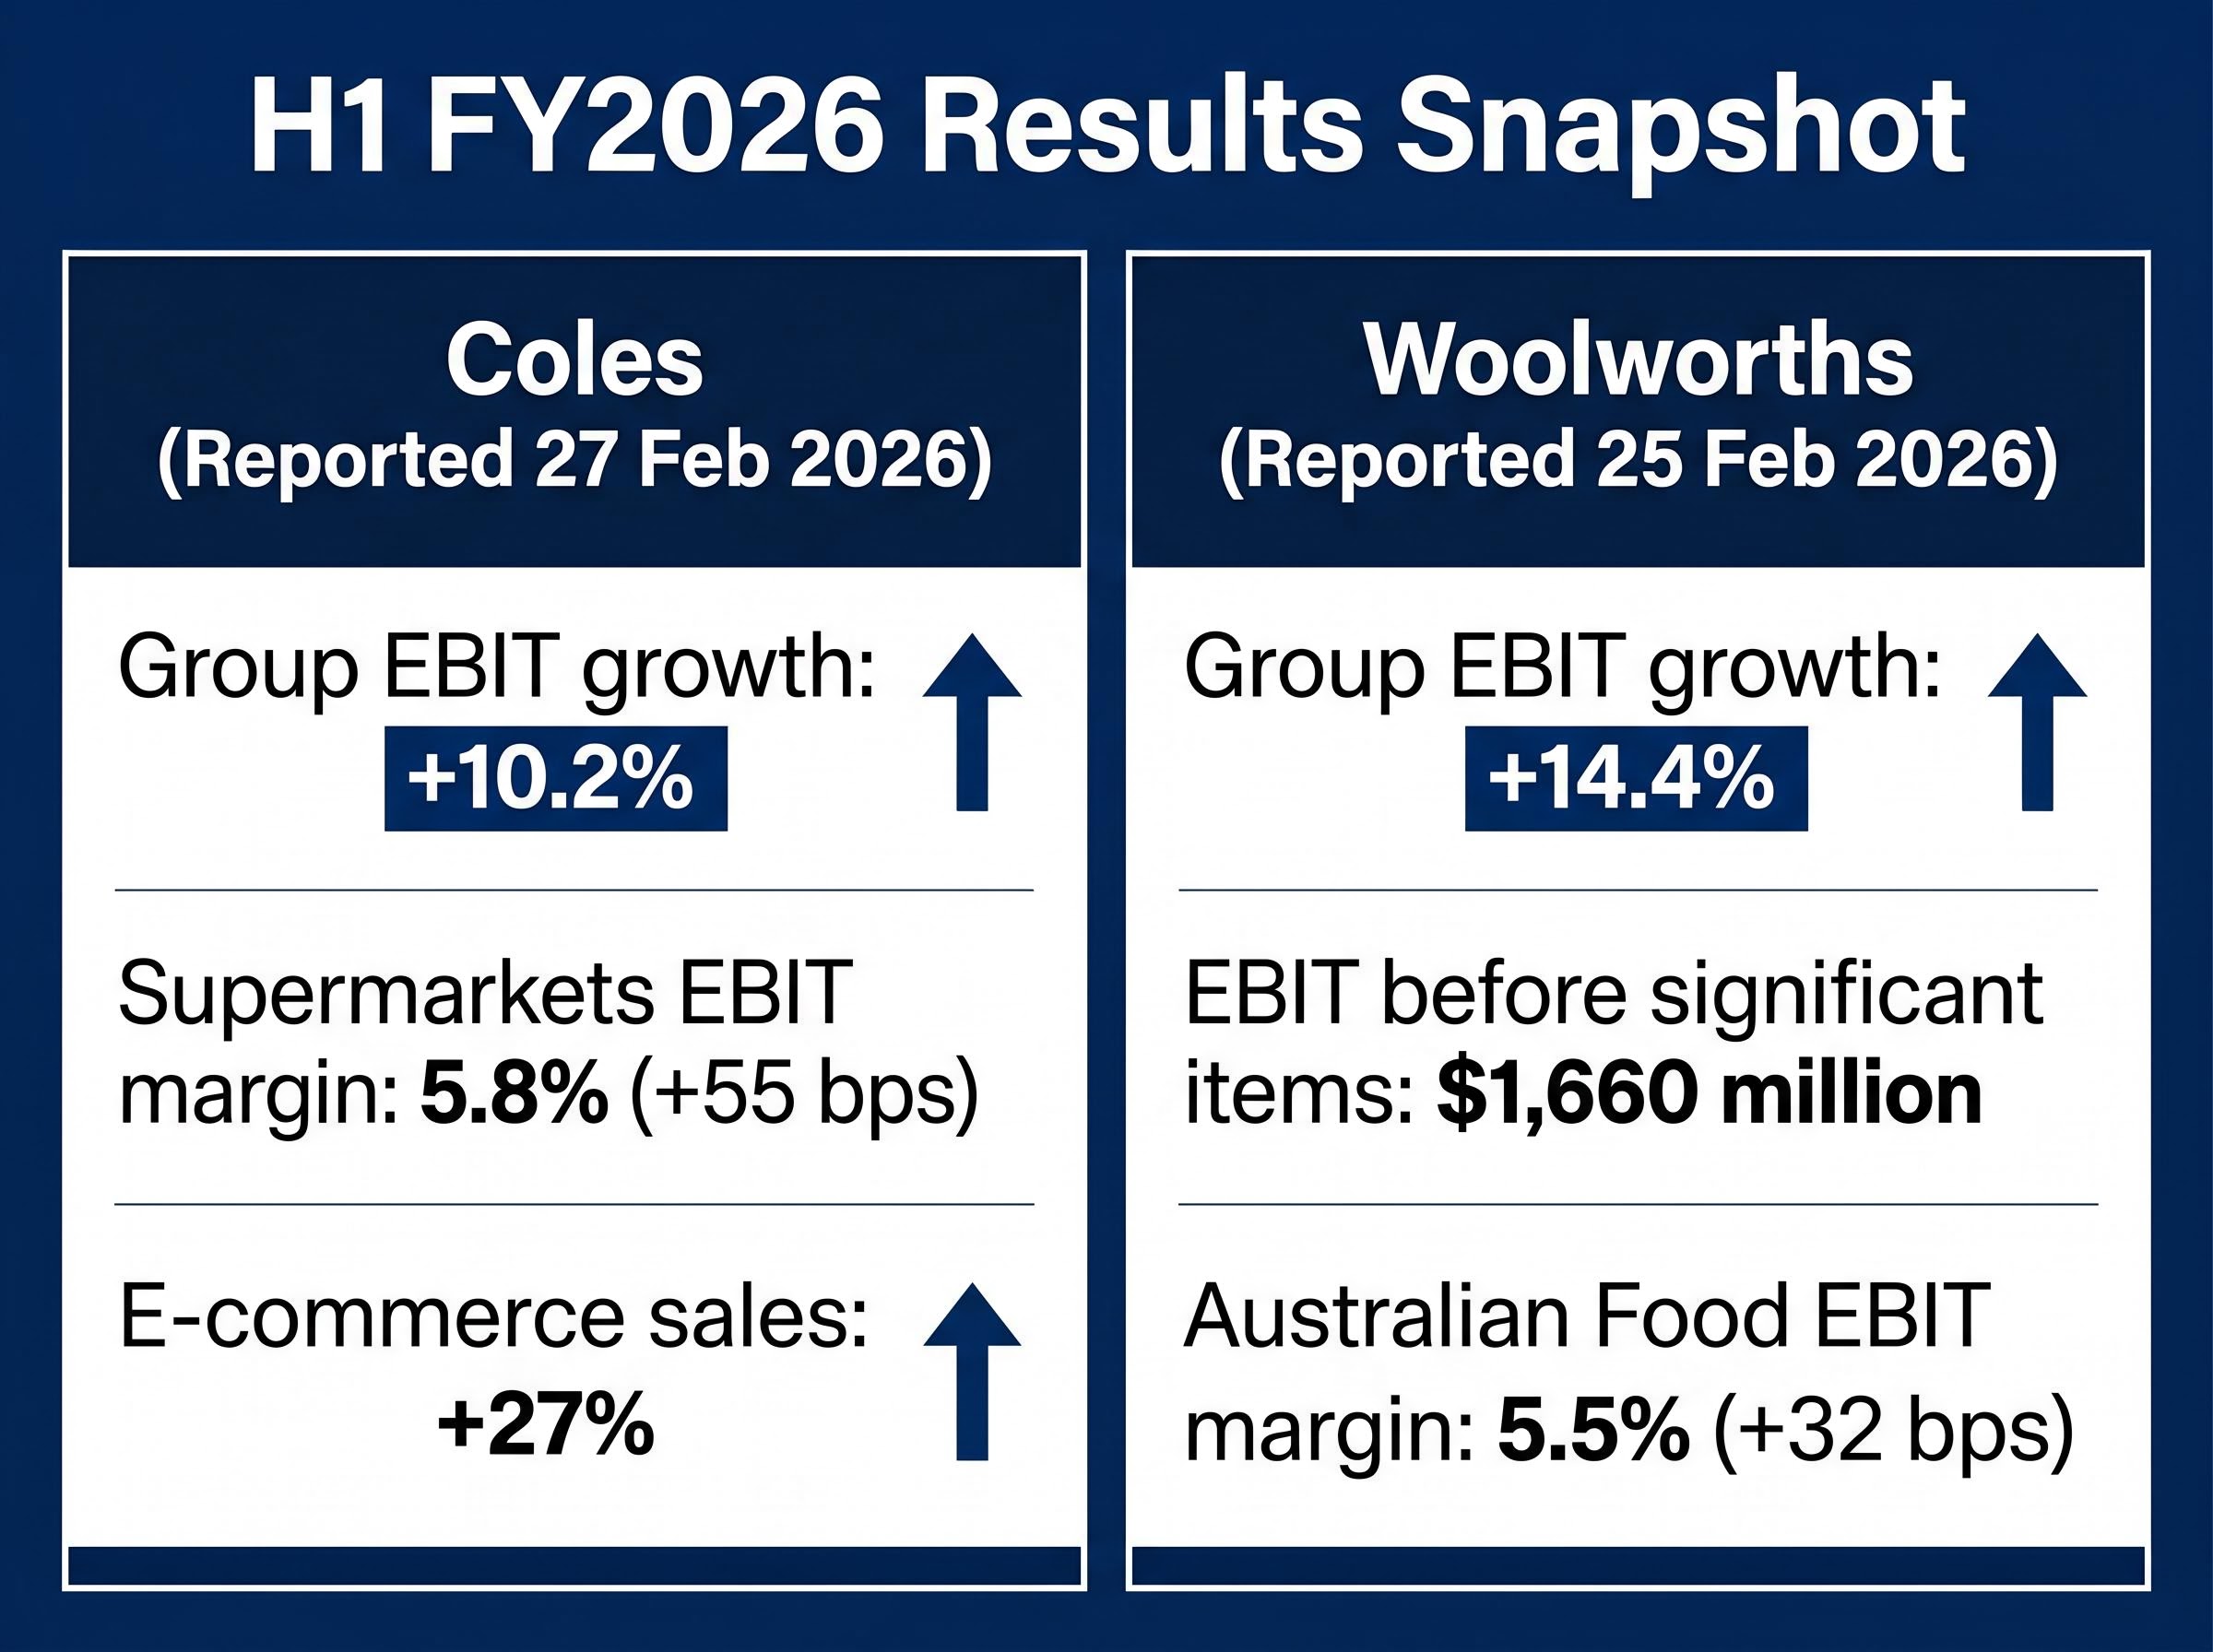
Coles reported H1 FY2026 results on 27 February 2026 that confirmed operational momentum across its core business. Group sales revenue rose 2.5% to $23.6 billion. Group EBIT climbed 10.2%, with EBITDA up 7.8%. The supermarkets division delivered the strongest signal: EBIT grew 14.6%, with margin expansion of 55 basis points to 5.8%. E-commerce sales accelerated 27%.
Woolworths reported two days earlier, on 25 February 2026. Group EBIT before significant items reached $1,660 million, up 14.4%. Australian Food EBIT margin expanded 32 basis points to 5.5%. The numbers represented a meaningful rebound from the FY2025 trough, though they positioned the recovery as partial rather than complete.
| Metric | Coles H1 FY2026 | Woolworths H1 FY2026 |
|---|---|---|
| Group EBIT growth | +10.2% | +14.4% |
| Supermarkets / Australian Food EBIT margin | 5.8% (+55 bps) | 5.5% (+32 bps) |
| Key growth driver | E-commerce sales +27% | EBIT recovery from FY2025 trough |
Woolworths’ EBIT growth rate actually exceeded Coles’ in percentage terms for the half. Yet the starting bases were different: Coles was building on stable profitability, while Woolworths was rebounding from a depressed base. That distinction shapes how investors should read the numbers, and it is the difference between momentum and recovery.
Woolworths earnings quality is harder to assess from headline revenue figures alone: the company’s debt-to-equity ratio stood at 300.2% and return on equity at just 1.9% in the period covered by the deep analysis, structural details that sit beneath the EBIT recovery narrative and shape how much weight investors should place on the margin rebound.
Mean reversion and why multi-year lows attract investor attention
When a stock trades near a multi-year low, a particular kind of investor attention follows. The instinct is straightforward: markets overcorrect, and a beaten-down price in a stable sector should eventually drift back toward historical norms. That instinct has a name: mean reversion.
Mean reversion, in the context of share prices, describes the tendency for a stock’s valuation multiple to move back toward its own historical average and toward its sector peers over time. It is an observable pattern in financial markets, but it comes with conditions. It is not a guarantee that cheap things become more expensive.
Woolworths traded at approximately $34.49-$34.68 in late May 2026, a recovery from the six-year low reached in September 2025. Coles sat at approximately $21.33-$21.47 over the same period. The partial recovery in Woolworths’ EBIT (up 14.4% in H1 FY2026) provides evidence that at least some of the operational disruption was temporary, which is a necessary condition for mean reversion to play out.
Before interpreting any multi-year low as a mean reversion opportunity, three conditions should be checked:
- Core earnings remain intact, meaning the business still generates profits from its primary operations
- The cause of the decline has been identified as temporary rather than structural, with evidence supporting that classification
- A comparison with sector peers confirms the stock is trading at a genuine discount, not being re-rated to a permanently lower multiple
A discounted price and a cheap price are not the same thing. A discount implies the stock will return to its prior valuation. A cheap price may simply reflect the market’s updated view of what the business is worth.
What the share prices as of May 2026 suggest about where the market has landed
The current prices represent the market’s working verdict. Coles closed at approximately $21.33 on 25 May 2026, carrying a P/E of roughly 28x. Woolworths traded at approximately $34.49-$34.68 in late May. The divergence that peaked in September 2025 has narrowed, but it has not closed.
A P/E of 28x for a grocery business is a premium that demands continued delivery. The assumptions embedded in that multiple include:
The ASX 200 earnings risk environment in mid-2026 provides important context for evaluating a 28x multiple on any individual stock: with the equity risk premium on the index compressed to approximately 80 basis points against a 5.1% ten-year bond yield, the margin of safety for premium-multiple businesses is historically thin if earnings disappoint.
- Continued margin expansion from the 5.8% supermarkets EBIT margin reported in H1 FY2026
- Sustained e-commerce growth at or near the 27% rate that drove the half-year result
- A stable competitive position against Woolworths, Aldi, and independent grocers
For Woolworths’ partial share price recovery to be sustained, a different set of conditions must hold:
- EBIT margin recovery must continue beyond the 5.5% Australian Food margin posted in H1 FY2026
- The operational disruptions that drove the FY2025 earnings decline must be demonstrably resolved
- The regulatory environment must remain stable, with no material new pressures on pricing or competition
Named broker price targets for mid-2026 were not available in the research base for this article. Investors seeking consensus forward estimates should consult primary sources including MarketIndex, Morningstar, ASX company filings, and broker research portals where access is available.
The duopoly divergence as a template for comparative stock analysis
The COL versus WOW case is specific, but the method used to analyse it is transferable. Four steps structured the analysis in this article, and they apply to any ASX sector where a similar divergence between peers appears:
- Identify the divergence: Pinpoint the moment when two comparable companies diverge in price performance and quantify the gap
- Understand the earnings basis: Determine whether the divergence reflects genuine differences in profitability, or sentiment disconnected from fundamentals
- Apply valuation concepts: Use P/E ratios and mean reversion frameworks to assess whether the market’s pricing is proportionate to the earnings evidence
- Assess current price against confirmed results: Anchor decisions to reported financials rather than price momentum or sentiment alone
Consumer staples duopolies are particularly well-suited to this approach because the shared market context reduces the number of variables that could explain the gap. When both companies sell to the same customers in the same economy, the analytical signal is cleaner.
ASX consumer staples returns over the five years to May 2026 averaged negative 1.57% per year, compared to 3.91% annually for the broader ASX 200, a gap that complicates the standard defensive-sector framing and makes the earnings trajectory of individual companies within the sector more consequential than the sector label itself.
Where to go for deeper data on COL and WOW
Serious investment decisions require data that goes beyond publicly available summaries. The ASX company announcements portal hosts all COL and WOW regulatory filings, including half-year and full-year result presentations. MarketIndex and Morningstar provide historical price series, P/E tracking, and broker consensus summaries. The AFR offers ongoing analytical coverage.
The ASX continuous disclosure obligations require listed entities like Coles and Woolworths to release material financial information to the market as soon as it becomes known, which is why half-year result presentations, EBIT figures, and margin disclosures appear simultaneously on the ASX announcements portal for all investors.
For the most granular forward estimates, broker research portals from firms such as Macquarie, UBS, Citi, and Morgan Stanley provide detailed models, though these typically require institutional or platform access.
One divergence, two lessons, and a market that has begun to answer the question
The September 2025 divergence between Coles and Woolworths reflected genuine earnings differences. The February 2026 results partially confirmed this: Coles’ supermarkets EBIT grew 14.6% with margins at 5.8%, evidence that the premium was being actively earned. Woolworths’ EBIT recovery of 14.4% was meaningful, but it came off a depressed base following a 12.6% normalised decline the prior year.
Whether the full valuation premium for Coles is justified remains a live question at approximately 28x earnings. That is the number investors must decide whether to accept for a grocery business, however well-run.
Two stocks in the same duopoly posted similar EBIT growth rates in the same half-year period, yet were still being priced at materially different multiples as of May 2026. That gap itself is the next question worth asking.
The analytical tools applied in this article (P/E comparison, mean reversion assessment, earnings quality evaluation) are the right ones to bring to this question and to comparable divergences across the ASX. The case will continue to evolve with each reporting season, and the framework will continue to apply.
This article is for informational purposes only and should not be considered financial advice. Investors should conduct their own research and consult with financial professionals before making investment decisions. Past performance does not guarantee future results.