What Social Media Stock Promotions Actually Do to Prices
1 hr ago

Cochlear Ltd generated a gross margin of approximately 75% in FY25, placing it above the ASX healthcare sector average and most global medtech peers. A high gross margin, however, does not tell a retail investor whether the stock is cheap, expensive, or worth researching further.
Australian retail investors are increasingly drawn to ASX healthcare and medtech names as long-term compounders. Yet the metrics that matter for a medical device business differ meaningfully from those used to assess banks, miners, or retailers. Without a structured analytical framework, it is easy to confuse a high-quality business with a well-priced investment.
Gross margin, ROE, and revenue CAGR are three of the five fundamental analysis metrics that form the core of any structured equity assessment; the others, earnings per share and the P/E ratio, connect company quality to the market price investors are being asked to pay.
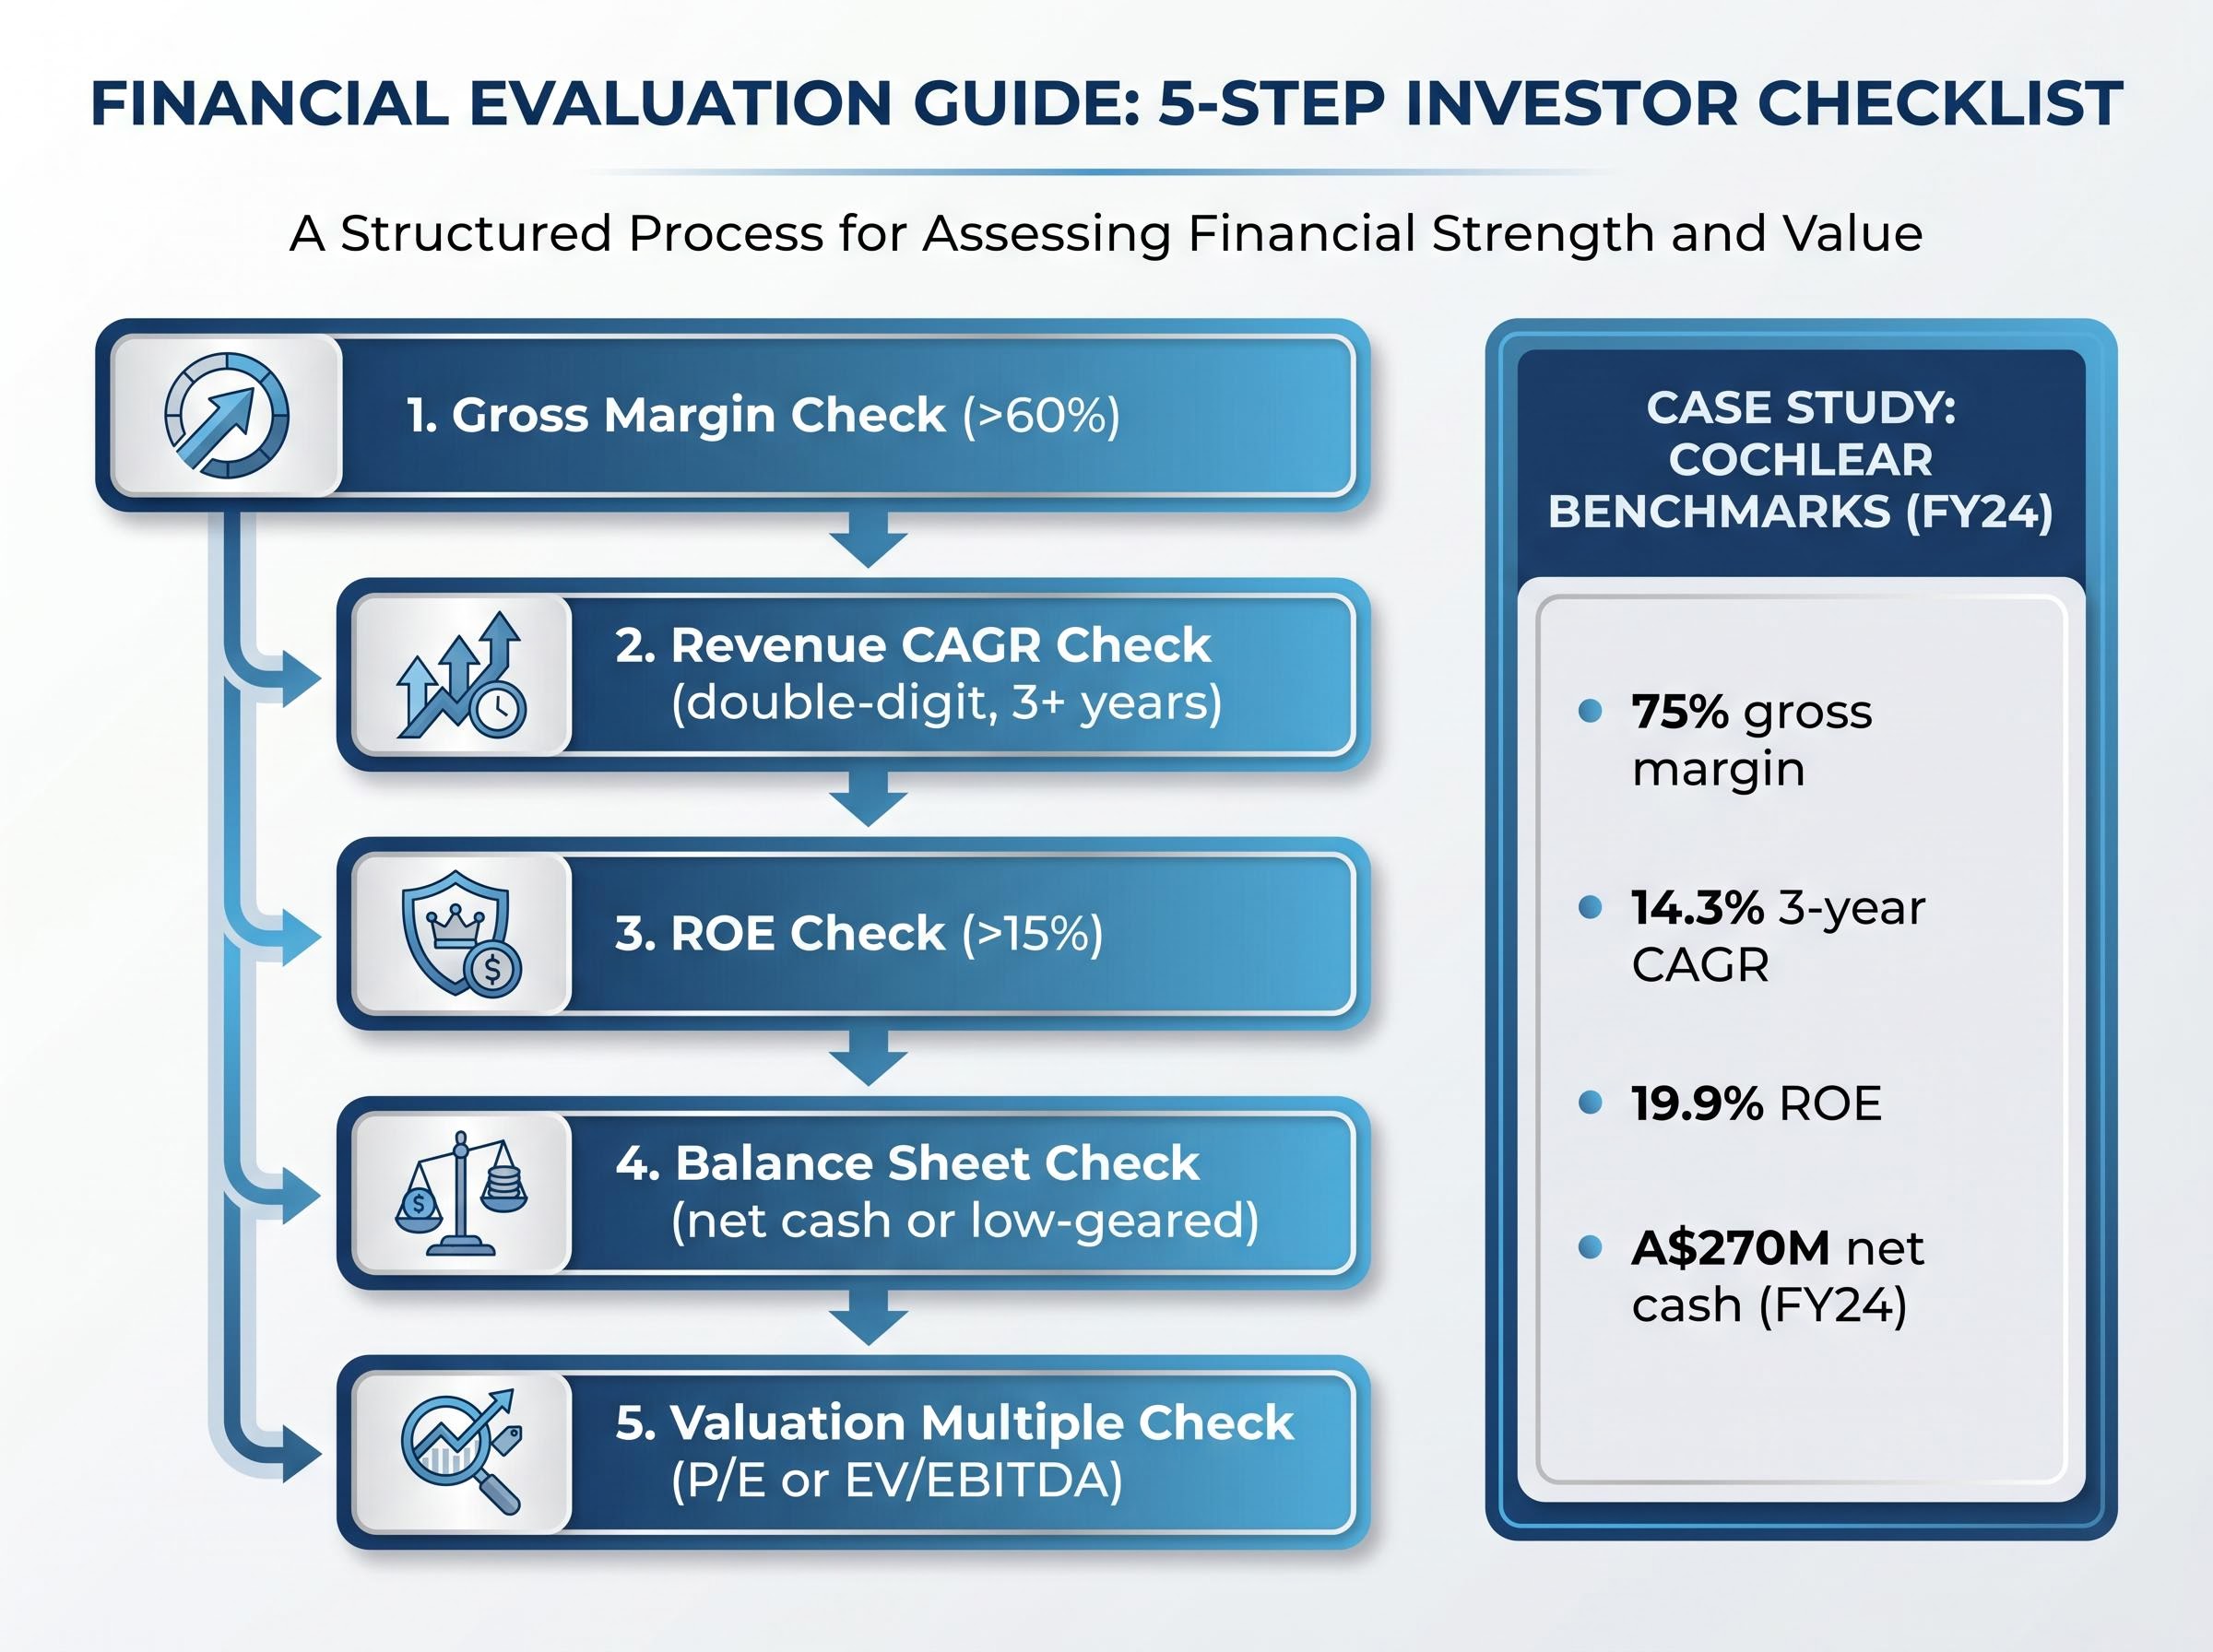
This guide uses Cochlear’s publicly reported financials as a practical teaching case, walking through five metrics that reveal a medical device company’s fundamental profile: gross margin, revenue compound annual growth rate (CAGR), return on equity (ROE), net debt positioning, and the step that separates company quality from share price valuation.
A bank earns a spread on deposits. A miner sells a commodity at a price it cannot control. A medical device company does neither. Its economics are shaped by a different set of forces, and applying a generic stock-analysis checklist will produce the wrong answers.
Medical device businesses share several defining characteristics:
Cochlear illustrates this directly. The company generates recurring revenue through sound processor upgrades and services, not just initial implant sales, a business model characteristic that distinguishes it from most ASX-listed industrials.
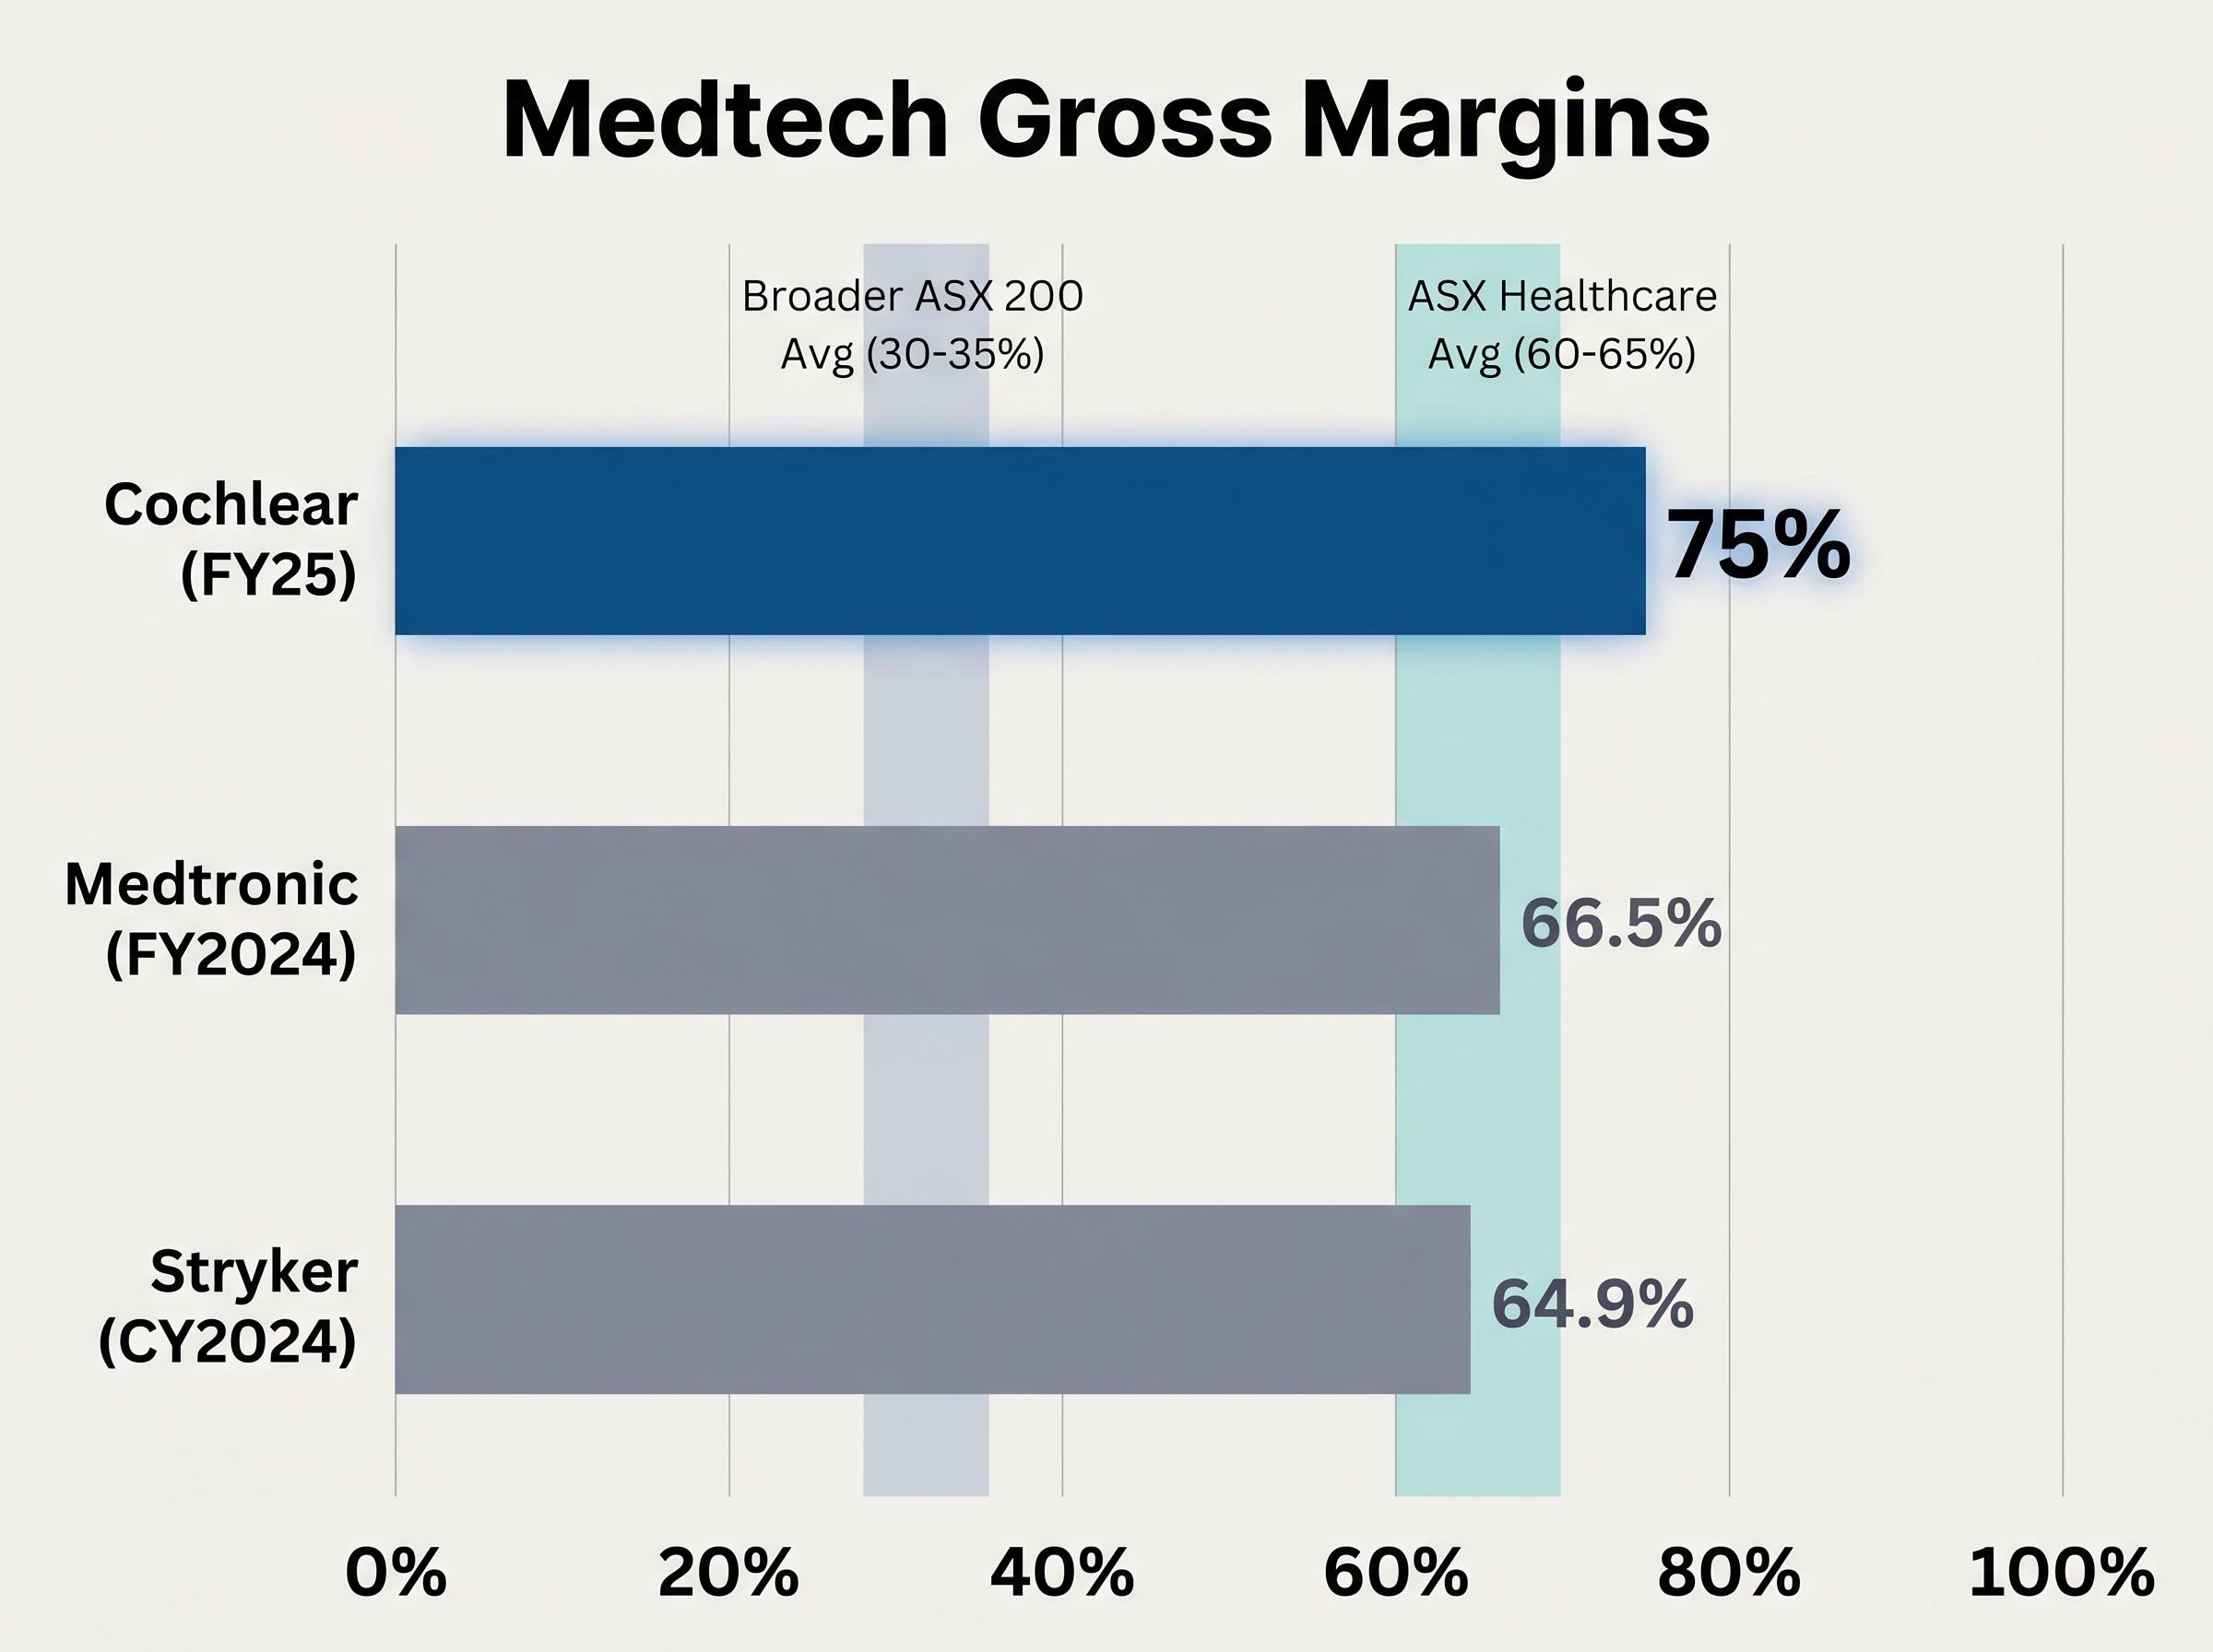
The financial contrast is stark. According to Goldman Sachs Australia (December 2024), the ASX healthcare sector (excluding biotech) carries average gross margins of approximately 60-65%, compared with roughly 30-35% for the broader ASX 200. That gap reflects the pricing power and cost structures unique to healthcare businesses.
Each business model characteristic maps to a specific financial metric. Pricing power shows up in gross margin. Durability of demand appears in revenue CAGR. Capital efficiency is captured by ROE. Financial resilience lives in the balance sheet. The sections that follow take each in turn.
Gross margin measures how much revenue remains after subtracting the direct cost of producing a product. The formula is straightforward: revenue minus cost of goods sold, divided by revenue, expressed as a percentage. It captures pricing power and production efficiency before operating costs such as R&D, sales, and administration are considered.
Cochlear reported a gross margin of 74.9% in FY24 and 75% in FY25. That stability, within a tenth of a percentage point across two full fiscal years, signals consistent pricing discipline and cost control. The figure becomes more informative when placed alongside peers.
| Company | Gross Margin | Period |
|---|---|---|
| Cochlear | 74.9% / 75% | FY24 / FY25 |
| Medtronic | 66.5% | FY2024 |
| Stryker | 64.9% | CY2024 |
| CSL | 59.5% | FY24 |
| ResMed | 55.6% / 58.2% | FY24 / Q2 FY25 (non-GAAP) |
| ASX Healthcare Avg. | ~60-65% | FY24 |
Cochlear’s approximately 75% gross margin sits materially above the ASX healthcare sector average of 60-65% and above every listed global peer in this comparison. For a retail investor screening medtech names, this is the fastest single indicator of underlying pricing power.
A gross margin at this level implies Cochlear retains significant capacity to invest in R&D, absorb cost pressure from foreign exchange movements or supply chain disruption, and protect profitability during periods of softer implant procedure volumes. It is, in effect, a measure of the business’s room to manoeuvre.
A single year of strong revenue growth can reflect a favourable currency tailwind, a one-off product launch, or a post-pandemic recovery in procedure volumes. None of those signals durability. A three-year compound annual growth rate strips out the noise.
Cochlear reported revenue of A$2,236 million in FY24, representing 15% growth in constant currency terms. In FY25, revenue rose to A$2,356 million, a more modest 4% in reported terms (3% constant currency). The three-year revenue CAGR is estimated at approximately 14.3%, though this figure has not been independently confirmed.
That moderation from FY24 to FY25 warrants context. Services revenue softened in the first half as the company invested in its cloud platform, and procedure volume growth normalised after the strong post-COVID recovery in prior years. The question for investors is whether the long-term demand drivers remain intact.
The structural case rests on several factors that operate independently of any single year’s results:
The WHO World Hearing Report provides the primary epidemiological basis for hearing loss prevalence estimates, documenting that over 1.5 billion people globally live with some degree of hearing loss and projecting that number will rise to 2.5 billion by 2050 without intervention.
These demand drivers extend well beyond a single reporting period. For a stock trading on a premium multiple, sustained double-digit CAGR is part of the justification for paying above the market average.
Return on equity (ROE) measures how much net profit a company generates relative to the equity shareholders have invested. The formula is net profit divided by shareholders’ equity. A high ROE signals that management is generating strong returns without requiring disproportionate capital.
Cochlear reported ROE of 19.9% in FY24. Placed against peers, the figure sits comfortably in the upper range of both the ASX healthcare sector and global medtech comparisons.
| Company | ROE | Period |
|---|---|---|
| ResMed | ~23% (Morningstar est.) | TTM |
| Stryker | 21.5% | CY2024 |
| Cochlear | 19.9% | FY24 |
| CSL | 13.8% | FY24 |
| Medtronic | 11.2% | FY2024 |
| ASX Healthcare Avg. | ~15-20% | FY24 |
ROE becomes more meaningful when read alongside the balance sheet. Net debt is calculated as total borrowings minus cash. A negative figure means the company holds more cash than debt, a position of financial strength.
Cochlear held a net cash position of approximately A$270 million as at FY24, with a debt-to-equity ratio of just 13.2%. A net cash balance sheet for a growth-oriented medtech carries three practical implications:
Together, a 19.9% ROE and a net cash balance sheet tell a capital quality story: strong returns generated without excessive leverage.
The quality factor characteristics that define companies like Cochlear, high ROE, low leverage, and stable earnings, are not just useful for individual stock analysis; in the current macro environment, these same attributes are driving institutional interest in quality-screened ASX ETFs as a way to remain invested while managing downside risk in a potentially overvalued broader market.
Every metric examined so far assesses company quality. Gross margin, revenue CAGR, ROE, and balance sheet strength reveal what kind of business an investor is looking at. None of them reveal whether the current share price fairly reflects that quality.
This distinction is the most consequential conceptual shift in any analytical framework.
Valuation multiples provide a bridge between quality assessment and price assessment. For ASX medtech, the two most commonly referenced are the price-to-earnings (P/E) ratio and enterprise value to earnings before interest, tax, depreciation, and amortisation (EV/EBITDA). P/E compares the share price to annual earnings per share. EV/EBITDA compares the total enterprise value (market capitalisation plus net debt) to operating earnings.
According to Livewire Markets (February 2026), quality defensive healthcare names with high ROE and visible growth have historically traded on 25-30x earnings on the ASX. By early 2026, those multiples had compressed to closer to approximately 18x. Morgan Stanley commentary (September 2024) placed large-cap ASX medtech EV/EBITDA through the cycle at approximately 15-20x. The ASX healthcare sector has typically traded at a 20-40% premium to the broader market P/E.
Cochlear’s share price illustrates why the valuation step matters. Through 24 May 2026, the stock had declined approximately 62.63% year-to-date. The underlying business continued to generate a 75% gross margin, near-20% ROE, and a net cash balance sheet. The decline reflects a repricing of the multiple the market was willing to pay, not a collapse in business fundamentals.
The ASX healthcare sector de-rating over the five years to mid-2026 was driven primarily by the unwinding of COVID-era valuation distortions rather than any collapse in earnings, with institutional investors including AustralianSuper and Hostplus characterising the compression as a reset opportunity for global earners rather than a structural impairment.
A business can score well on all five metrics in this framework and still be overvalued at a given moment. Quality and price are separate questions.
The practical sequence for any investor evaluating an ASX medtech name is:
Past performance does not guarantee future results. Financial projections are subject to market conditions and various risk factors.
The framework taught through Cochlear’s financials is designed to be reusable. Applied as a sequential checklist, the five steps are:
For smaller or earlier-stage ASX medtech names, such as Polynovo or Nanosonics, the framework requires modification. According to Bell Potter commentary (via Livewire, May 2024), P/E is often uninformative during the scaling phase. EV/sales and EV/EBITDA trajectory become more relevant metrics until free cash flow turns positive and ROE exceeds approximately 15%. Cochlear’s estimated market share of around 48% in global cochlear implants (an unverified estimate that should be cross-checked) is an example of the oligopoly characteristic that supports premium multiples for established players, a feature most smaller names have yet to achieve.
For further reading on applying these concepts independently:
Cochlear’s financials offer a high-quality benchmark that retail investors can use to calibrate what “good” looks like in ASX medtech: a 75% gross margin, an estimated 14.3% three-year revenue CAGR, 19.9% ROE, and a net cash balance sheet. These are the markers of a structurally sound business.
The analytical process, however, does not end at quality assessment. The same framework applied across multiple names and over multiple reporting periods builds genuine sector literacy rather than a one-time opinion on a single stock.
As a practical exercise, consider applying this five-step checklist to one other ASX healthcare name. The gap between the quality the numbers reveal and the price the market currently assigns may be where the most useful insight sits.
Investors wanting to build a more complete toolkit beyond P/E and EV/EBITDA will find our full explainer on ASX share valuation methods, which walks through P/S ratios, discounted cash flow, EV/EBITDA, and the dividend discount model in a structured five-step sequence with worked examples drawn from listed ASX companies.
This article is for informational purposes only and should not be considered financial advice. Investors should conduct their own research and consult with financial professionals before making investment decisions.
Gross margin measures the percentage of revenue remaining after subtracting the direct cost of producing a product, and for healthcare stocks it signals pricing power and production efficiency. A high gross margin, like Cochlear's 75% in FY25, indicates a business can absorb cost pressures while still funding R&D and protecting profitability.
Revenue CAGR (compound annual growth rate) is calculated by taking the ending revenue, dividing it by the starting revenue, raising the result to the power of one divided by the number of years, and subtracting one. Using a three-year window smooths out one-off factors like currency tailwinds or post-pandemic procedure recovery spikes.
As a general benchmark, an ROE above 15% is considered strong for ASX healthcare companies, with the sector average sitting in the 15-20% range. Cochlear reported an ROE of 19.9% in FY24, placing it in the upper range of both ASX healthcare peers and global medtech comparisons.
Cochlear's share price declined approximately 62.63% year-to-date through 24 May 2026 due to a compression in the valuation multiple the market was willing to pay, not a collapse in earnings or margins. This illustrates the core distinction between company quality and share price valuation, two separate questions in any analytical framework.
For smaller or earlier-stage ASX medtech companies like Polynovo or Nanosonics, traditional P/E ratios are often uninformative during the scaling phase, making EV/sales and EV/EBITDA trajectory more relevant. The five-step framework covering gross margin, revenue CAGR, ROE, balance sheet strength, and valuation multiples still applies but should be weighted toward cash flow trajectory until free cash flow turns positive.