Is NAB’s Dividend Worth Buying at a 6.5% Grossed-Up Yield?
37 mins ago

Commonwealth Bank of Australia trades at approximately 29x earnings. The Australian banking sector average sits near 18x. Yet CBA remains one of the most widely held stocks in Australian self-managed super funds, a fixture of retirement portfolios from Sydney to Perth.
The gap between that valuation premium and that investor loyalty is not a contradiction. It is a tension worth understanding. Australian retail investors and SMSF trustees have treated the major banks as bedrock income holdings for decades, and the reasons extend well beyond habit. Fully franked dividends, perceived earnings stability, and a tax system that rewards domestic equity income all reinforce the pattern.
What follows is an analytical framework for assessing CBA’s share price valuation: why bank shares attract Australian income investors, how quantitative tools like price-to-earnings ratios and dividend discount models work when applied to CBA, what they reveal at current prices, and why even the most sophisticated model is only the first page of the research.
The appeal is not abstract. For a retiree drawing pension income from a self-managed super fund, a fully franked CBA dividend landing in the account every six months is not a theoretical preference. It is a cash flow event that funds living expenses, and one that comes with a tax credit attached.
The major banks, including CBA, ANZ, and Macquarie, remain among the most commonly held ASX shares by Australian retail investors and SMSF trustees, according to the Australian Financial Review. This is a deliberate income strategy built on three pillars:
“For many retirees, the big banks plus Telstra and the supermarkets still form the bedrock of an income portfolio.” — Financial planner, cited in Australian Financial Review (April 2024)
CBA’s most recent annualised dividend of approximately $4.85-$4.95 per share, fully franked, provides a concrete anchor for that income calculation. The question is whether investors buying at today’s price are paying too much for it.
Franking credits exist because Australian companies pay 30% corporate tax on their profits before distributing dividends. When a company like CBA pays a fully franked dividend, the shareholder receives a credit for the tax already paid at the corporate level. This avoids double taxation: once in the company’s hands, and again in the investor’s.
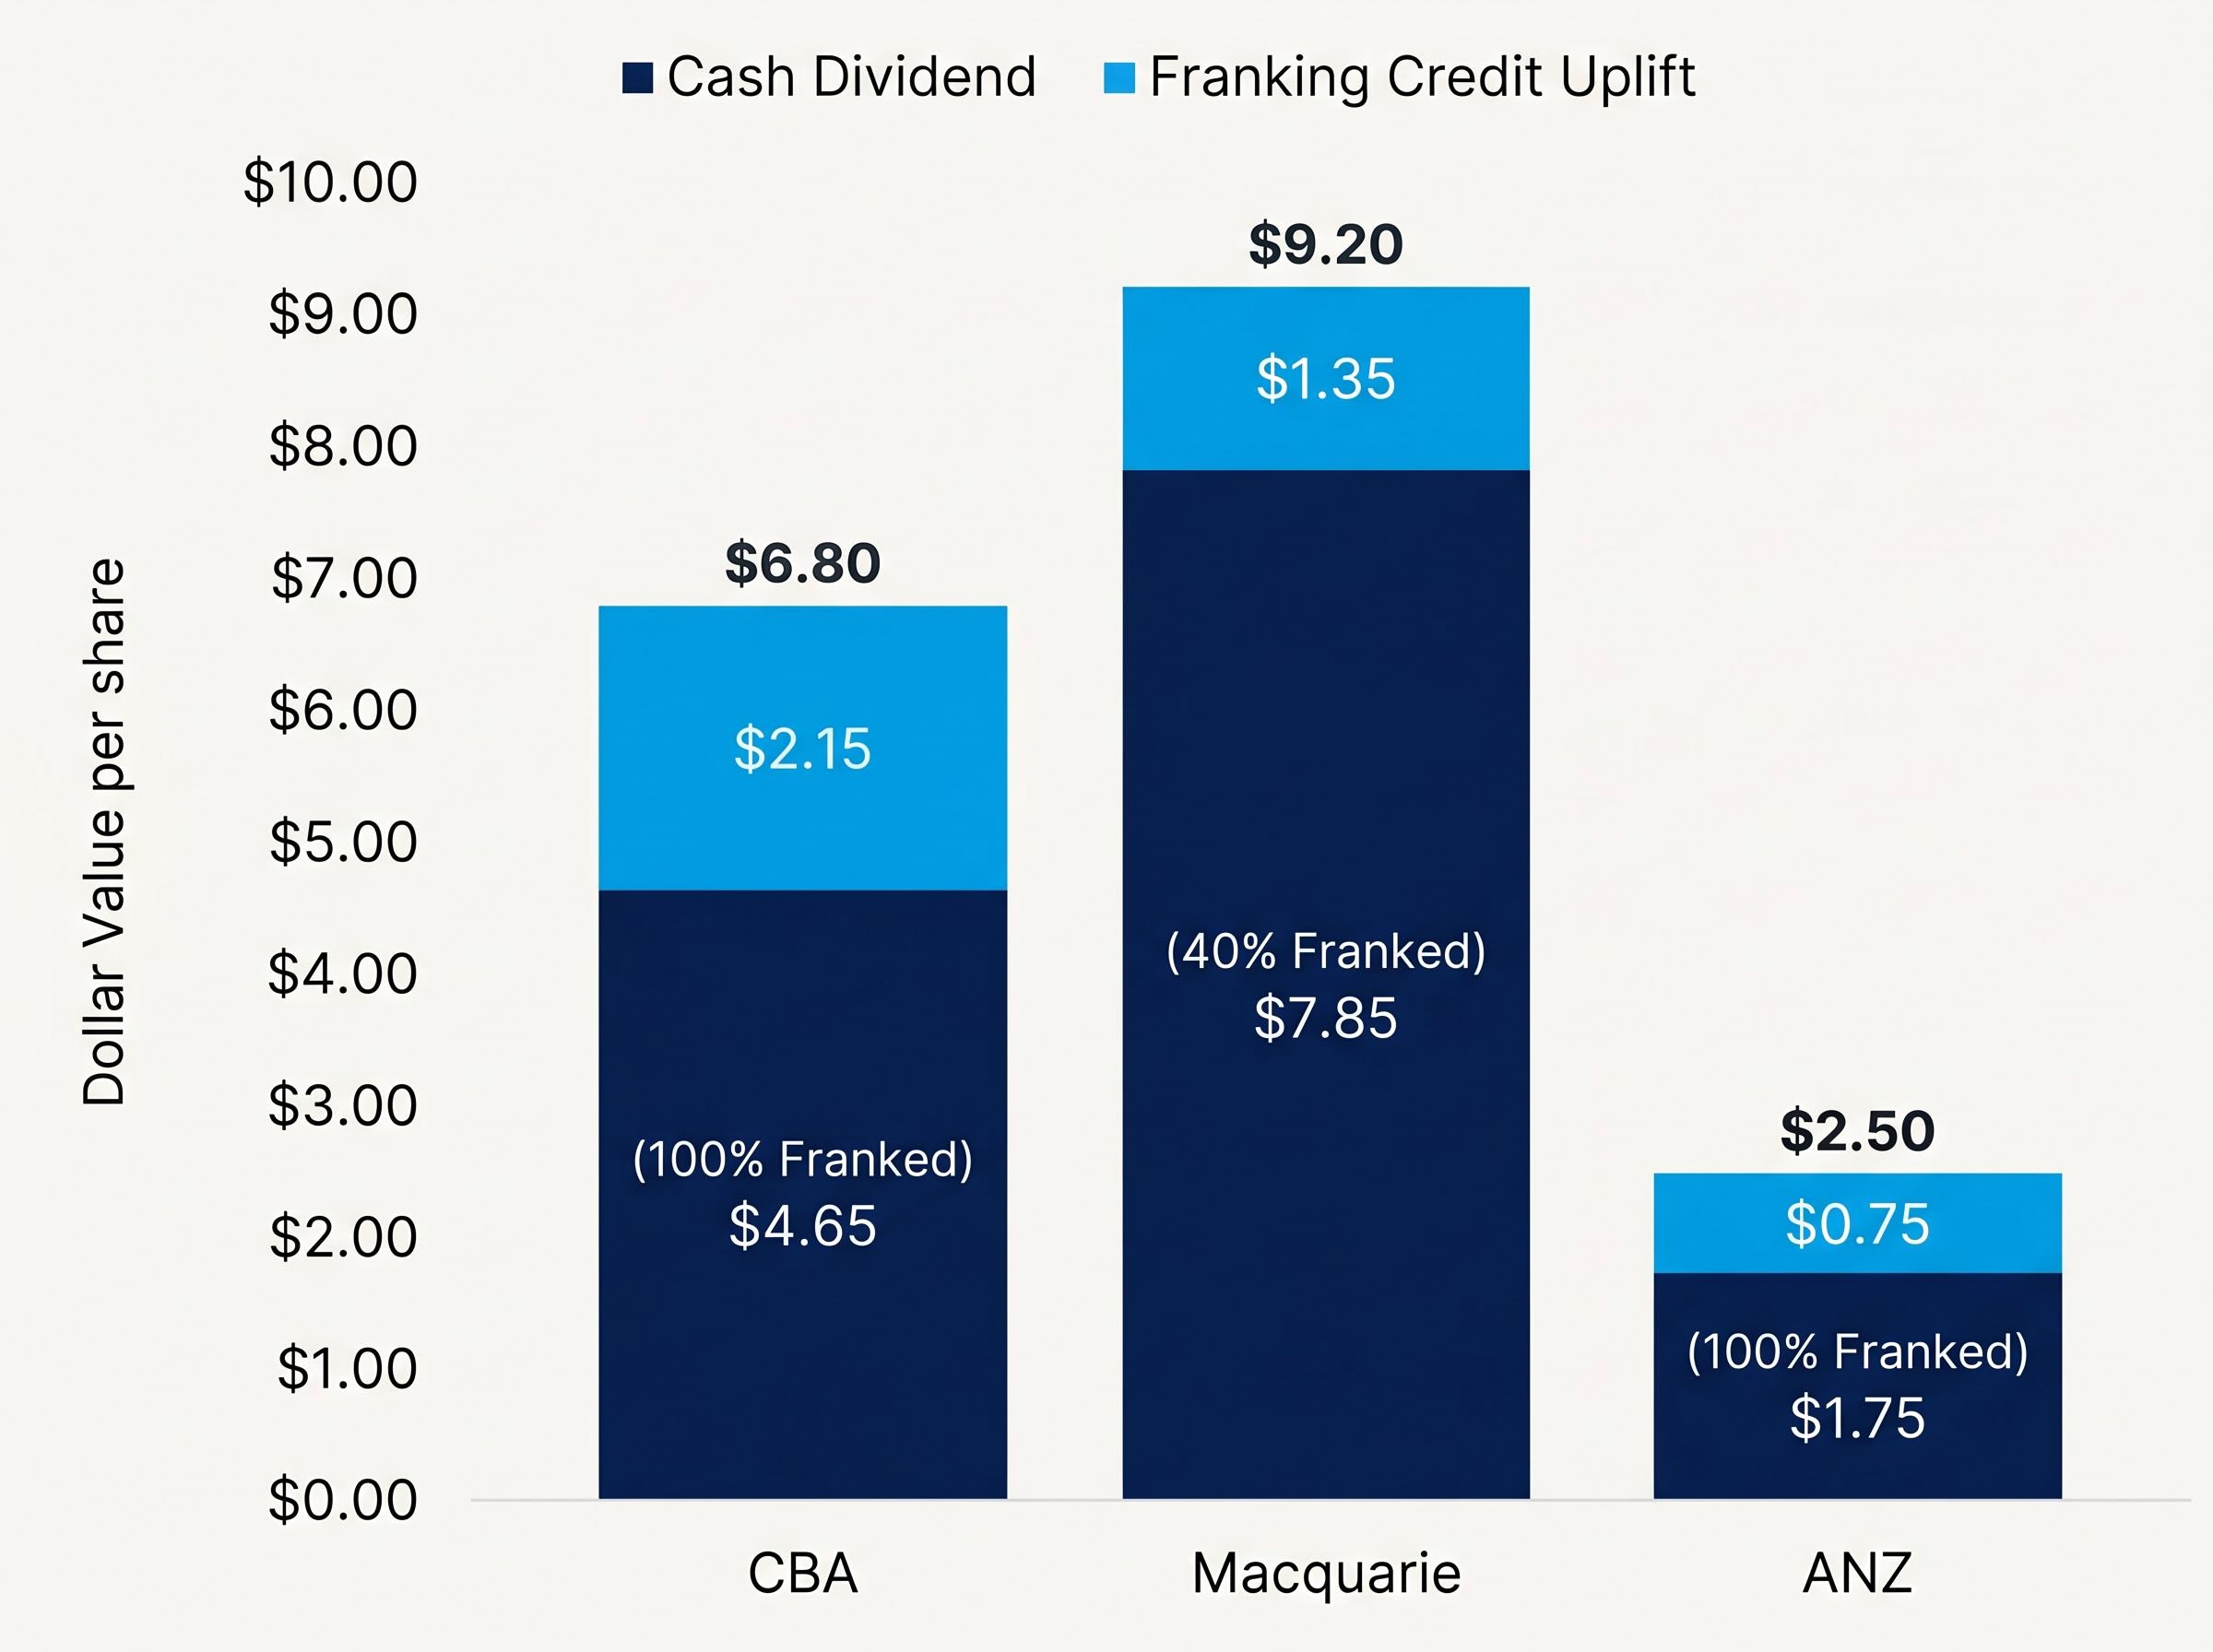
For an SMSF in pension phase, where the tax rate on income is 0%, the effect is pronounced. The fund receives the cash dividend and then claims a full refund of the franking credits from the Australian Taxation Office. A $4.65 cash dividend from CBA, fully franked, carries approximately $2.15 in franking credits, producing a grossed-up value of roughly $6.80. That grossed-up figure is what changes the after-tax yield comparison with term deposits, and it is also the figure that alters dividend discount model outputs (as explored later in this analysis).
Not all bank dividends are created equal. CBA and ANZ pay fully franked dividends. Macquarie franks at 40%, a distinction that materially reduces the tax offset for income-focused investors.
| Bank | FY24 Total Dividend (per share) | Franking Level | Approx. Grossed-Up Equivalent |
|---|---|---|---|
| CBA | $4.65 | 100% | $6.80 |
| ANZ | $1.75 | 100% | $2.50 |
| Macquarie | $7.85 | 40% | $9.20 |
NABtrade data has indicated that after-tax grossed-up yields from the major banks compare favourably with term deposits for SMSFs, reinforcing the structural income appeal.
Macquarie’s 40% franking rate means income investors receive a materially smaller tax offset per dollar of dividend than with fully franked bank dividends. For an SMSF trustee in pension phase, who can otherwise claim a full refund of franking credits, the difference is not marginal. It directly reduces the after-tax return and narrows the advantage that equity income holds over fixed-income alternatives.
A price-to-earnings ratio divides a company’s current share price by its earnings per share. The resulting multiple tells an investor how many dollars the market is willing to pay for each dollar of annual profit. A higher PE suggests the market expects stronger future growth, or assigns the company a quality premium, or both.
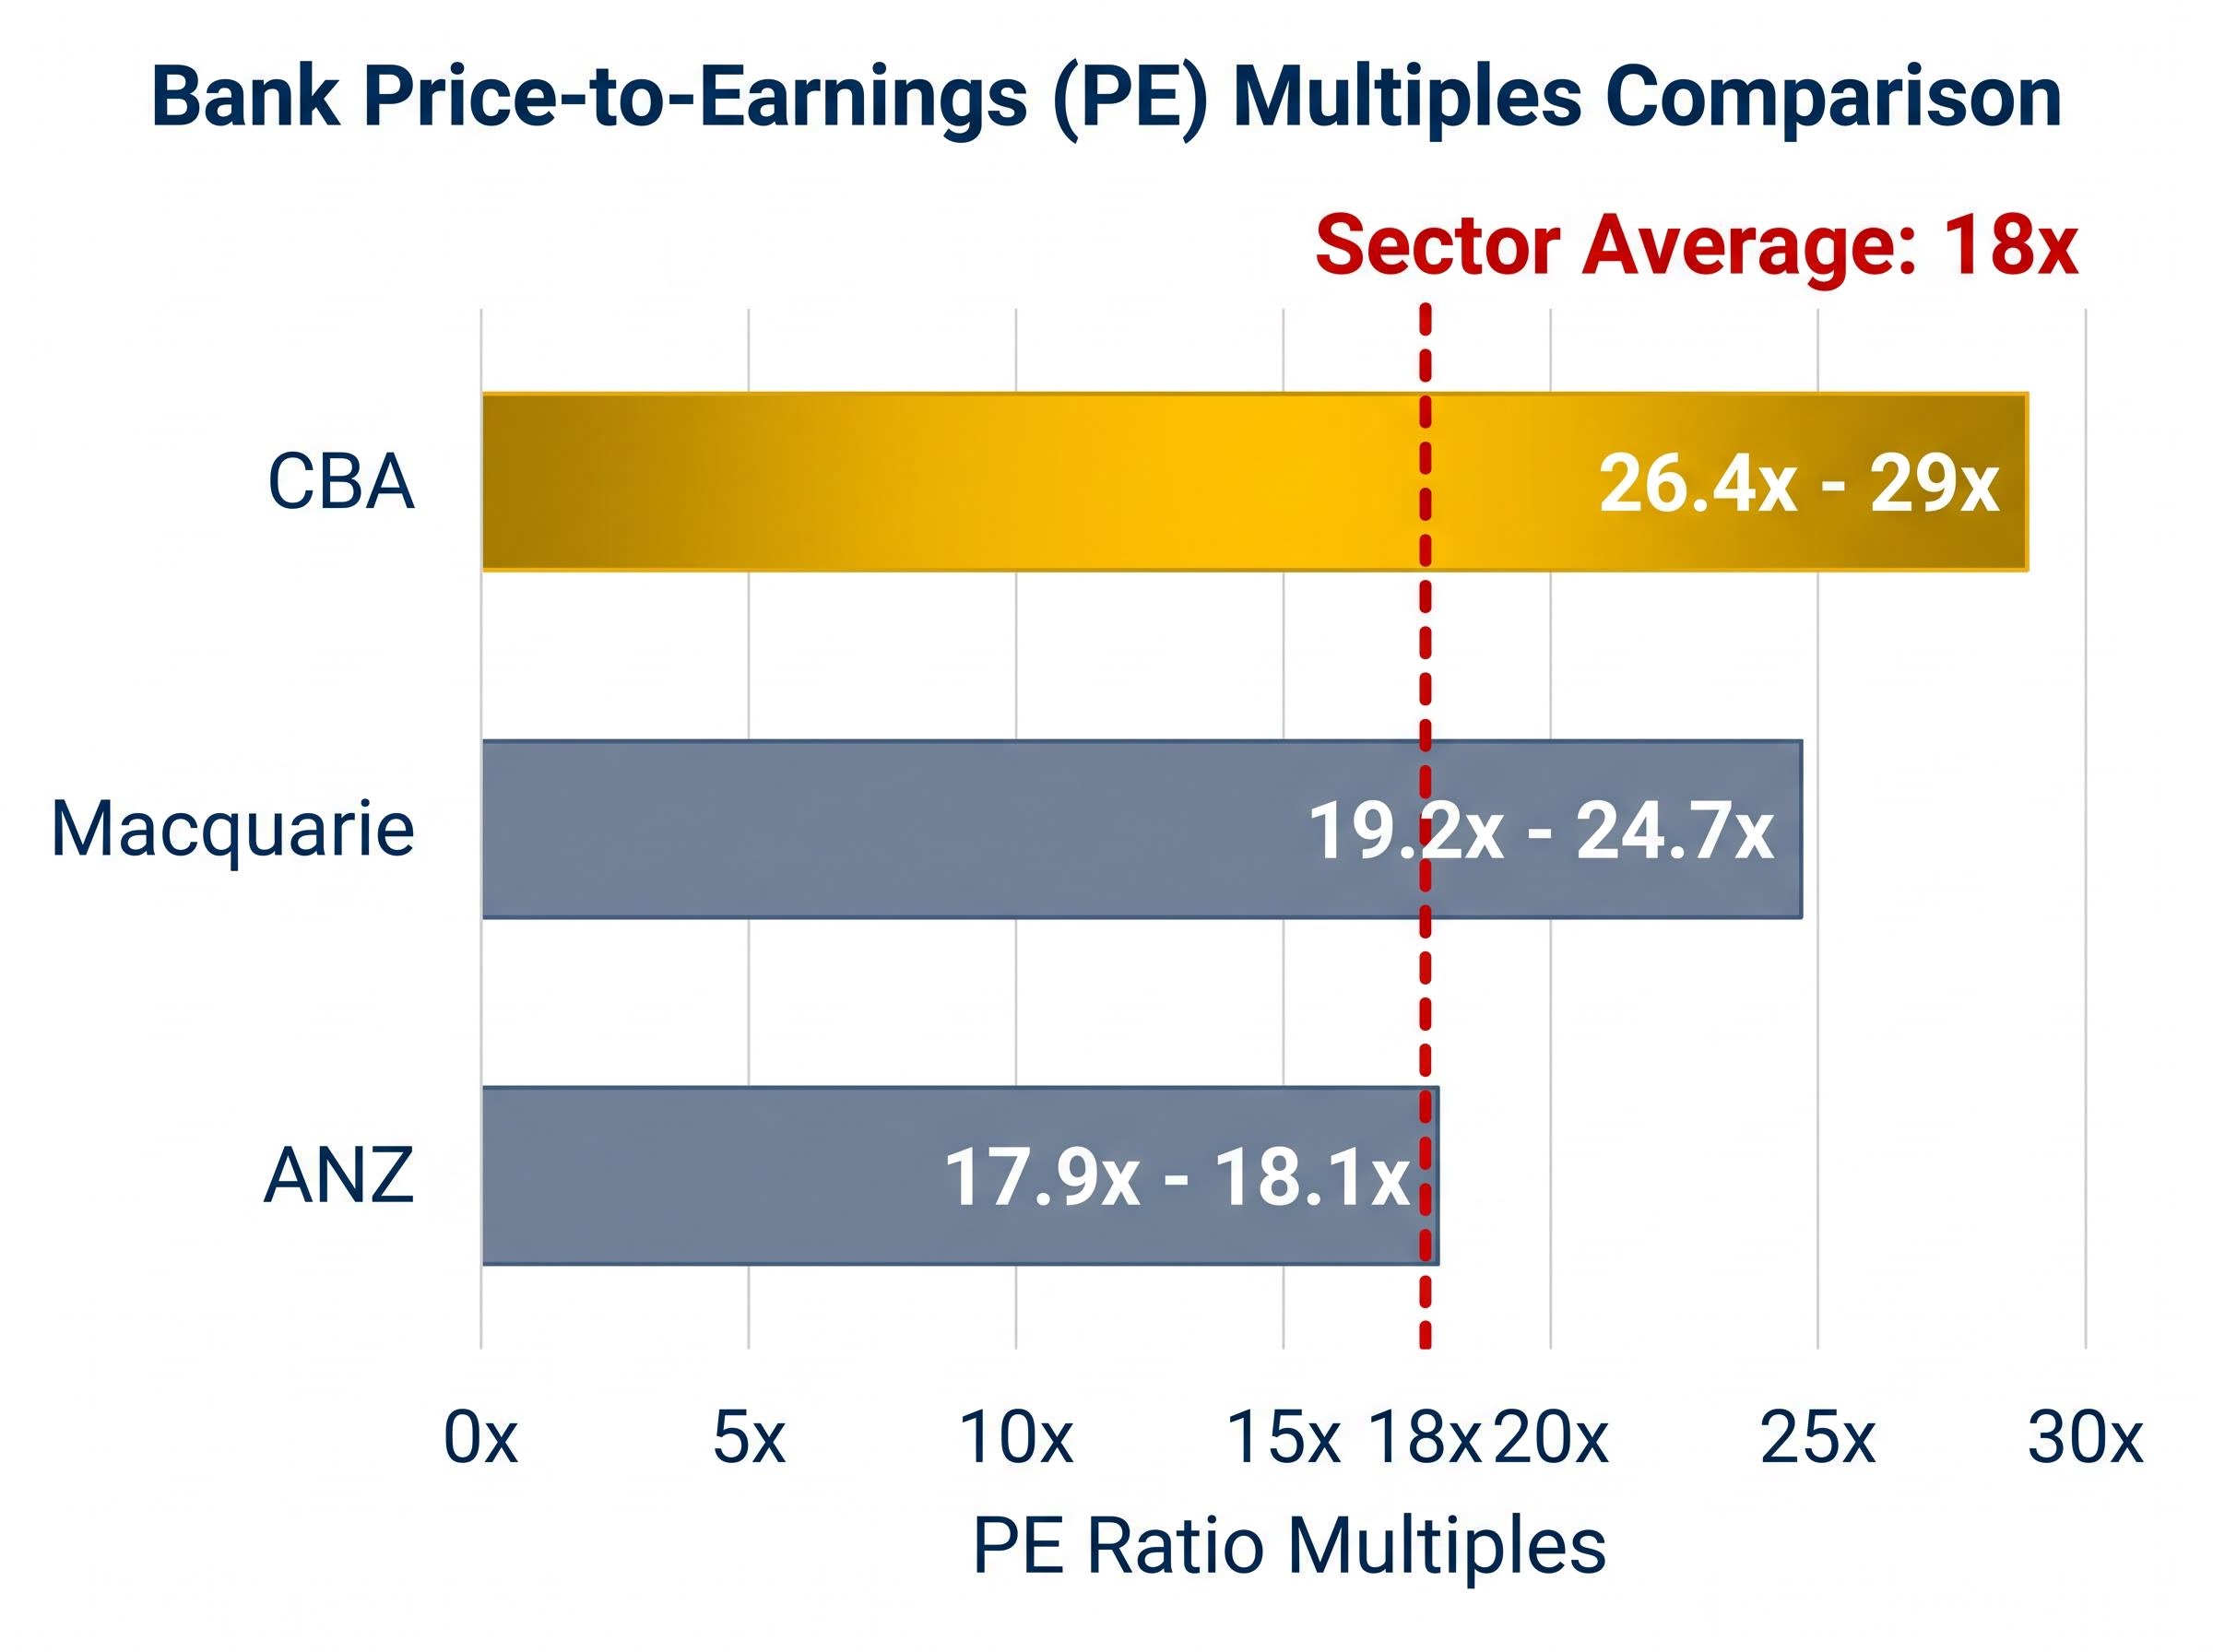
CBA’s share price sat at approximately $165.67 at the time of this analysis. Its FY24 earnings per share were $5.63, producing a calculated PE of 29.4x. More recent trailing PE estimates from GuruFocus and Yahoo Finance place the multiple at approximately 26.4-26.8x as of May 2026.
The Australian banking sector average PE is approximately 18x. At that multiple, CBA’s FY24 earnings would price the stock at roughly $102.50, some $63 below the current share price.
| Bank | Current Price (approx.) | Trailing PE | Sector Avg PE | Sector-Adjusted Value |
|---|---|---|---|---|
| CBA | $165.67 | 26.4-29x | 18x | $102.50 |
| ANZ | $35.30-$35.50 | 17.9-18.1x | 18x | Near current price |
| Macquarie | ~$240 | 19.2-24.7x | 18x | Modest premium |
In 2024 commentary, UBS and Morgan Stanley characterised CBA as “a hold at best” on valuation grounds, even when the stock traded at approximately 19-20x earnings. At 26-29x, those same concerns carry greater force.
A high PE does not automatically signal overvaluation. It encodes a market expectation: that CBA’s earnings will grow faster than peers, or that its quality premium will persist, or that the risk of holding the stock is lower. Whether that expectation is reasonable requires more than a single ratio.
The dividend discount model (DDM) values a stock as the present value of all its future dividends, discounted back to today. For banks, which pay consistent dividends, the DDM is the valuation methodology most directly suited to the business, much as it is used for real estate investment trusts.
The model requires three inputs:
Using CBA’s FY24 cash dividend of $4.65, the base DDM produces a valuation of $98.33. An adjusted figure using $4.76 yields $100.66. Once the grossed-up franking-adjusted dividend of $6.80 is applied, the output rises to $143.80, a figure that demonstrates how significantly franking credits alter the valuation picture for Australian-resident investors.
The model’s real value, however, lies in scenario analysis. Changing the growth rate and discount rate assumptions produces a wide range of outcomes:
| Discount Rate | Dividend Growth Rate | DDM Valuation |
|---|---|---|
| 11% | 2% | $52.89 (pessimistic) |
| 8% | 2% | $98.33 (base) |
| 7% | 3% | $119.00 (mid-point) |
| 8% | 3% (grossed-up) | $143.80 (franking-adjusted) |
| 6% | 4% | $238.00 (optimistic) |
The range spans from $52.89 to $238.00. That breadth is not a flaw in the model. It is an honest reflection of genuine uncertainty about future growth and risk. At approximately $165.67, CBA’s current market price sits within the upper half of this range, embedding assumptions closer to the optimistic end: low discount rates and above-average dividend growth sustained over the long term.
Thorough fundamental analysis of a major bank can require more than 100 hours of qualitative research before any valuation model is built.
That figure sounds extreme until the scope of the work is mapped out. A PE ratio takes seconds to calculate. A DDM can be constructed in a spreadsheet in an afternoon. The qualitative research that determines whether the inputs to those models are reasonable takes weeks.
Four macro variables form the structural pillars of that qualitative work:
Each connects to a specific earnings mechanism. Australian unemployment reached 4.5% in April 2026 (ABS Labour Force data, released 21 May 2026), a modest uptick from 4.3% the prior month. The RBA’s Financial Stability Review (October 2024) concluded that “most borrowers remain well placed to service their debts,” though that assessment was formed at lower unemployment than today’s figure.
| Macro Factor | Current Trend | Impact on Bank Earnings |
|---|---|---|
| House prices | Up approx. 6-7% (12 months to April 2025, CoreLogic) | Supports asset quality; reduces impairment risk |
| Unemployment | 4.5% (April 2026); slight uptick | Broadly supportive but softening; warrants arrears monitoring |
| Consumer sentiment | Below 100 (Westpac-Melbourne Institute, early 2025) | Constrains credit growth; limits revenue upside |
Livewire Markets analysis noted that subdued consumer confidence “caps volume growth,” forcing banks to rely on cost discipline and buybacks rather than credit expansion to grow earnings. That dynamic is directly relevant to whether CBA can deliver the dividend growth rates embedded in the upper end of its DDM range.
At approximately 26-29x earnings, with a DDM base case below $100 (rising to $143.80 on a grossed-up basis), CBA’s current price encodes a specific set of assumptions: that earnings growth will persist above peers, that the franchise quality premium will hold, and that discount rates will remain low.
Some of that optimism has analytical support. Fund managers at Hyperion Asset Management and Airlie Funds Management noted CBA’s leading return on equity, digital technology investment, and low arrears relative to peers as partial justifications for the premium. CBA’s FY25 profit rose approximately 4%, and dividends were increased accordingly.
AustralianSuper investment commentary (July 2024) described CBA as a core holding given its franchise strength, but observed that from prevailing valuations, returns were “likely to track earnings growth rather than rerating.”
Allan Gray Australia, via Firstlinks (October 2024): “A great bank, but on these multiples we see more upside in the cheaper majors.”
That preference for cheaper peers is a live debate, not a settled one. ANZ trades at approximately 17.9-18.1x earnings, roughly in line with the sector average, making it the value-oriented alternative for investors who want bank exposure at a lower entry multiple. All of the 2024 analyst commentary cited above was formed when CBA traded at 19-20x. At 26-29x, the same arguments carry amplified weight.
For CBA’s current multiple to hold over time, several conditions would need to persist:
PE ratios and dividend discount models are where serious analysis of an Australian bank begins. They are not where it ends. The quantitative tools provide a framework for measuring what the market is paying relative to what a company earns and distributes, and they reveal, clearly, that CBA trades at a substantial premium to peers and to its own historical range.
The franking credit advantage is real and structurally significant for Australian income investors, particularly in SMSF and pension-phase contexts. It changes both the after-tax income calculation and the DDM output. It does not, however, insulate investors against valuation risk at elevated entry prices.
The macro variables examined in this analysis, unemployment trends, residential property prices, consumer sentiment, and bank growth strategy, are not a one-time checklist. They are an ongoing monitoring framework. Each one feeds directly into the earnings assumptions that underpin CBA’s current multiple. If those assumptions hold, the premium may prove reasonable. If they deteriorate, the models will show it long before the share price does.
This article is for informational purposes only and should not be considered financial advice. Investors should conduct their own research and consult with financial professionals before making investment decisions. Past performance does not guarantee future results. Financial projections are subject to market conditions and various risk factors.
A dividend discount model (DDM) values a stock as the present value of all future dividends discounted back to today. Applied to CBA using its FY24 cash dividend of $4.65, the base DDM produces a valuation of around $98.33, rising to $143.80 when franking credits are factored in.
CBA trades at approximately 26-29x earnings versus a sector average of 18x because the market prices in a quality premium tied to its leading return on equity, digital investment, and franchise strength, though analysts at Allan Gray and AustralianSuper have noted that future returns are more likely to track earnings growth than further rerating.
For an SMSF in pension phase with a 0% tax rate, a fully franked CBA cash dividend of $4.65 carries approximately $2.15 in franking credits, producing a grossed-up value of roughly $6.80, which materially improves the after-tax yield comparison with term deposits or fixed-income alternatives.
The key macro variables are unemployment trends (which drive loan arrears), residential property prices (which affect collateral quality), consumer sentiment (which constrains credit demand), and bank growth strategy; Australian unemployment reached 4.5% in April 2026 and consumer sentiment remained below 100 in early 2025, both warranting ongoing monitoring.
ANZ trades at approximately 17.9-18.1x earnings, broadly in line with the sector average, making it the value-oriented alternative for investors who want major bank exposure at a lower entry multiple compared to CBA's current 26-29x premium.