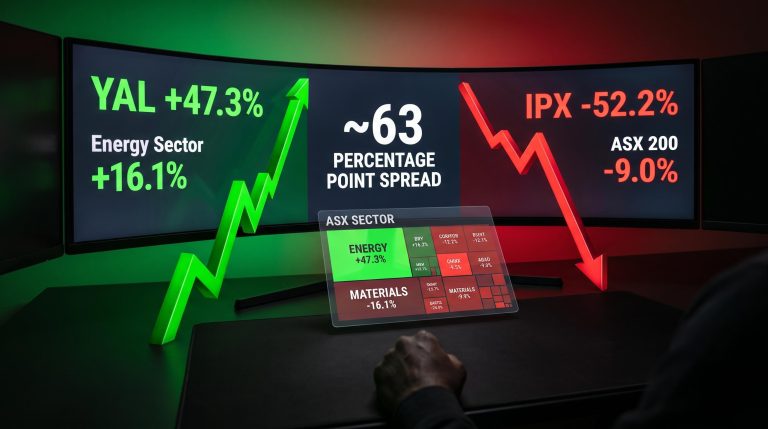
ASX’s 63-Point Spread: Winners and Losers in the Oil Shock
5 hrs ago
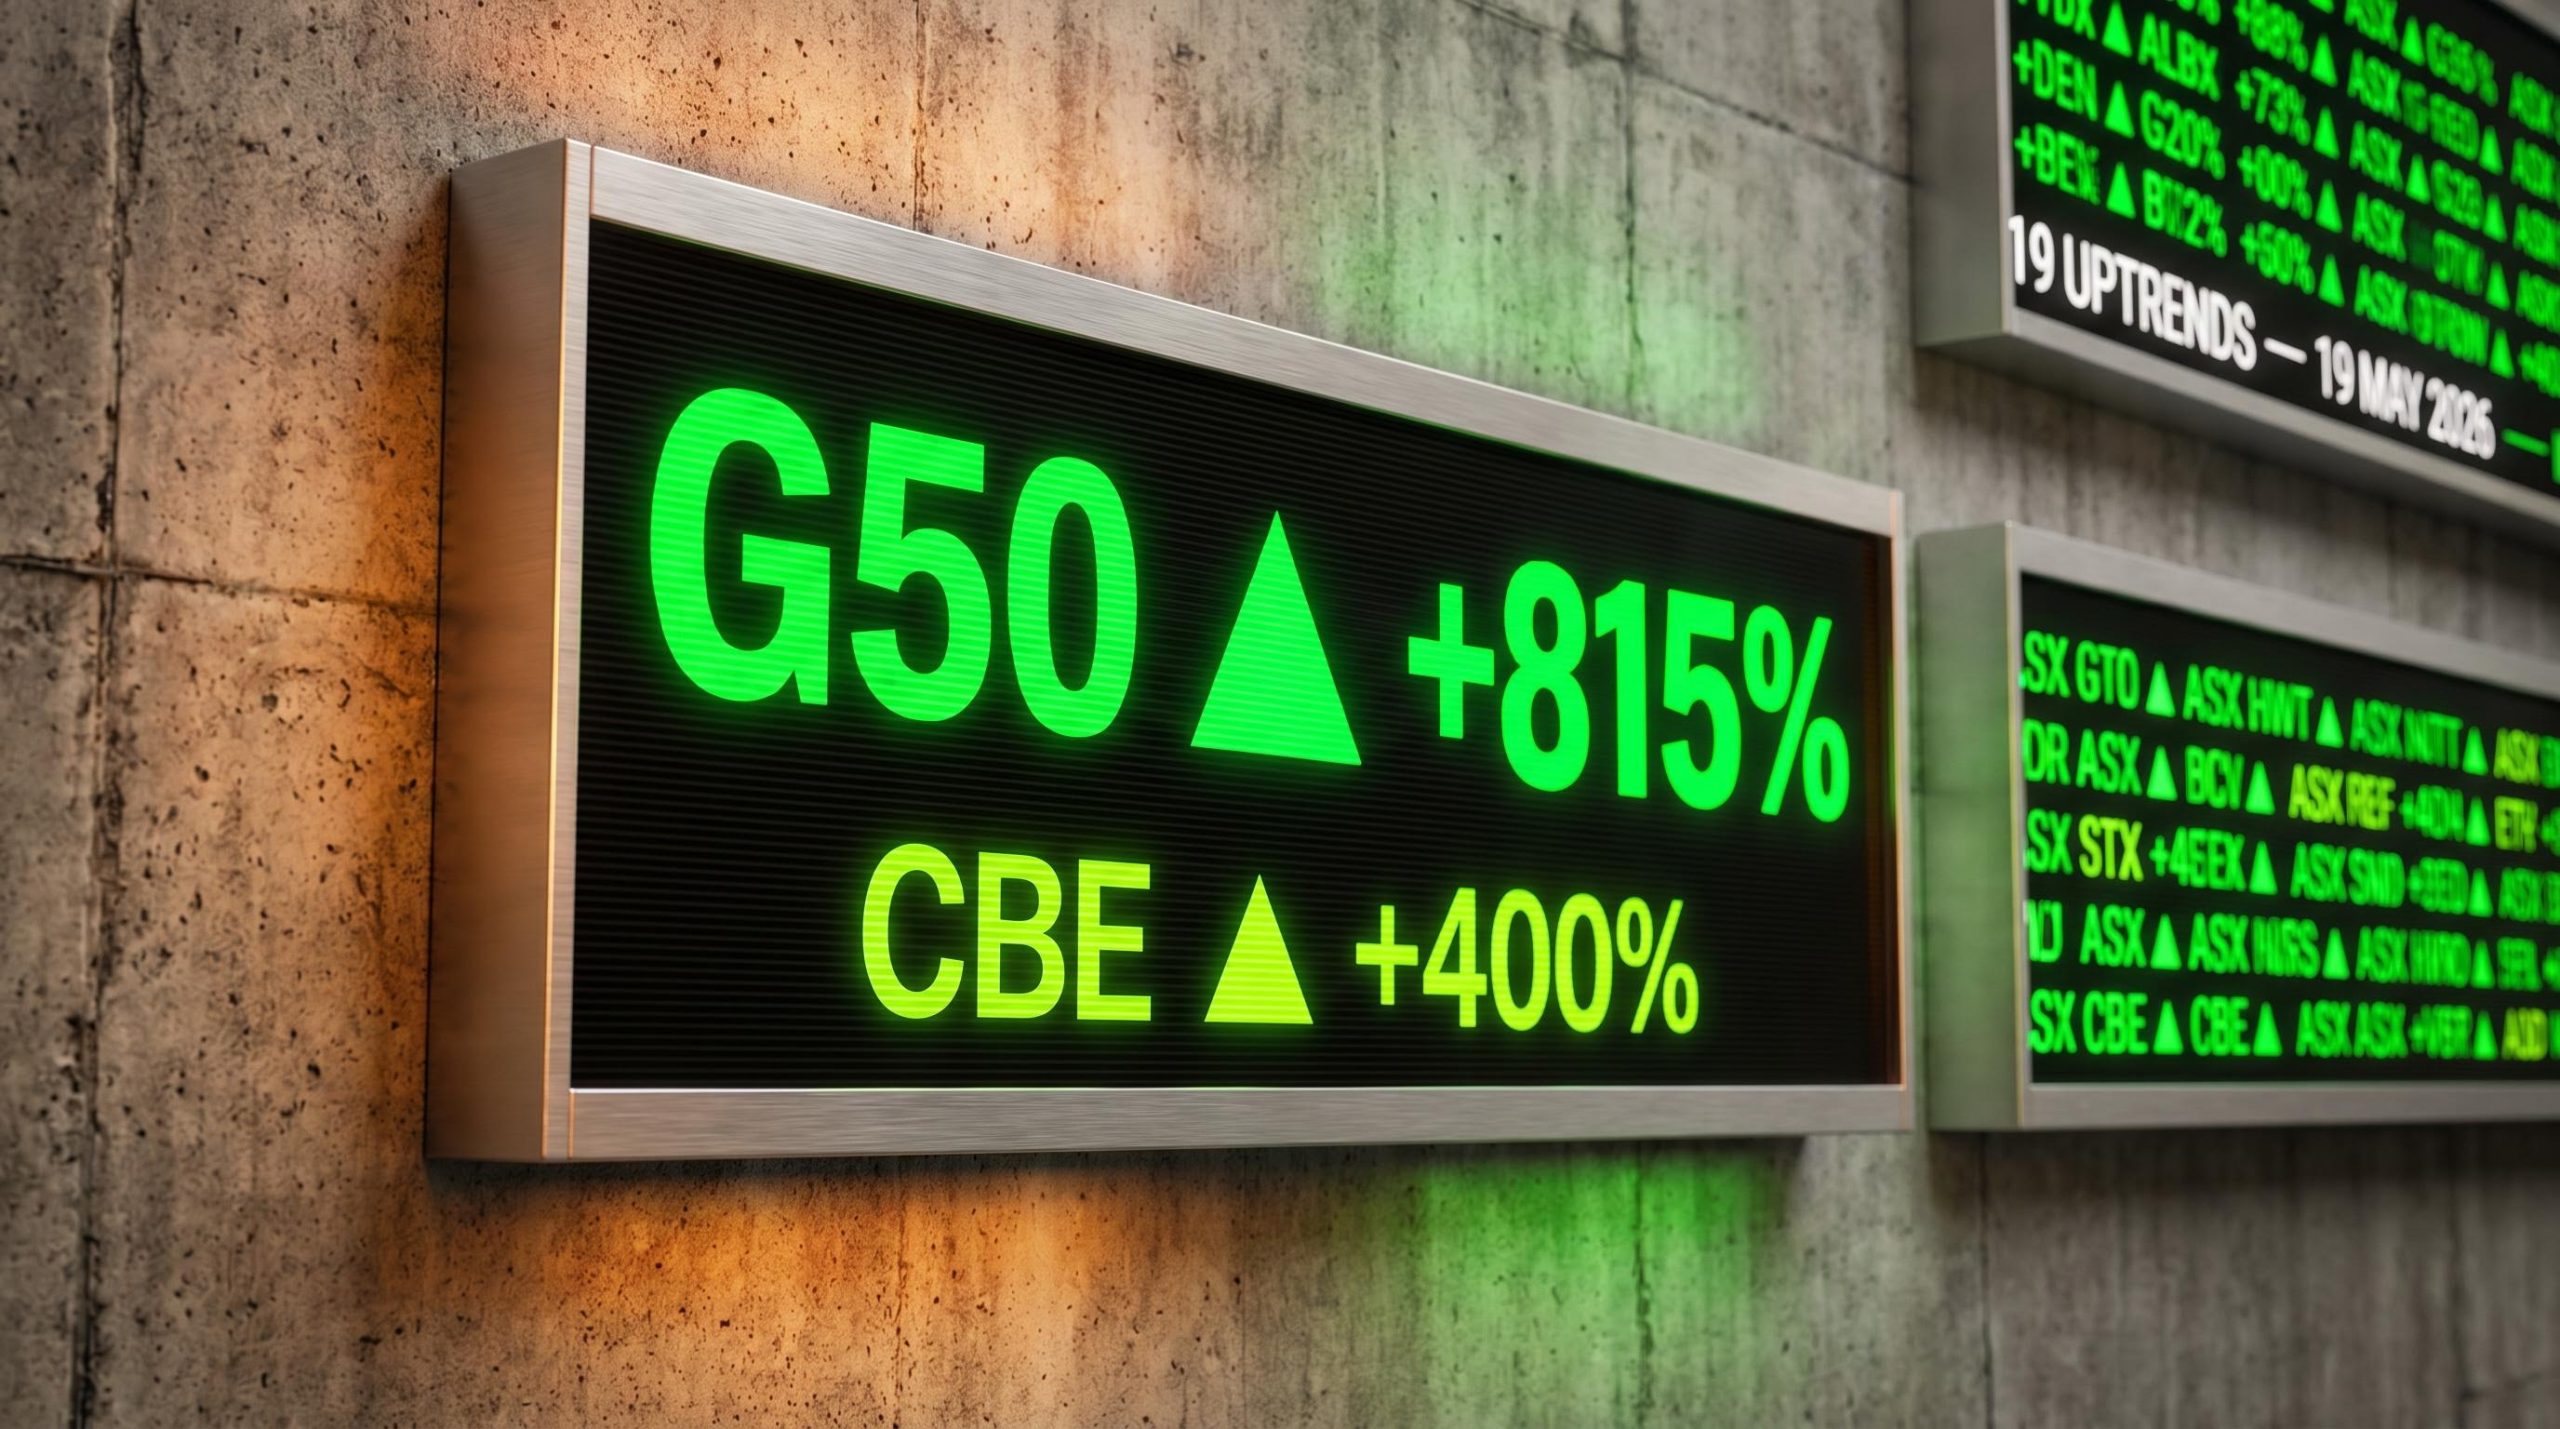
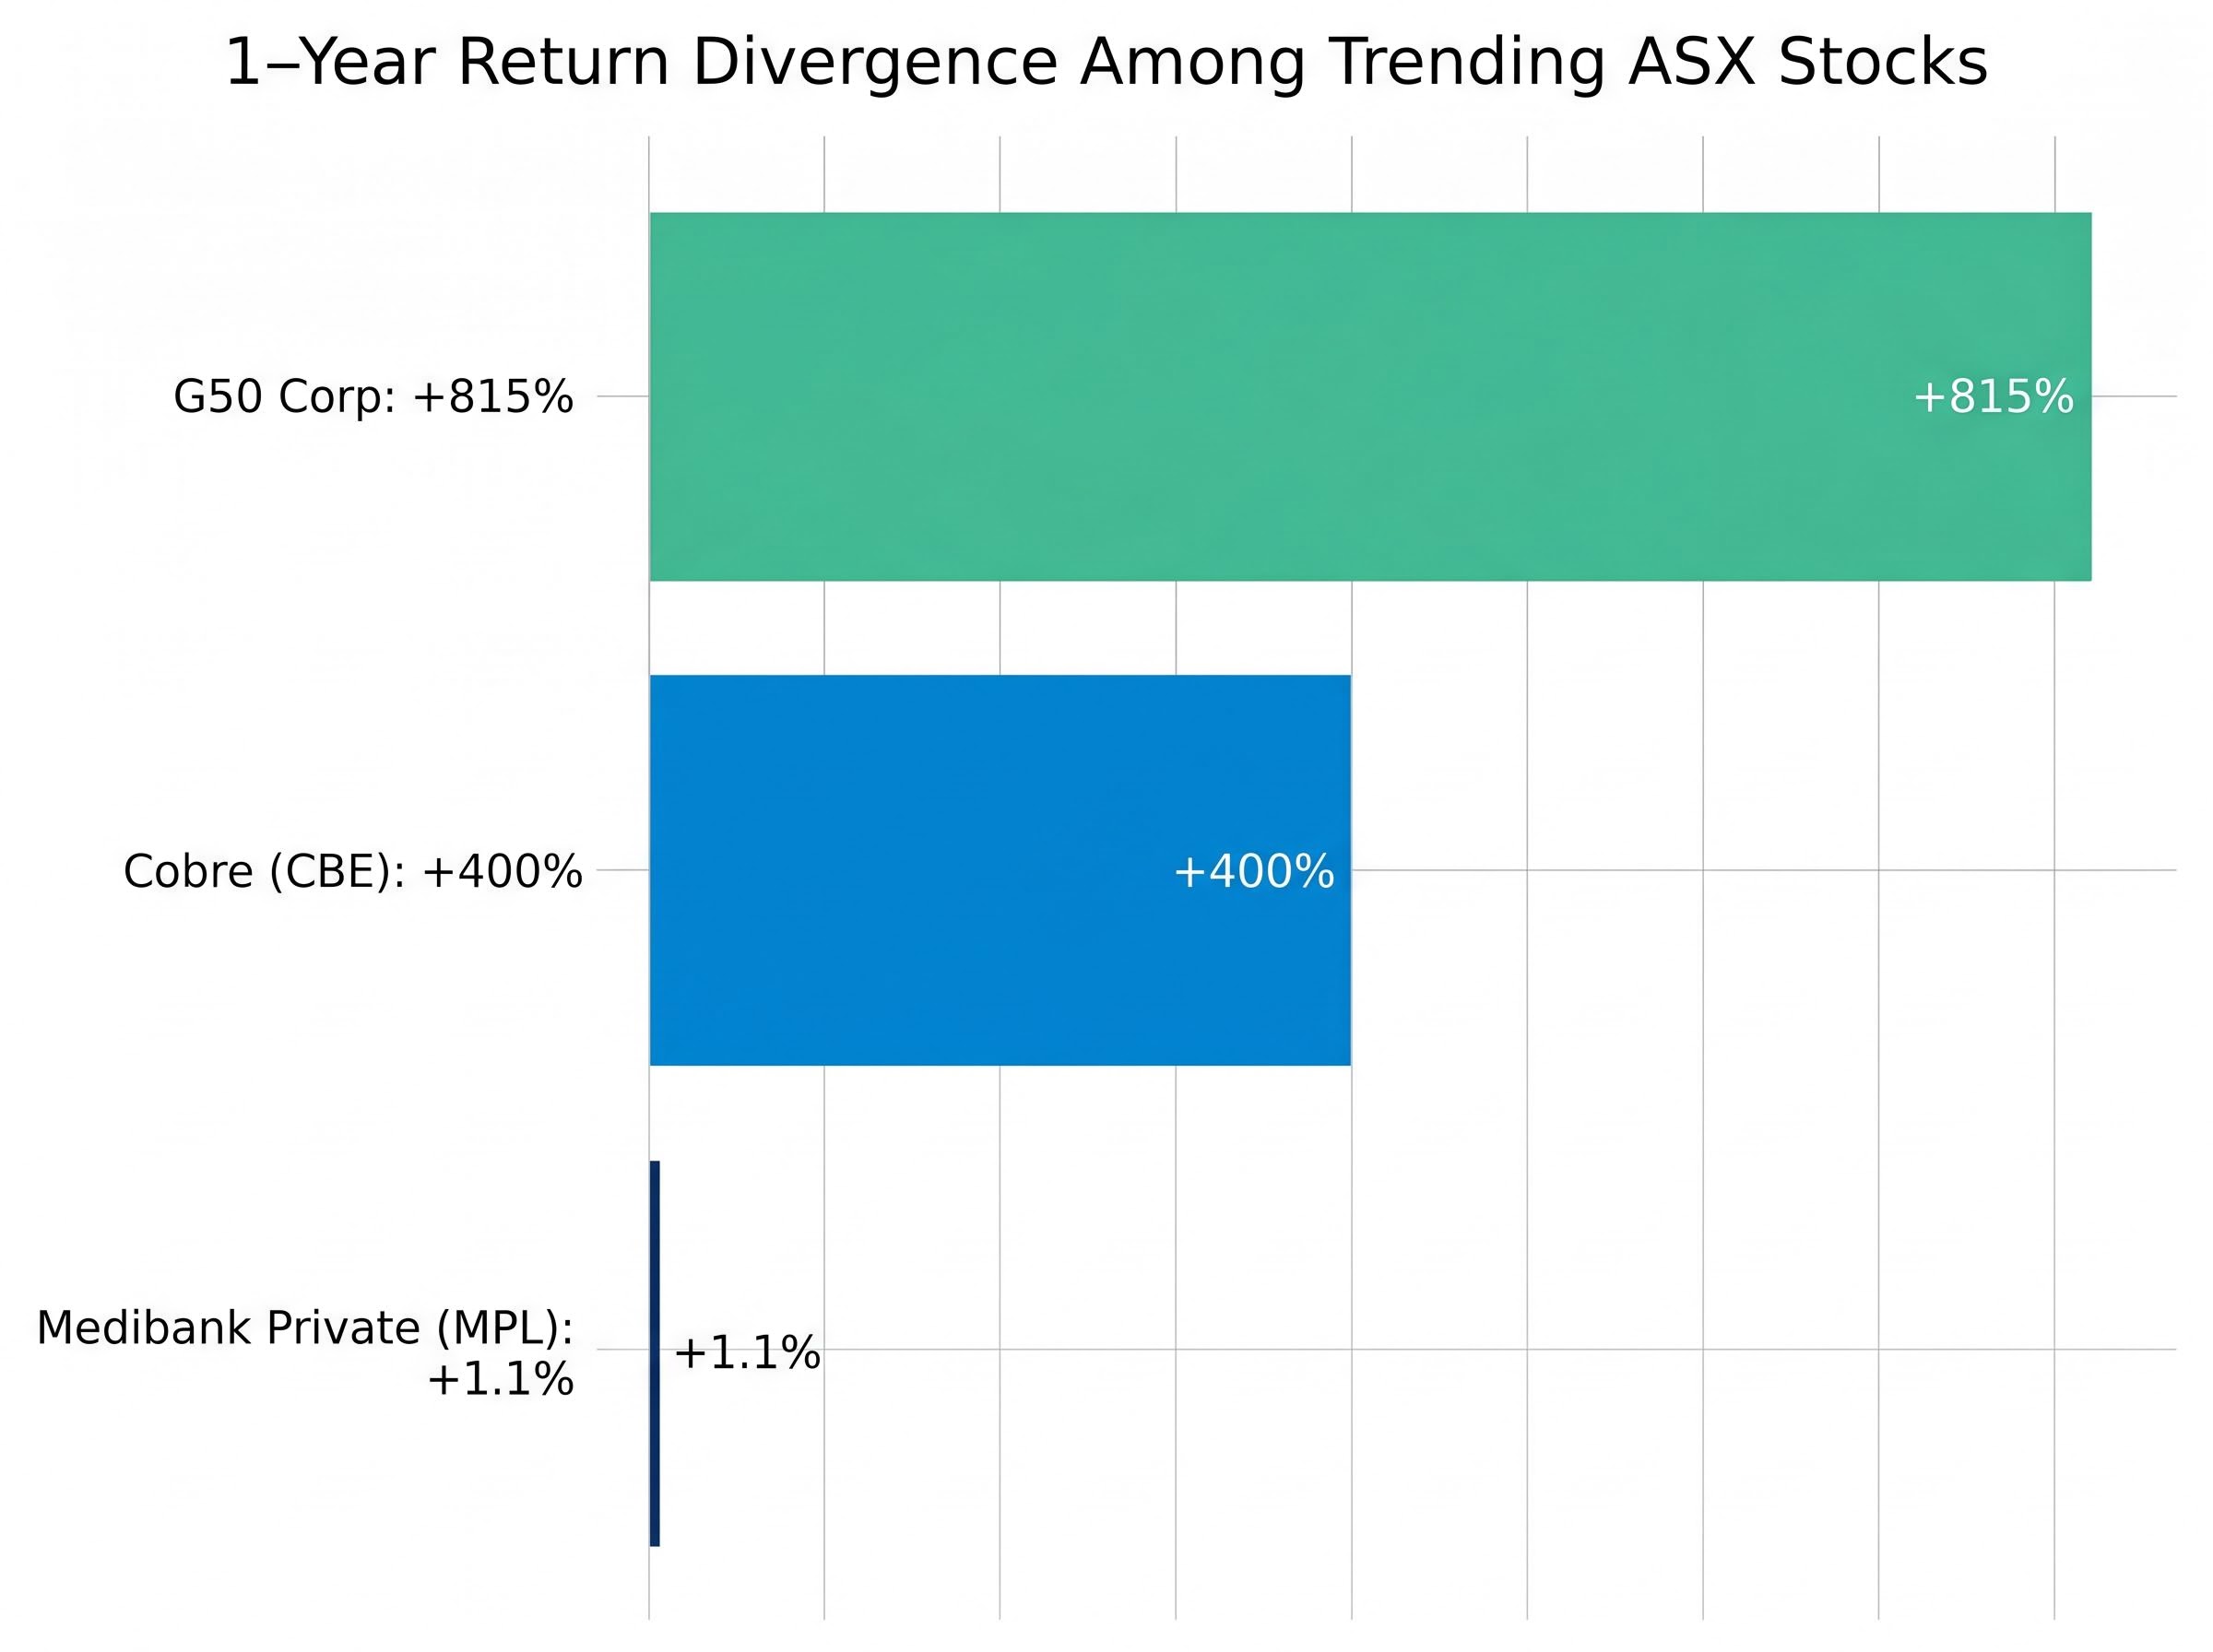
G50 Corp is up 815% over the past year. Cobre has gained 400%. As of 19 May 2026, nineteen ASX-listed securities are flashing confirmed technical uptrend signals, and nine of them are showing the strongest buying demand of all.
These figures come from the Market Index ChartWatch Daily ASX Scans, a trend-following technical analysis tool authored by Carl Capolingua and updated each trading day. The list is not a broad-market rally story. It reflects targeted momentum in specific pockets of the ASX, spanning micro-cap resource explorers, large-cap defensives, and thematic ETFs.
What follows is a breakdown of which trending ASX stocks made the cut, which nine are generating the strongest demand pressure, how they cluster by sector, and what the methodology behind the list actually means for investors evaluating potential entry opportunities.
The nine securities below were identified by ChartWatch as exhibiting the most concentrated demand pressure among all nineteen uptrend names. These are not merely trending upward; they represent the shortlist where buying conditions are at their strongest.
| Stock Name | ASX Code | Price (19 May 2026) | 1-Month Change | 1-Year Change |
|---|---|---|---|---|
| 1414 Degrees | 14D | $0.067 | +235.0% | +272.2% |
| ALS | ALQ | $23.32 | +4.2% | +31.5% |
| Anteris Technologies Global | AVR | $10.40 | +22.4% | +49.6% |
| Global X Cybersecurity ETF | BUGG | $11.08 | +25.6% | -16.6% |
| Cobre | CBE | $0.255 | +41.7% | +400.0% |
| Iron Bear Resources | IBR | $0.072 | +38.5% | +67.4% |
| Medibank Private | MPL | $4.79 | +2.8% | +1.1% |
| Suncorp | SUN | $17.83 | +7.5% | -13.4% |
| Telstra | TLS | $5.55 | +3.9% | +22.5% |
The spread tells the story. 1414 Degrees has gained +235% in a single month. Medibank Private has barely moved over an entire year at +1.1%. Both made the same featured list.
Cobre (CBE) stands out with a +400% one-year gain and +41.7% over the past month alone, placing it among the most extreme momentum names on the ASX alongside G50 Corp’s +815% annual return on the broader list.
That range, from a micro-cap explorer running at four-digit annual returns to a $12 billion health insurer grinding out low single digits, highlights the breadth of technical demand the scan is capturing. For investors scanning for long-side entry setups, these nine represent ChartWatch’s highest-conviction shortlist. Understanding which stocks combined sustained trend direction with the strongest demand indicators narrows the opportunity set considerably.
ChartWatch is a trend-following technical analysis methodology developed by Carl Capolingua, Senior Editor at Market Index, who brings over 30 years of investing experience to the scan. The system evaluates price data for sustained positive direction and buying demand pressure that exceeds selling supply, consistent with trend-following principles.
Appearing on the uptrend list means a security has satisfied defined technical criteria for positive price momentum. It does not mean it has been fundamentally assessed, rated, or recommended. The list is curated rather than exhaustive; Capolingua selects high-conviction examples from among all securities technically meeting the criteria, and no notification is issued when a stock drops off.
The scan’s practical applications fall into three categories:
The list should prompt investigation via ASX announcements, financial statement review, and personal risk tolerance assessment before any entry decision. Several securities on the current scan are micro-cap and high-volatility names where position sizing discipline is especially important.
Scan tables can be exported to trading platforms such as TradingView for ongoing monitoring, and Capolingua hosts weekly live webinars every Wednesday at 12pm AEDT for real-time analysis.
Beyond the featured nine, ten additional securities met ChartWatch uptrend criteria as of the same scan date. The diversity within this group is immediately apparent, spanning micro-cap gas explorers, listed investment companies, mid-cap services businesses, and global thematic ETFs.
| Stock Name | ASX Code | Price (19 May 2026) | 1-Month Change | 1-Year Change |
|---|---|---|---|---|
| AMP | AMP | $1.595 | +11.5% | +19.9% |
| Challenger | CGF | $9.37 | +11.7% | +28.9% |
| BetaShares Global Energy ETF | FUEL | $9.02 | +7.5% | +44.6% |
| Felix Gold | FXG | $0.365 | +28.1% | +151.7% |
| G50 Corp | G50 | $0.915 | +33.6% | +815.0% |
| IPD | IPG | $6.27 | +27.2% | +68.5% |
| Jade Gas | JGH | $0.065 | +35.4% | +97.0% |
| MFF Capital Investments | MFF | $4.92 | +2.9% | +15.2% |
| Orica | ORI | $23.07 | +12.5% | +23.7% |
| Ventia Services | VNT | $6.03 | +15.5% | +29.7% |
G50 Corp leads the entire nineteen-name list with a +815% one-year return. Felix Gold sits at +151.7% over the same period. At the other end, MFF Capital Investments has returned a steadier +15.2% over one year, more consistent with its profile as a listed investment company.
This second tier extends the opportunity set for investors willing to conduct additional research, and reinforces that technical uptrends in May 2026 are not confined to any single sector or market-cap band.
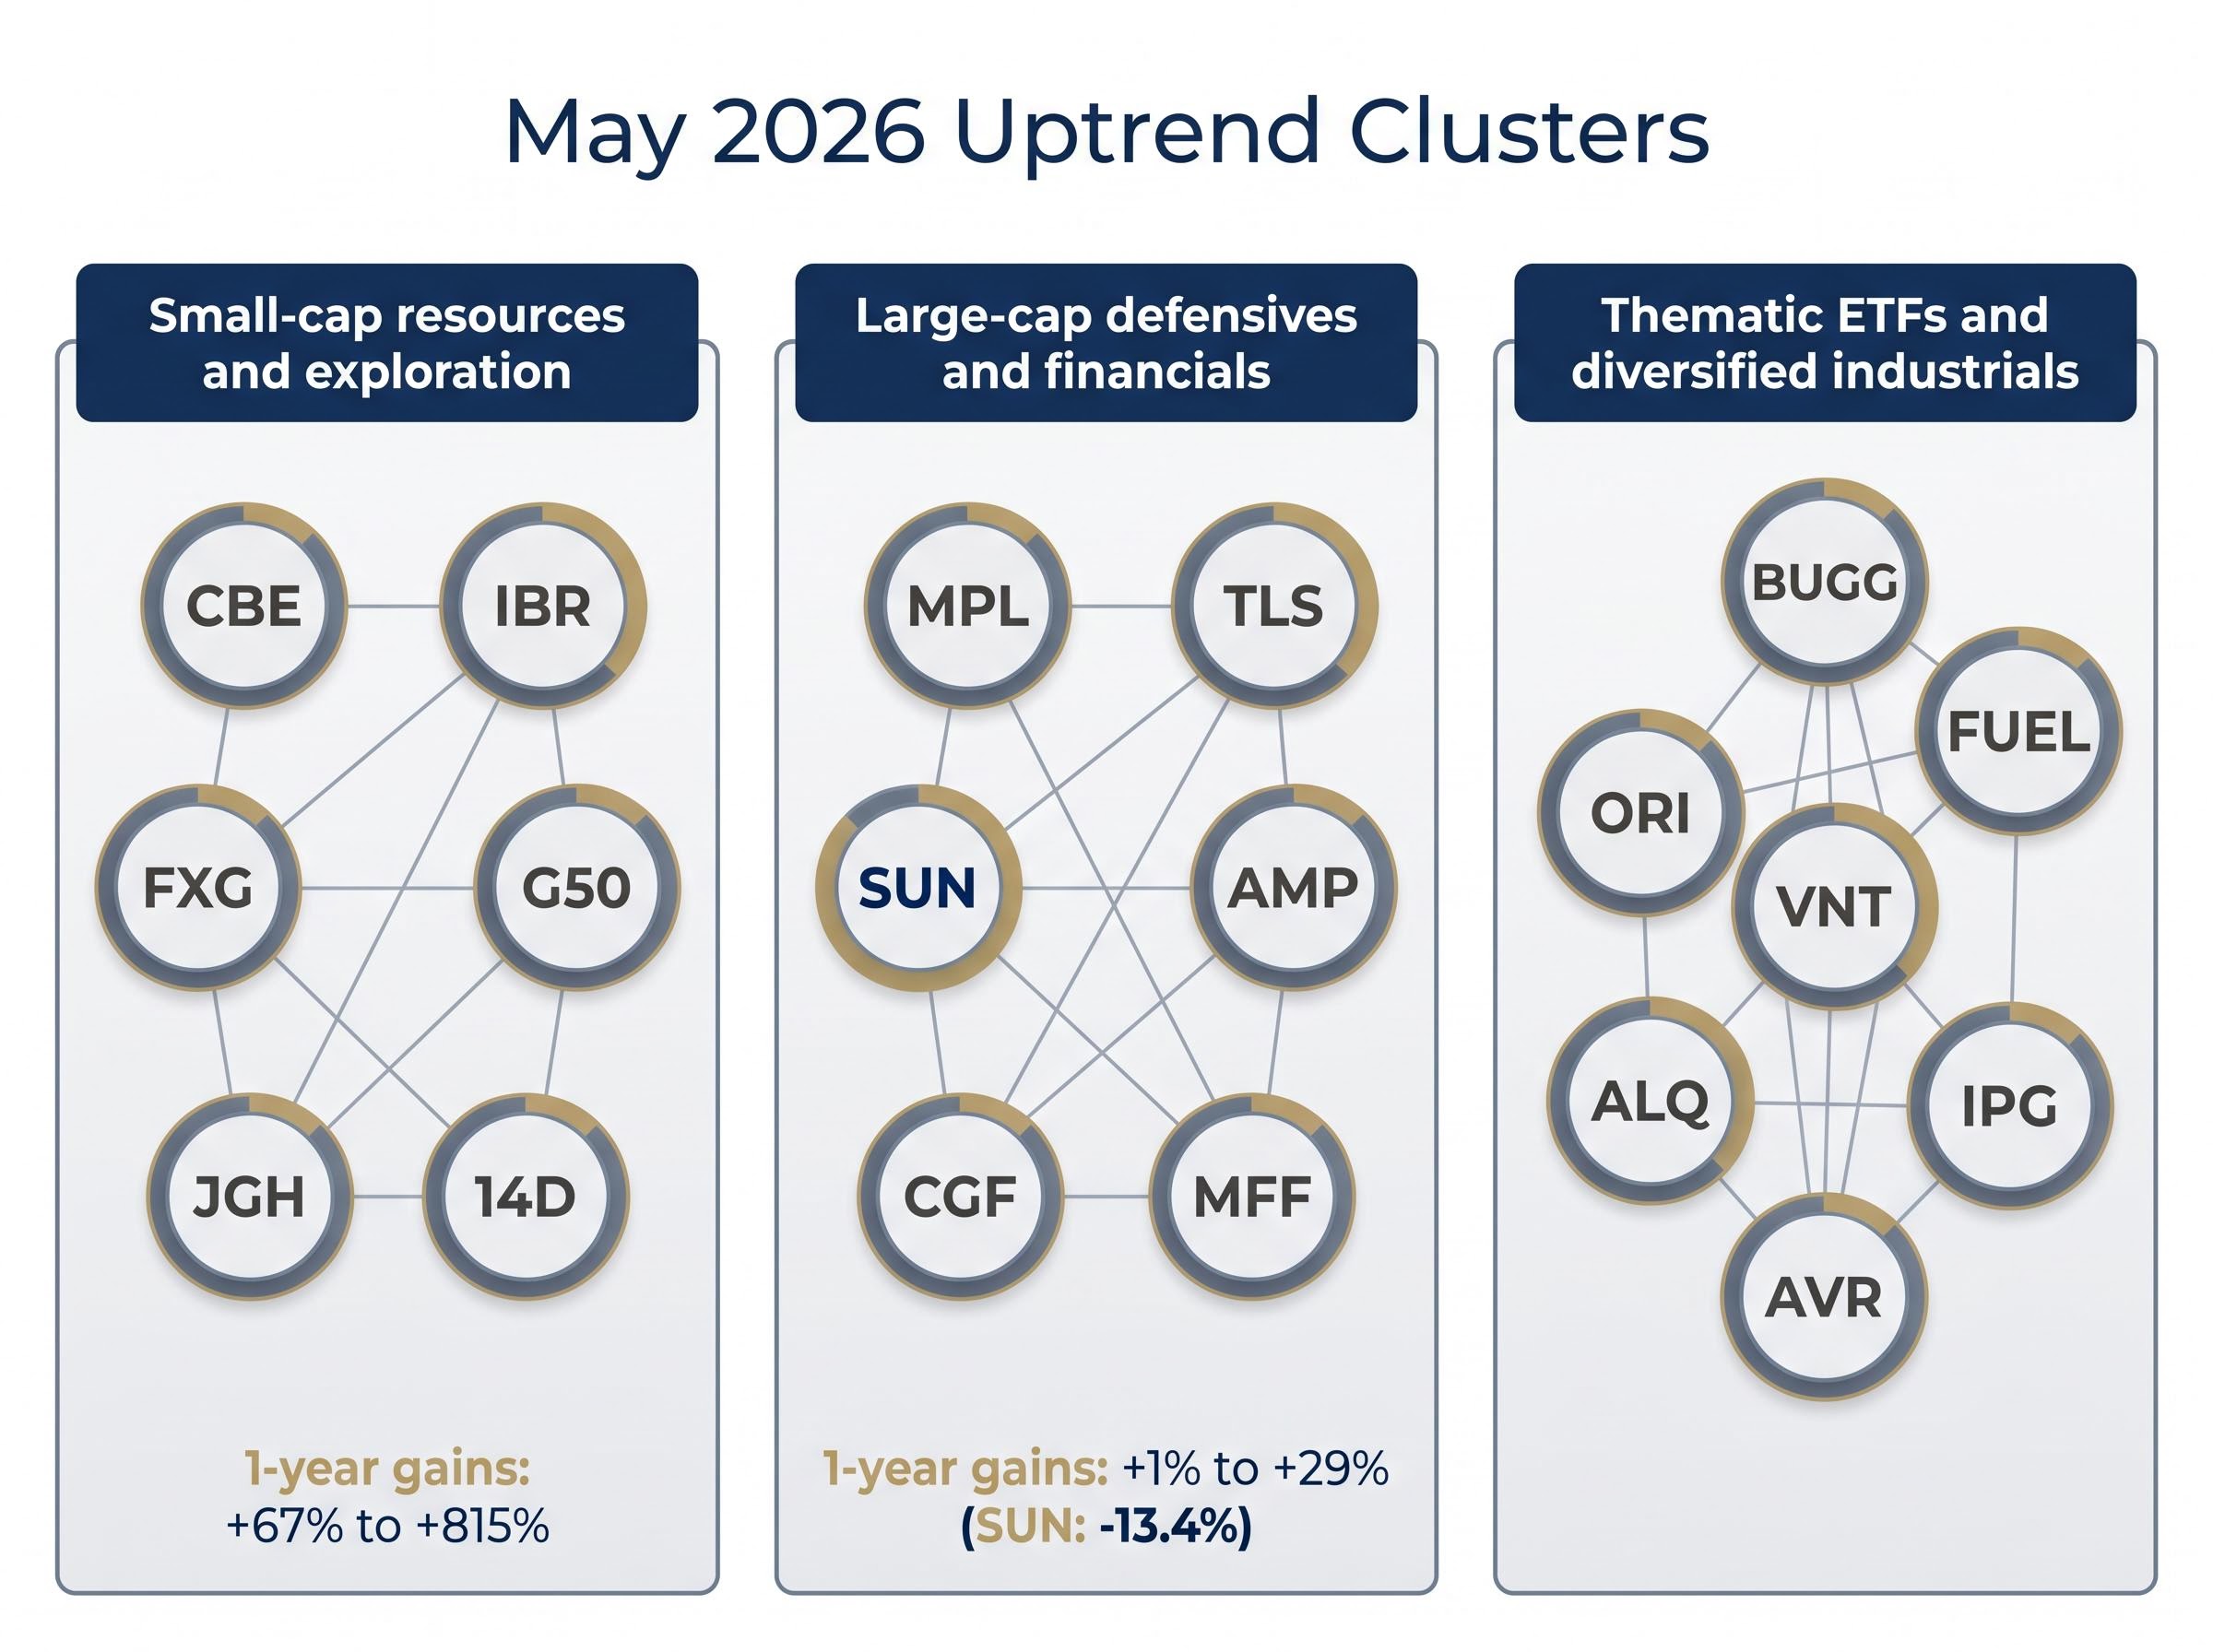
Viewed individually, nineteen securities can feel like a disconnected list. Grouped by sector, three distinct momentum clusters emerge.
The contrast in scale is striking: G50 Corp has returned +815% over one year. Medibank Private has returned +1.1% over the same period. Both satisfied the same technical uptrend criteria on the same scan date.
This distribution reflects the broader May 2026 ASX dynamic of sector rotation rather than a uniform rally. Leadership is concentrated in selective pockets rather than lifting all boats.
The Global X Cybersecurity ETF (BUGG) illustrates this nuance well. It has gained +25.6% over one month but remains down -16.6% over one year, a case of short-term momentum diverging sharply from its longer-term trajectory.
Sector context matters because it helps investors determine whether a trending name suits their existing portfolio positioning, risk appetite, and time horizon, rather than evaluating each stock in isolation.
A confirmed technical uptrend reflects historical price behaviour and demand conditions. It does not forecast future performance. Sharp reversals are possible at any time, especially among small-cap and micro-cap names where liquidity is thinner and price moves are amplified.
The ChartWatch scan does not assess fundamental value, balance sheet quality, earnings trajectory, or news-flow catalysts. All of these remain the investor’s responsibility to investigate independently.
Consider the data beneath the headline momentum. Suncorp is down -13.4% over one year but up +7.5% over one month. BUGG has lost -16.6% over one year despite gaining +25.6% in the past month. Short-term demand can coexist with a weaker longer-term picture, and the scan captures both conditions simultaneously.
As of the same 19 May 2026 scan date, 33 ASX securities were in confirmed downtrends compared to 19 in uptrends. Momentum and weakness are co-existing across the market.
Before acting on any uptrend signal, investors should consider these steps:
ChartWatch is published as general educational information, not personalised financial advice.
This article is for informational purposes only and should not be considered financial advice. Investors should conduct their own research and consult with financial professionals before making investment decisions. Past performance does not guarantee future results.
The ChartWatch uptrend list is a point-in-time snapshot based on chart analysis dated 19 May 2026. Trend status can and does change between editions. Securities may appear on multiple consecutive scans if they continue satisfying the criteria, but no alert is issued when a stock is removed. The responsibility for ongoing monitoring sits with the investor.
The current breadth of the uptrend list across resources, financials, industrials, and thematic ETFs suggests momentum is selectively available on the ASX. Disciplined entry, ongoing monitoring, and exit discipline are as important as the initial identification.
Three practical next steps for readers:
Trend-following is an active practice. The list opens the door; the work that follows determines the outcome.
—
—
ChartWatch identified nineteen ASX securities in confirmed uptrends as of 19 May 2026, with nine showing the strongest buying demand, including Cobre (CBE), G50 Corp (G50), 1414 Degrees (14D), Telstra (TLS), and Medibank Private (MPL).
Appearing on the ChartWatch uptrend list means a security has satisfied defined technical criteria for positive price momentum and demand pressure exceeding supply; it does not mean the stock has been fundamentally assessed, rated, or recommended as a buy.
Investors should treat the ChartWatch scan as a starting point, using it to identify potential long-side candidates for further investigation via ASX announcements, financial statement review, and personal risk tolerance assessment before making any entry decision.
Three clusters dominate the May 2026 uptrend list: small-cap resources and exploration names such as Cobre and G50 Corp, large-cap defensives and financials such as Telstra and Medibank Private, and thematic ETFs plus diversified industrials such as the Global X Cybersecurity ETF and Orica.
As of 19 May 2026, thirty-three ASX securities were in confirmed downtrends compared to nineteen in confirmed uptrends, indicating that momentum and weakness were co-existing across the broader market.