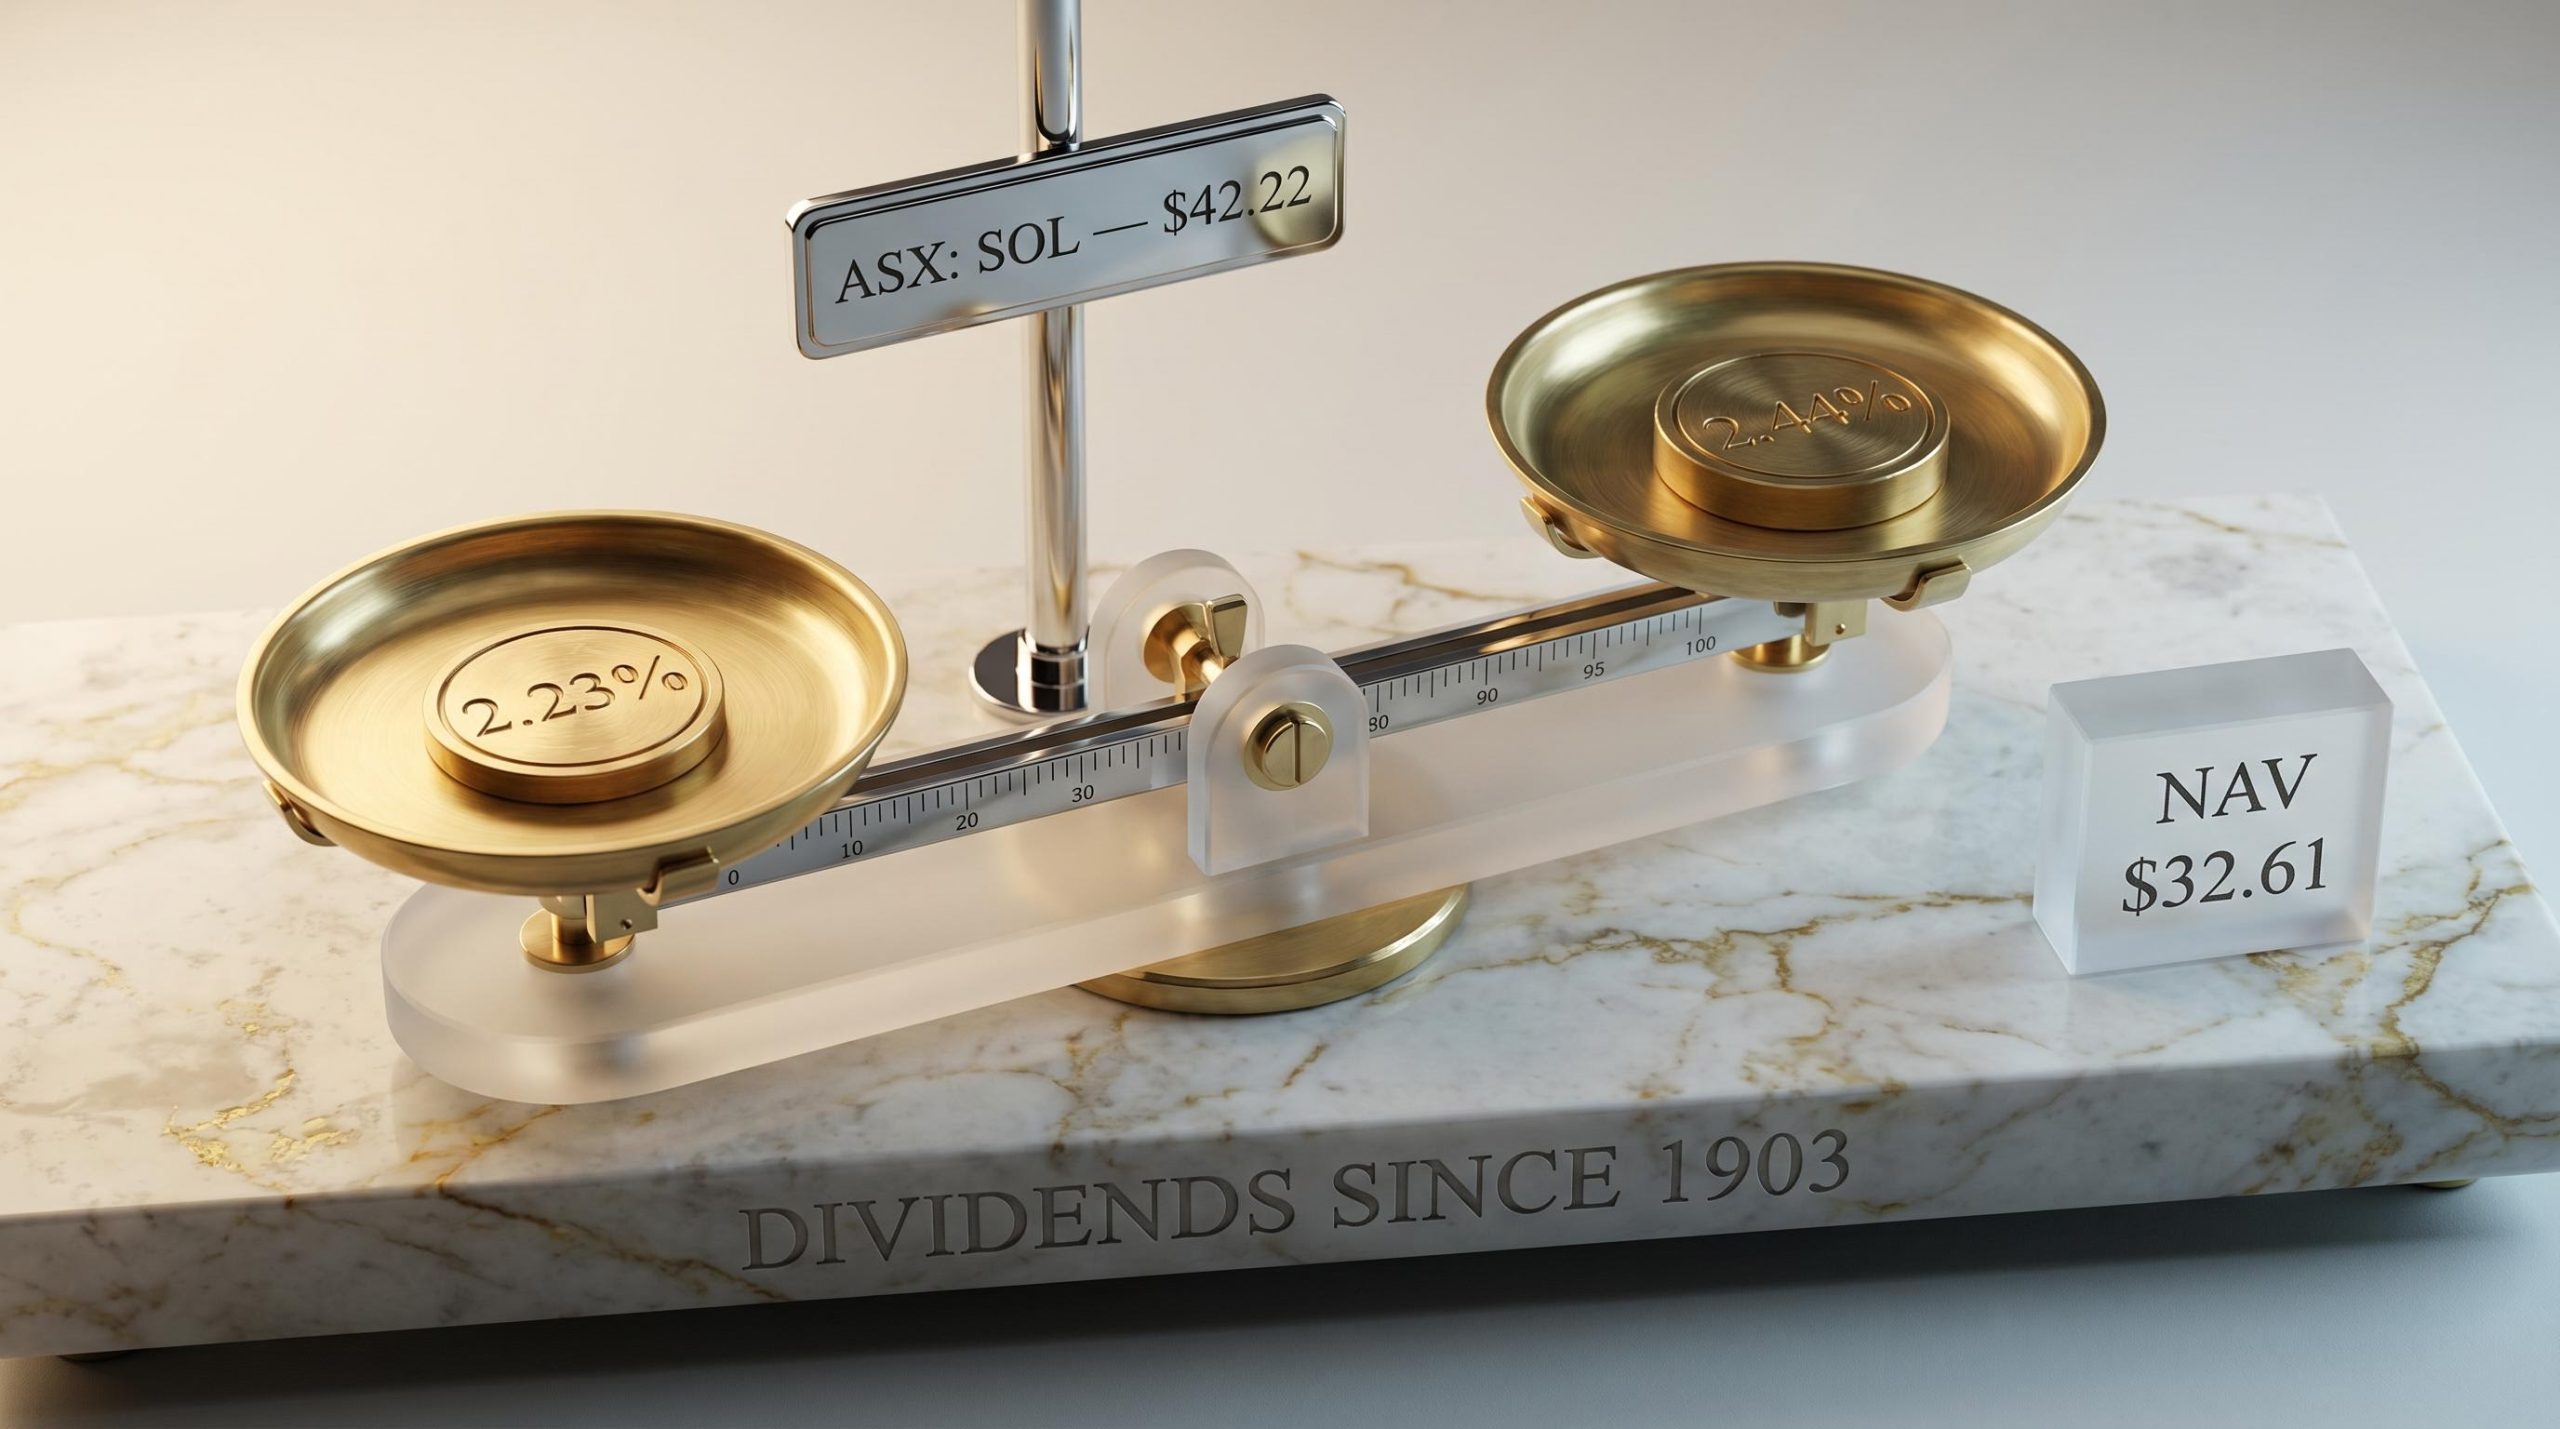
Washington H. Soul Pattinson (ASX: SOL) has climbed roughly 13% since the start of 2025, pushing the share price to approximately $42.22 as of 14 May 2026. Yet the dividend yield has slipped to around 2.23%, sitting 21 basis points below the stock’s five-year historical average of 2.44%. For income investors, that gap is the question: has the run priced in the next several years of growth, or does the stock remain a reasonable entry?
WHSP has been paying dividends without interruption since 1903, making it one of the most reliable income compounders on the ASX. Reliability and current value are not the same thing, though, and the share price now asks investors to pay a premium relative to the company’s own yield history. This analysis walks through the dividend yield valuation method as applied to SOL, examines the portfolio holdings that underpin earnings capacity, and offers a grounded view of where the stock sits relative to its own benchmarks.
A 120-year-old compounder hiding in plain sight
Listed on the ASX since 1903, WHSP has built a track record that few Australian companies can match. The unbroken dividend record from that date is frequently cited as a marker of institutional quality, and for good reason.
Longevity alone, however, is not a valuation argument. What matters today is the diversified portfolio sitting beneath the share price. WHSP operates as a diversified investment holding company, functioning analytically like a listed investment company (LIC) without formal classification as one. It typically trades at a narrower discount to asset backing than traditional LICs, a distinction that shapes how investors should interpret its pricing.
The ASX LIC disclosure rules require listed investment companies to report NTA within 14 days of month-end, a transparency standard that makes NTA tracking feasible for retail investors and underpins the discount-to-NAV analysis commonly applied to vehicles like WHSP.
The company’s anchor listed holdings include:
- TPG Telecom (ASX: TPG), providing telecommunications exposure
- New Hope Group (ASX: NHC), contributing resource-linked cashflows from thermal coal
- Brickworks (ASX: BKW), offering industrial property and building products exposure
- A growing private markets allocation, spanning private equity funds and direct unlisted investments
WHSP’s stated objective is capital appreciation combined with progressively growing dividends. That dual mandate means a pure growth lens or a pure income lens will each miss part of the picture. The appropriate valuation approach needs to account for both.
When big ASX news breaks, our subscribers know first
What the dividend yield gap actually tells you
For mature, dividend-oriented companies, the historical average yield functions as a kind of gravitational centre. When the current yield falls below the average, the share price has run ahead of dividend growth. When yield rises above average, the price has lagged.
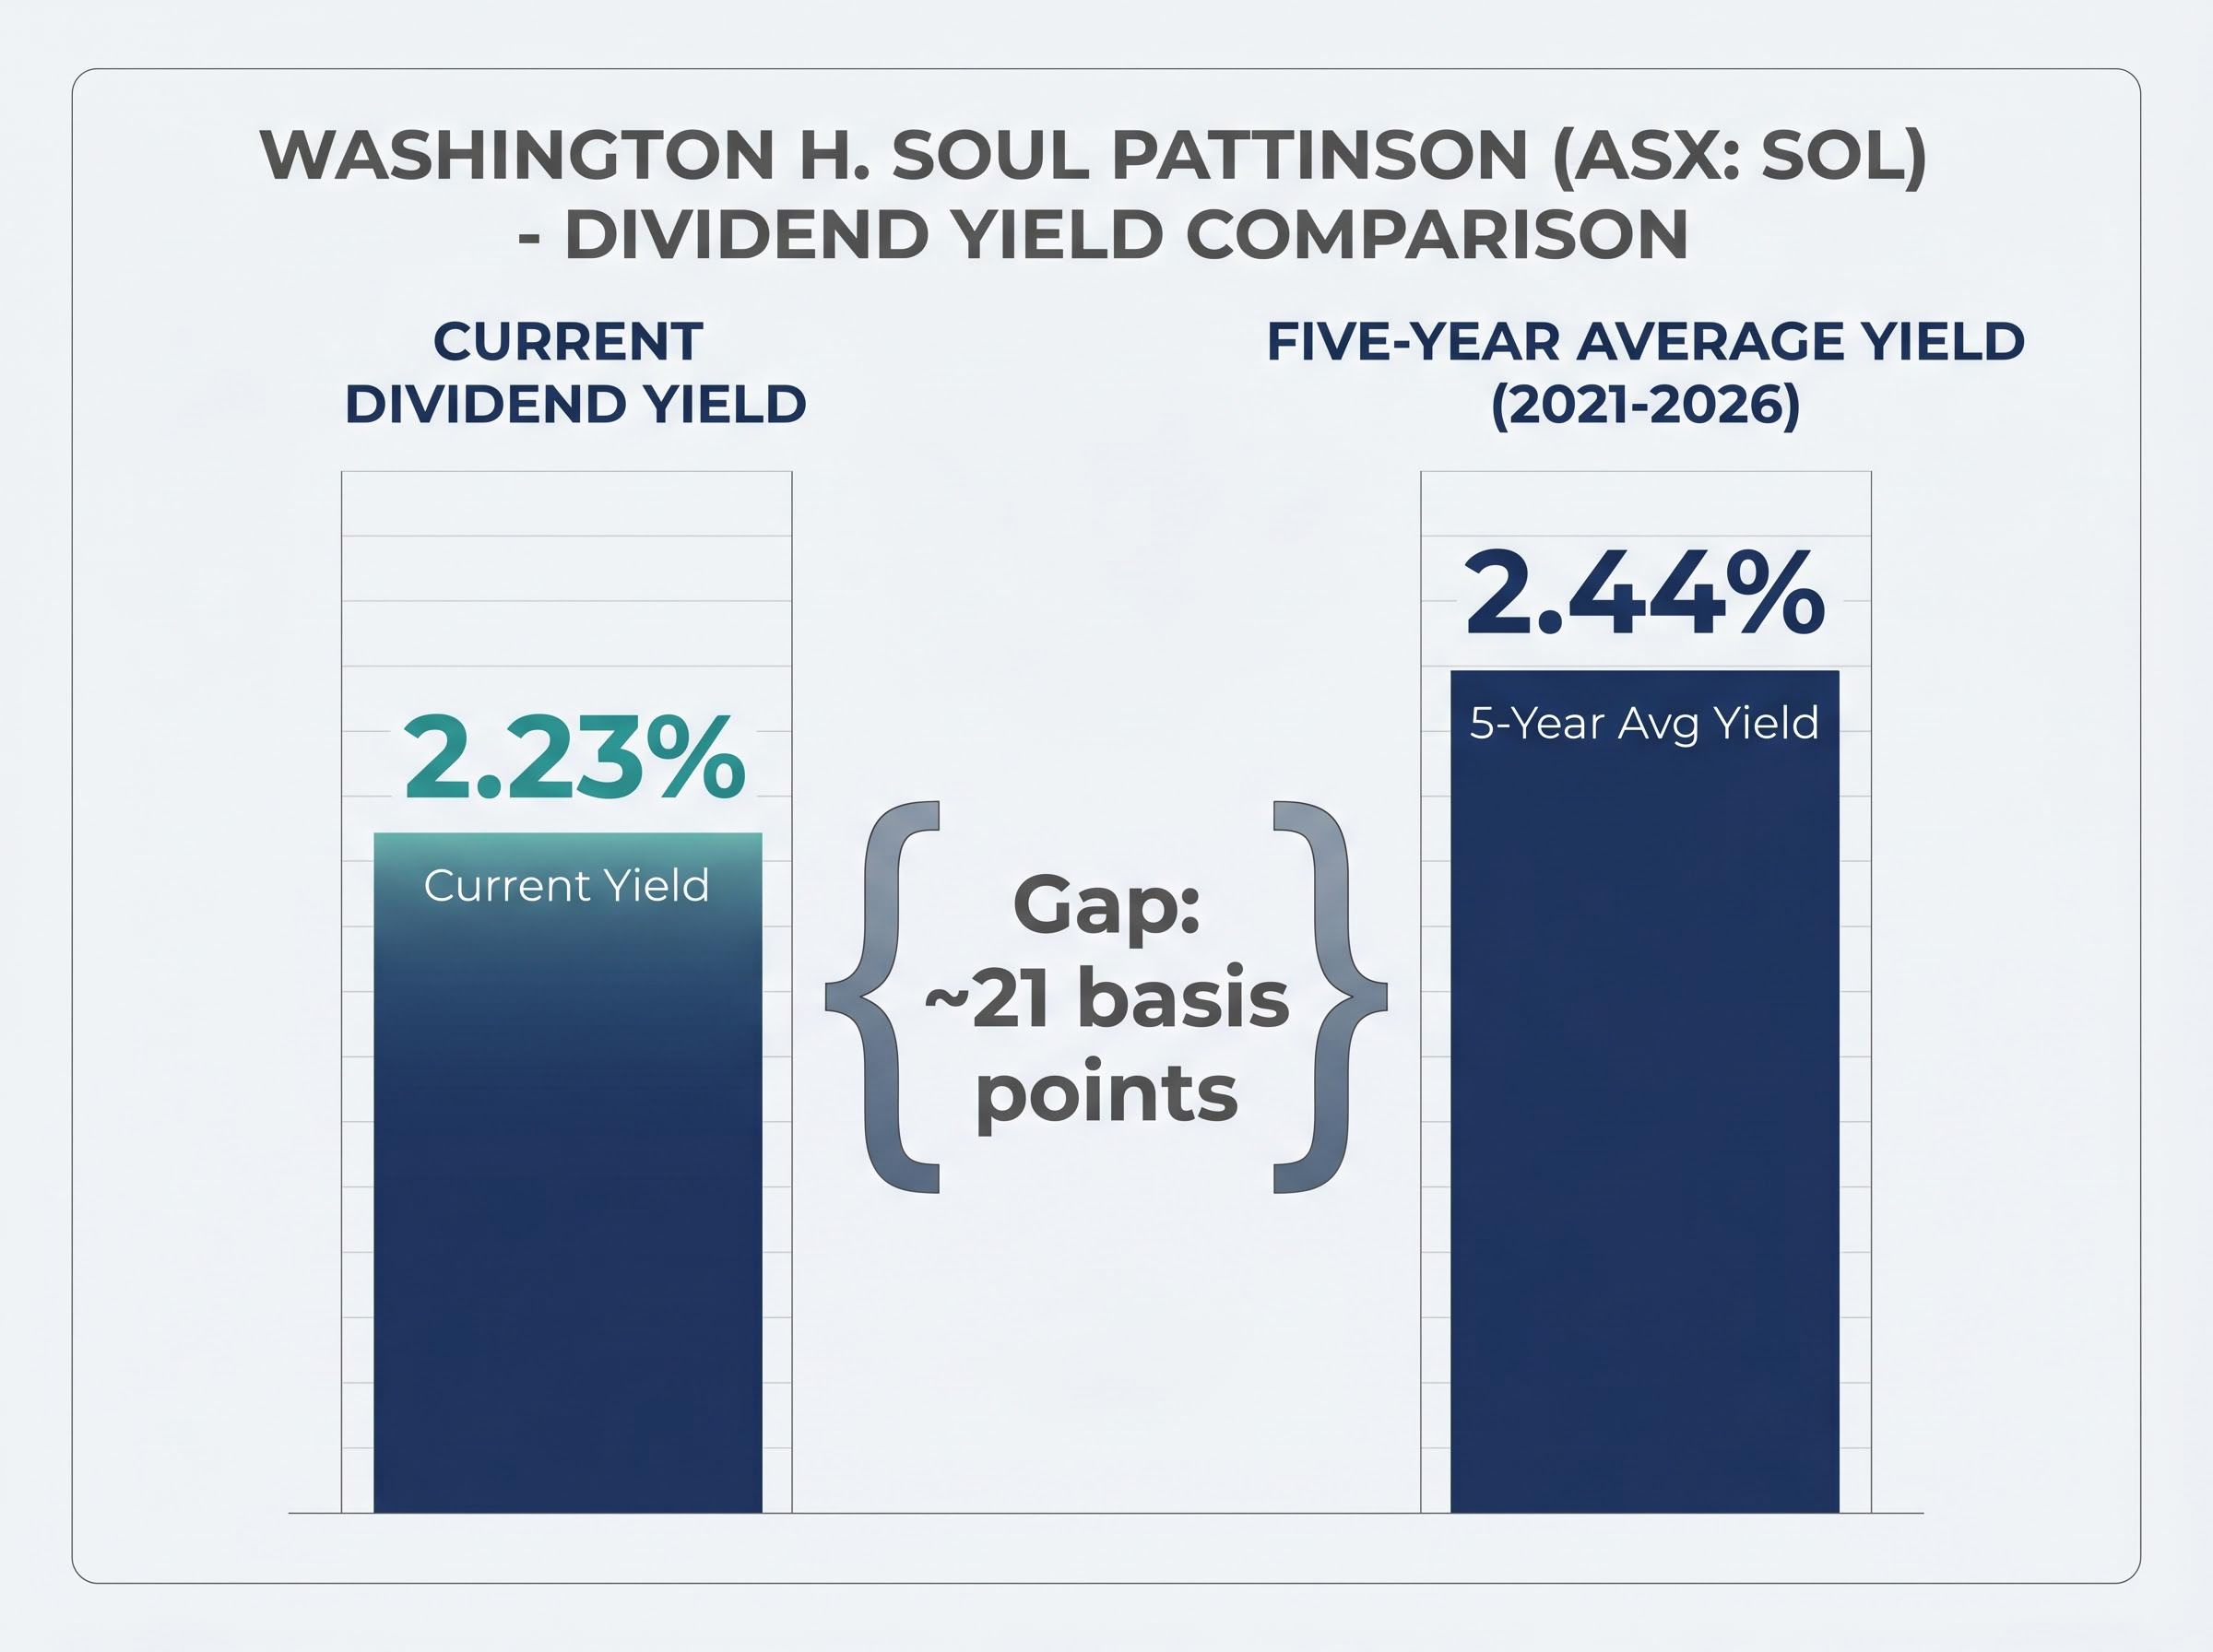
SOL’s yield of approximately 2.23% sits below its five-year average of 2.44%, a gap of roughly 21 basis points. That gap does not automatically signal overvaluation. It tells investors that the price has risen faster than the dividend, which may reflect genuine growth in net asset value, a broader market re-rating of quality compounders, or both.
The 21-basis-point gap between SOL’s current yield (2.23%) and its five-year average (2.44%) is the single clearest relative valuation signal available to income investors assessing the stock at current prices.
The dividend trajectory itself is upward. WHSP paid a total ordinary dividend of 95 cents per share (fully franked) in FY24. The FY25 final dividend came in at 59 cents per share, and the HY26 interim dividend was 48 cents per share, bringing the cumulative annualised figure to approximately 107 cents per share. The most recent annual dividend exceeds the three-year average, confirming the progressive policy remains active.
| Metric | Figure |
|---|---|
| Current dividend yield | ~2.23% |
| Five-year average yield | ~2.44% |
| Gap | ~21 basis points |
This method works best as a relative comparison tool rather than an absolute valuation answer. It identifies where the price sits against the stock’s own history but should be paired with deeper analysis before forming an investment view.
The portfolio holdings that backstop the dividend
The yield signal only means something if the cashflows beneath it are credible. WHSP’s progressive dividend commitment rests on three anchor holdings, each with an individually defensible earnings story.
New Hope Group (ASX: NHC)
New Hope’s FY24 results showed underlying earnings down from the FY23 peak as thermal coal prices normalised, yet absolute earnings remained high by historical standards. The company declared an ordinary dividend of 17 cents per share plus a special dividend of 9 cents per share, both fully franked, evidence of continued cashflow strength.
Medium-term volumes are supported by the New Acland Stage 3 ramp-up, which received positive progress updates through 2024 and 2025. For WHSP, NHC’s elevated dividends and strong cash generation have been a primary driver of its own dividend capacity since 2022, continuing through the moderation in coal prices.
TPG Telecom (ASX: TPG)
TPG’s share price recovered materially from 2023 lows, lifting the mark-to-market value of WHSP’s stake and contributing positively to portfolio NAV. FY24 results, released on 27 February 2025, highlighted ongoing network simplification, debt reduction, and a mid-single-digit EBITDA growth outlook.
The operational underpinning sits in 5G infrastructure investment and enterprise customer growth, both of which management positioned as core growth vectors. WHSP’s FY24 commentary cited TPG’s improvement as a significant contributor to portfolio performance.
Brickworks (ASX: BKW)
Brickworks carries a cross-holding dynamic with WHSP, creating indirect exposure to its 50% industrial property joint venture with Goodman Group. FY24 results reported growth in property EBIT, driven by Western Sydney logistics and warehousing assets.
Building products demand softened in both Australia and North America, reflecting the impact of higher interest rates on housing construction. The property JV’s earnings provided a meaningful offset to that cyclical headwind, making Brickworks’ contribution to WHSP more resilient than the building products cycle alone would suggest.
NAV, broker fair value, and what the share price implies
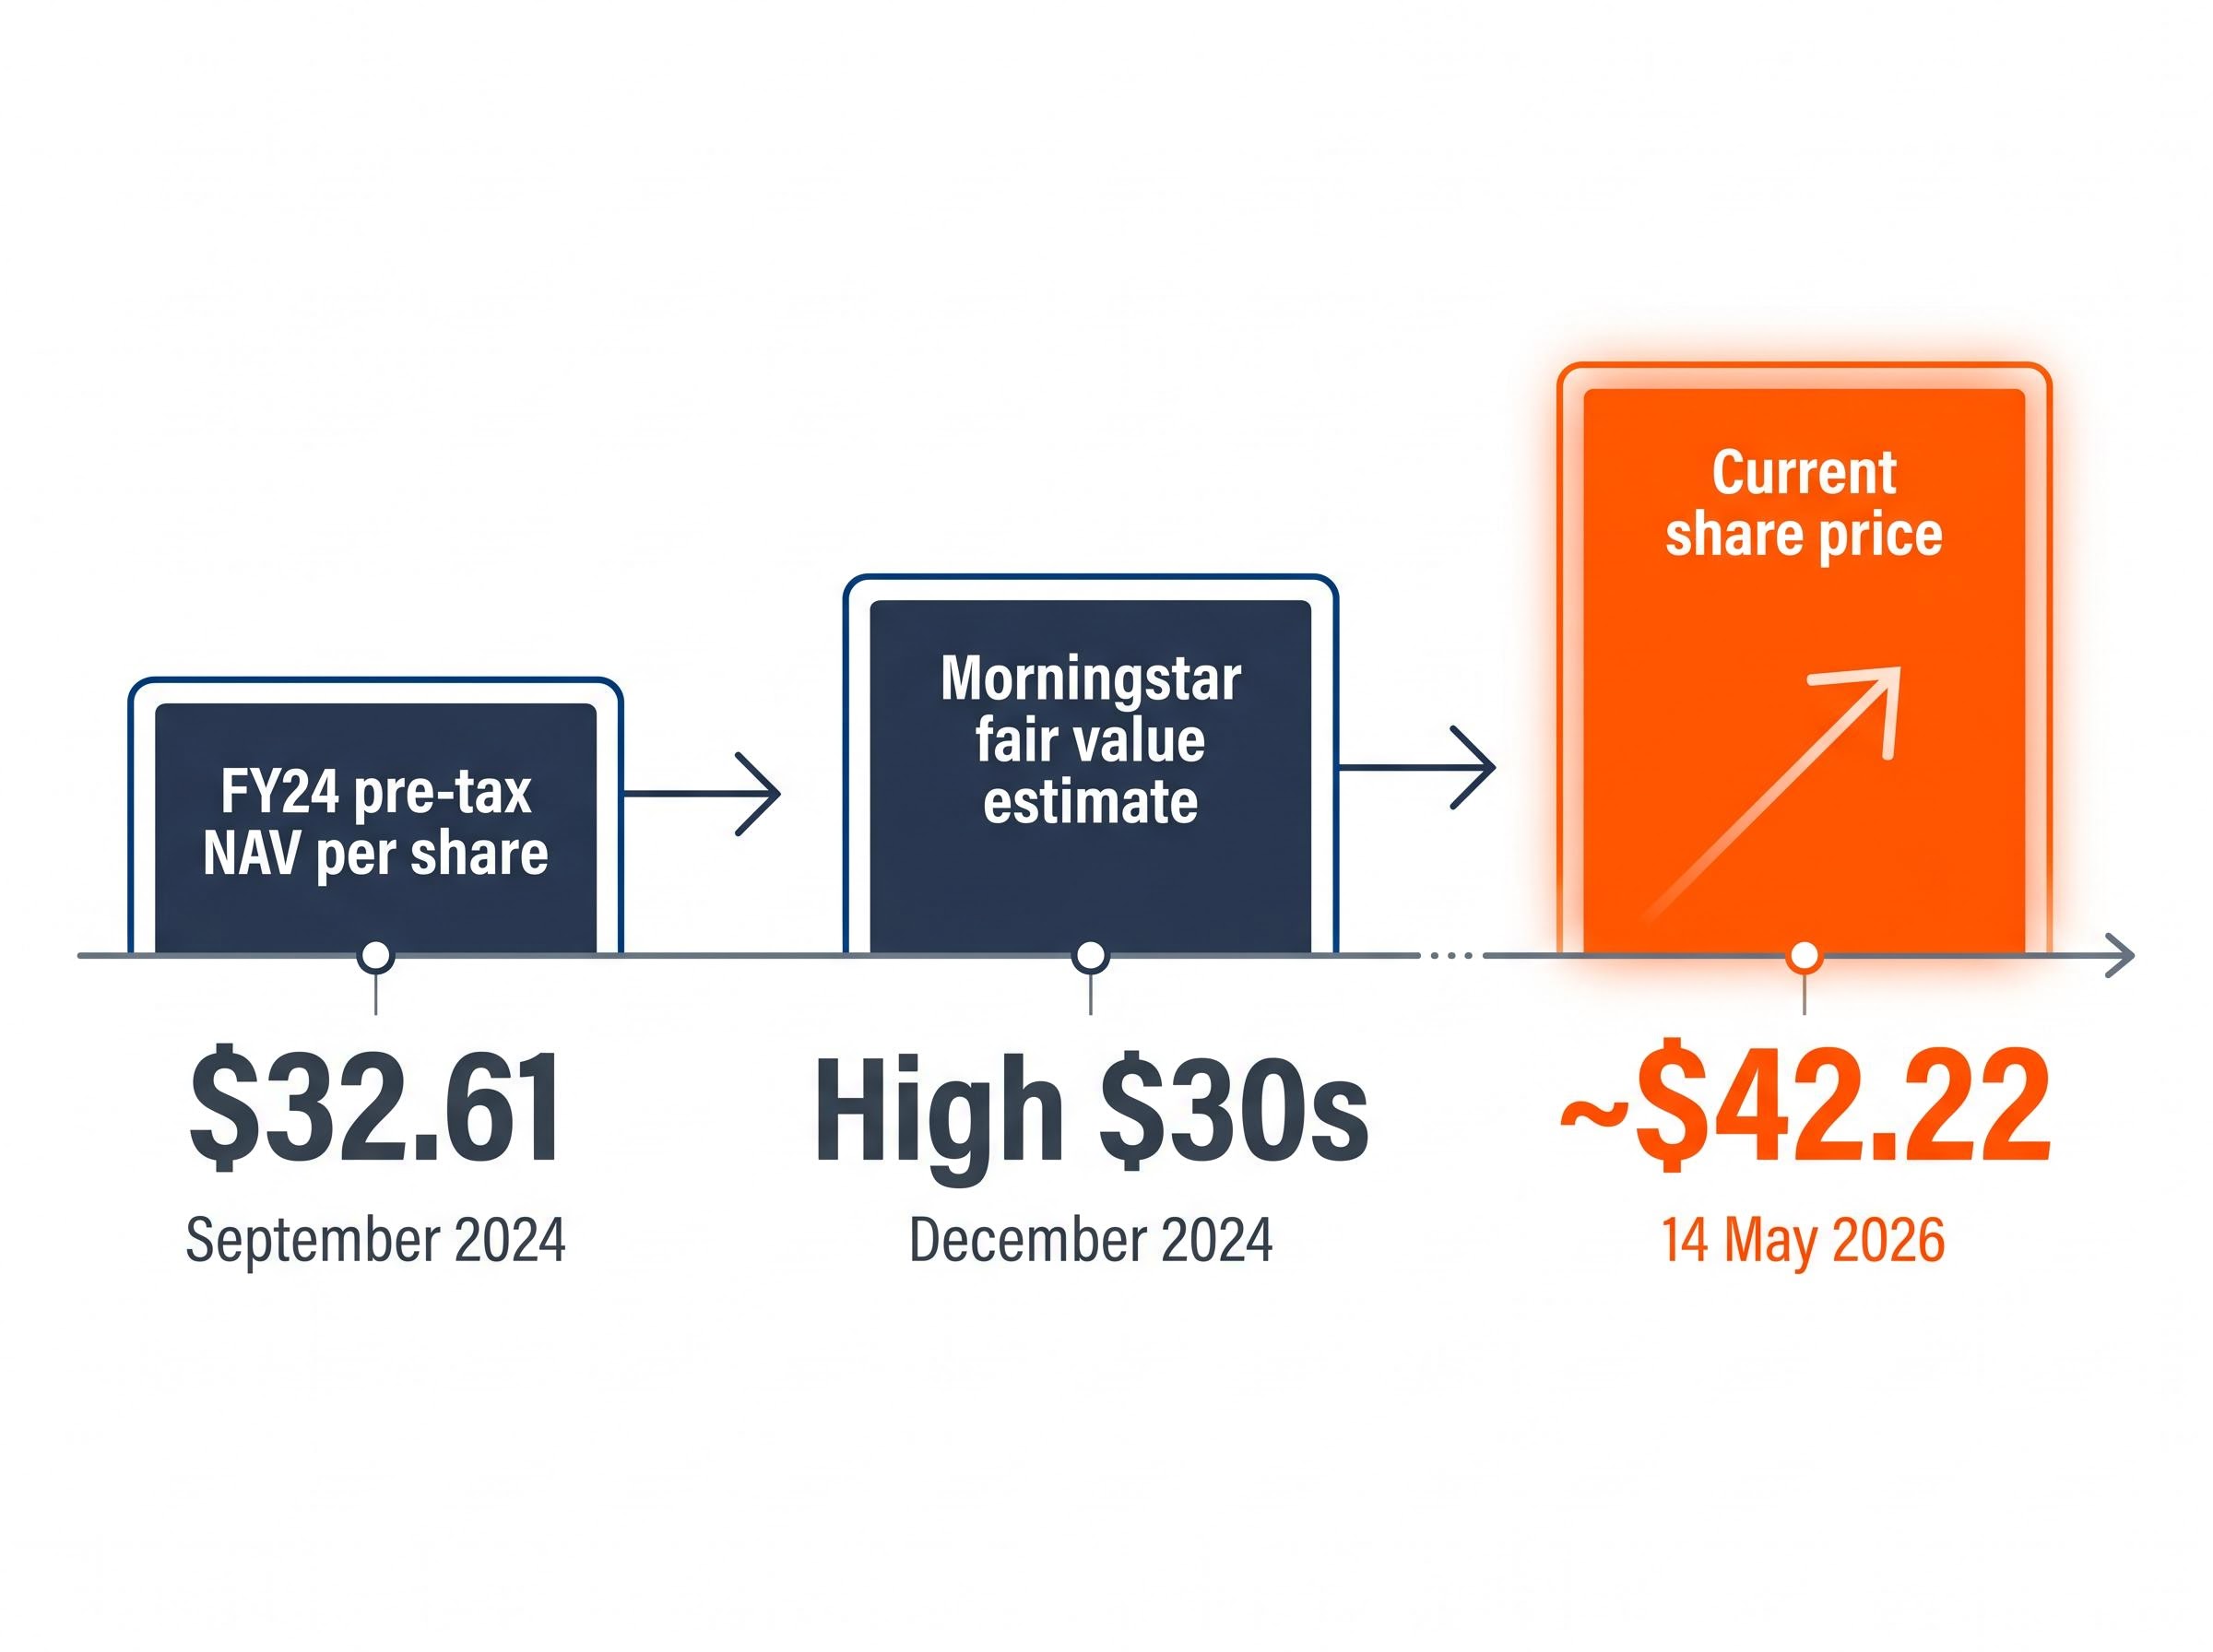
WHSP reported FY24 pre-tax NAV per share of $32.61. With the share price at approximately $42.22 by mid-May 2026, the stock appears to trade at or above the FY24 NAV benchmark, a material shift from the historical pattern of trading at a discount.
The consistent analyst framing from 2024-2025 positioned SOL “around fair value” rather than at a deep discount, a characterisation shared across broker commentary, Livewire, and Motley Fool Australia assessments during that period.
Morningstar’s fair value estimate, as summarised by the AFR in December 2024, placed SOL in the “high $30s.” That estimate is now approximately 18 months old and sits materially below the current share price. An updated figure should be verified before relying on it for a position decision.
| Valuation Benchmark | Figure | Date |
|---|---|---|
| FY24 pre-tax NAV per share | $32.61 | September 2024 |
| Morningstar fair value estimate | “High $30s” | December 2024 |
| Current share price | ~$42.22 | 14 May 2026 |
Across the broader LIC sector, discounts to NTA compressed materially in 2024-2025, with entities such as AFIC and Argo moving from double-digit discounts to high-single-digit or small premia. SOL’s tighter pricing is consistent with that sector-wide trend, though the degree of premium to its last reported NAV warrants attention.
What the yield signal cannot tell you
The dividend yield comparison is a relative signal, not an intrinsic value calculation. It carries specific limitations that investors should weigh before acting on it.
- The five-year average yield (2.44%) covers 2021-2026, a period that included significant market volatility, and that baseline may itself be distorted
- A yield-based comparison cannot capture changes in portfolio composition, particularly WHSP’s growing private markets allocation, which may alter the earnings profile in ways the historical yield does not reflect
- The method does not account for franking credit value, which is material for Australian tax-resident investors receiving fully franked dividends
- For a more rigorous valuation, dividend yield comparison should be supplemented with a Dividend Discount Model (DDM) or discounted cashflow (DCF) analysis
The most current NAV per share from the HY26 results (released 26 March 2026) and an updated broker fair value estimate should be verified before any investment decision. The analysis here relies on the most recently available public figures, and the valuation picture may have shifted.
SOL at $42: a fair price for patience, not a bargain for momentum
The evidence converges on a coherent positioning. SOL’s yield at 2.23% sits below its 2.44% five-year average. The FY24 pre-tax NAV of $32.61 is well below the current share price. Analyst consensus through 2024-2025 consistently framed the stock as “around fair value.” The Morningstar estimate from December 2024, already dated, sits in the high $30s.
The dividend trajectory tells a more constructive story: 95 cents in FY24 rising to an annualised 107 cents through the FY25 final and HY26 interim, confirming the progressive policy that has held since 1903. The portfolio’s anchor holdings each carry defensible earnings stories, and the private markets expansion adds a diversification layer that the historical yield average does not fully capture.
For conservative, long-horizon, income-focused investors, SOL’s structural qualities remain compelling. The 120-year dividend record is a genuine differentiator, and the diversified portfolio reduces single-sector risk in a way that few ASX-listed vehicles can replicate.
The case for comparing ASX income securities against term deposits has sharpened in 2026, with the RBA cash rate at 4.35% now sitting only 188 basis points above SOL’s headline yield, a narrower spread than income investors have faced for much of the past decade.
At $42, the market is pricing SOL for quality. Investors willing to pay that price are buying patience and reliability. Those seeking a margin-of-safety entry or above-market capital growth may find the current valuation leaves limited room.
The bottom line for income investors weighing SOL in 2026
SOL’s yield sits 21 basis points below its five-year average, the share price has outpaced dividend growth over the past year, and analyst consensus positions the stock around fair value rather than at a discount. The most recent WHSP reporting event, the HY26 results released on 26 March 2026, and the company’s investor centre should be consulted for the most current NAV and dividend data before forming a position.
For the right investor profile, SOL’s structural qualities remain compelling even at a tighter valuation. The unbroken dividend record since 1903 and the diversified portfolio are real advantages; they are simply priced more fully today than they were a year ago.
For investors who already hold SOL and have watched the position grow 13% since the start of 2025, our dedicated guide to portfolio rebalancing after an equity rally walks through how to assess position drift, when a 5-percentage-point overshoot triggers a rebalance, and how to execute a reduction in a tax-efficient sequence.
This article is for informational purposes only and should not be considered financial advice. Investors should conduct their own research and consult with financial professionals before making investment decisions. Past performance does not guarantee future results.