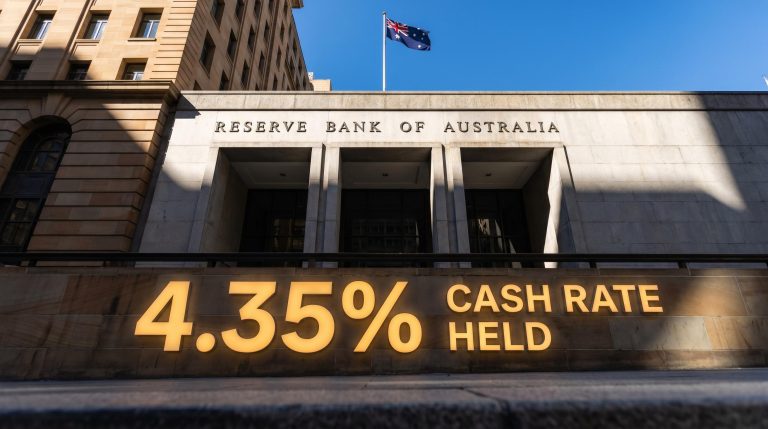
RBA Holds Cash Rate at 4.35% After Three Straight Hikes
4 hrs ago

Australia’s headline inflation rate surged to 4.6% year-on-year in March 2026, its highest reading in over a year. Yet that single figure conceals a more complicated story. The Australian Bureau of Statistics released Q1 2026 CPI data on 29 April 2026, landing just six days before the Reserve Bank of Australia’s 5 May board meeting and turning this quarter’s numbers into one of the most consequential data prints of the year. Money markets are pricing a 60% probability of a rate hike. The trimmed mean, the RBA’s preferred measure of underlying inflation, tells a quieter but arguably more durable story at 3.3%. What follows separates the signal from the noise: what drove the headline surge, why underlying inflation paints a different picture, and what the data means for household budgets and the RBA’s next move.
Headline CPI accelerated from 3.7% year-on-year in February 2026 to 4.6% in March 2026, a sharp one-month jump that dominated news coverage. The source of that acceleration, however, was overwhelmingly external.
The Middle East conflict that escalated in February 2026 pushed Brent crude to approximately $120 per barrel, and the price shock hit Australian motorists almost immediately. Transport costs rose 8.9% year-on-year, with automotive fuel accounting for the bulk of the category’s climb.
Automotive fuel costs surged 32.8% month-on-month in March 2026 alone, a single-category spike large enough to drag headline inflation more than a percentage point higher in one reading.
That figure predates any government response. The 4.6% headline is real, but its origin is geopolitical rather than a sign of domestic demand overheating.
The Australian Government halved the fuel excise effective 1 April 2026, with the cut running for three months until 30 June 2026. Because the measure took effect after the March quarter closed, it had no impact on the Q1 figures.
Early evidence of relief is visible. Adelaide petrol prices dropped approximately 24.9 cents per litre following the cut, and major city averages fell below $2.10 per litre by mid-April. This will provide mechanical downward pressure on headline CPI in Q2, though it does nothing to alter the structural inflation picture.
Strip away the fuel spike and the picture shifts. The trimmed mean CPI, which removes the most extreme price movements in both directions before calculating the average, came in at 3.3% year-on-year and 0.3% month-on-month in March 2026, unchanged from prior readings.
On a quarterly basis, the trimmed mean registered 0.8% for Q1 2026, placing the annual rate at 3.5%. That quarterly figure came in 0.1 percentage points below forecasts from NAB, consensus, and the RBA’s own February Statement on Monetary Policy.
| Measure | Q1 2026 Actual | NAB / Consensus Forecast | RBA SoMP Forecast |
|---|---|---|---|
| Quarterly trimmed mean (qoq) | 0.8% | 0.9% | 0.9% |
| Annual trimmed mean (yoy) | 3.3% | — | — |
| Monthly trimmed mean (mom) | 0.3% | — | — |
The stability of the trimmed mean is a double-edged signal. It confirms that the oil shock has not yet broadened across the consumer basket. But core inflation was already running at approximately 3.5% before the shock began, well above the RBA’s 2-3% target band, and roughly two-thirds of the CPI basket was rising at an annualised pace above 3% during Q1 2026. Stable, in this context, still means too high.
The trimmed mean strips out volatile movements by excluding:
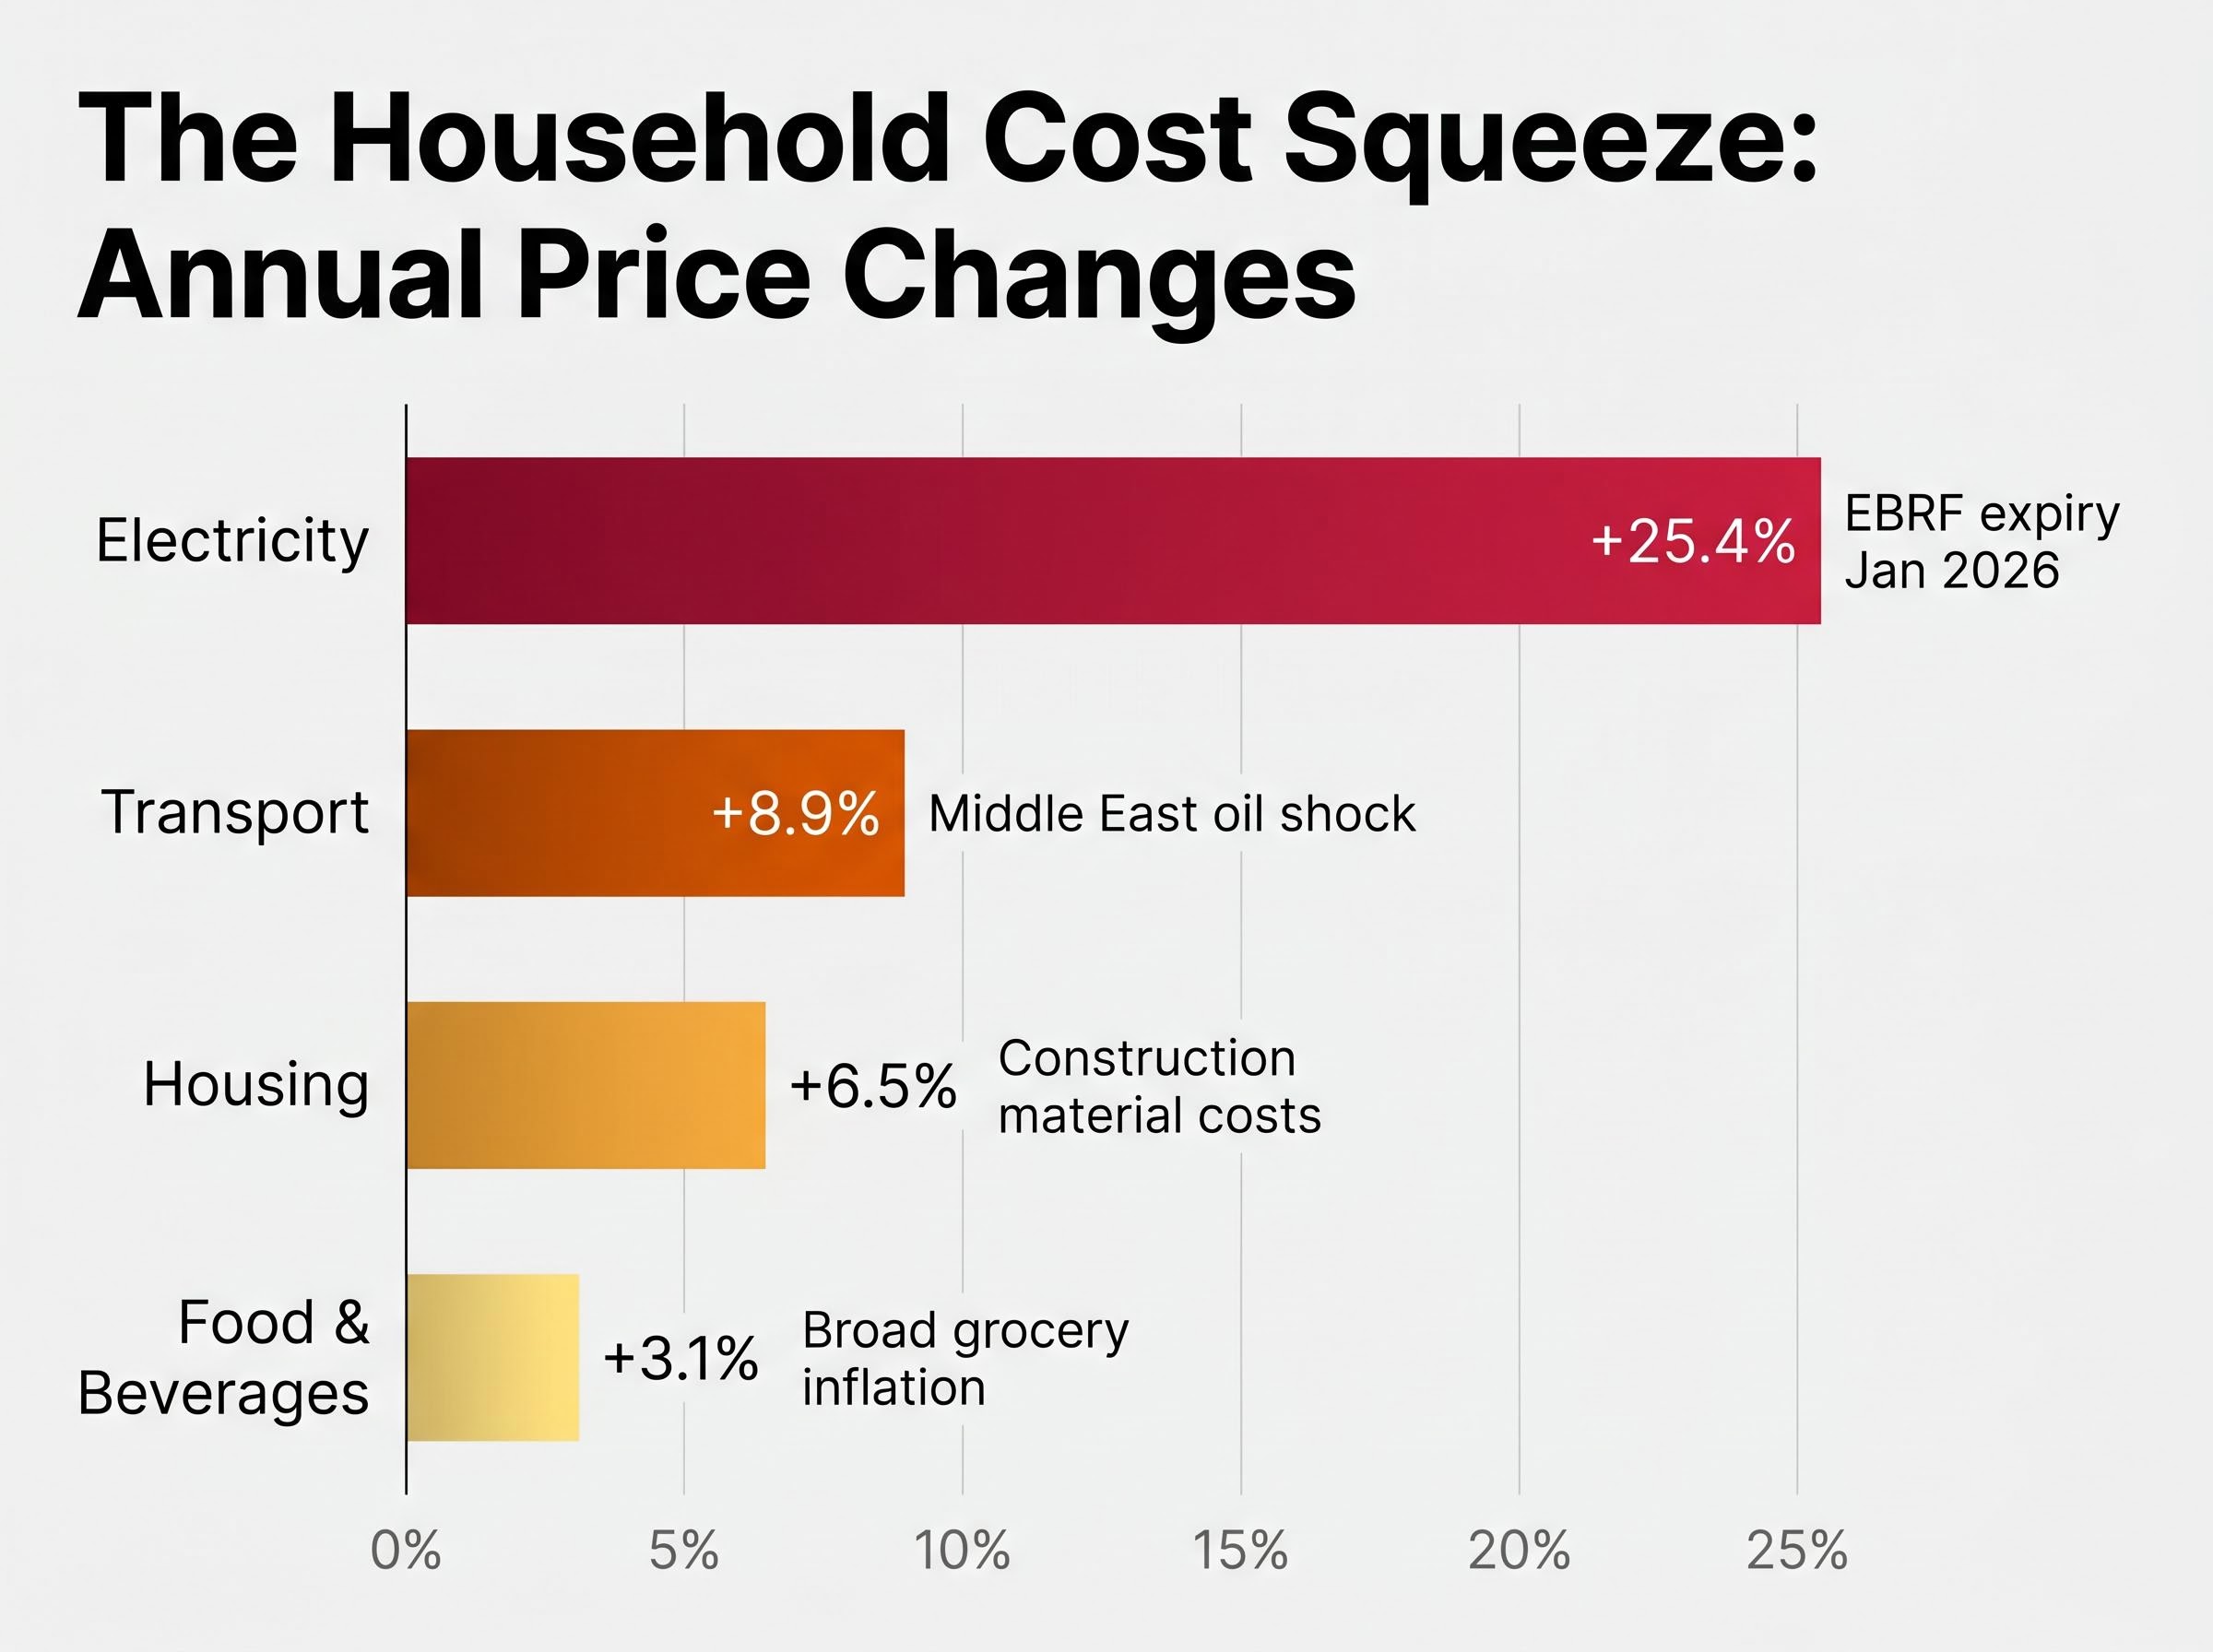
The statistical picture translates directly into household financial pressure. Four cost categories are squeezing budgets simultaneously.
Electricity prices rose 25.4% year-on-year, the single largest contributor to household cost-of-living stress in the March quarter, even though monthly prices were flat in March itself.
The dramatic annual electricity figure reflects the January 2026 surge that followed the expiry of the Energy Bill Relief Fund payments. The subsidy’s removal created a step-change in household energy costs that continues to compound on an annual basis.
Shelter inflation adds a second layer. Housing costs rose 6.5% year-on-year overall, though the detail is mixed: rent growth slowed to 0.2% month-on-month in March, but new dwelling purchase costs accelerated to 0.48% month-on-month, up from 0.15% in February. The acceleration partly reflects rising costs of oil-based construction materials flowing through to builder pricing.
| Category | Annual Change (yoy) | Monthly Detail | Key Driver |
|---|---|---|---|
| Electricity | +25.4% | 0% mom (March) | EBRF expiry in January 2026 |
| Transport | +8.9% | +32.8% mom (fuel) | Middle East oil shock |
| Housing | +6.5% | +0.48% mom (new dwellings) | Construction material costs |
| Food & beverages | +3.1% | — | Broad grocery inflation |
Together, these categories mean higher energy bills, elevated grocery costs, and sustained rent or mortgage stress for Australian households simultaneously.
The 5 May RBA meeting carries outsized weight, and the arguments on both sides are genuine.
Money markets are pricing approximately a 60% probability of a 25 basis point hike, which would lift the cash rate from 4.10% to 4.35%.
Westpac, CBA, and NAB have all confirmed forecasts of a May hike following the CPI release. Westpac goes further, projecting additional hikes in June and August to a terminal rate of 4.85%. NAB’s base case is one hike in May followed by an extended hold through mid-to-late 2027.
The case for hiking:
The case for holding:
The distinction between demand-pull versus cost-push inflation matters here: rate hikes are a blunt instrument designed to cool domestic spending, but they do relatively little to address a supply disruption originating in a geopolitical conflict thousands of kilometres away.
The RBA inflation target framework defines the 2-3% band as a medium-term average rather than a hard ceiling, meaning the board weighs the persistence of underlying pressures rather than reacting mechanically to any single quarterly print when assessing the need for policy action.
The decision directly affects variable mortgage rates for millions of Australians, making this one of the most closely watched board meetings in recent memory.
Two inflation numbers appeared across media coverage this week: 4.6% and 3.3%. The gap between them is not an error. It reflects two different ways of measuring the same phenomenon, and understanding the distinction is necessary for interpreting both the RBA’s language and the rate outlook.
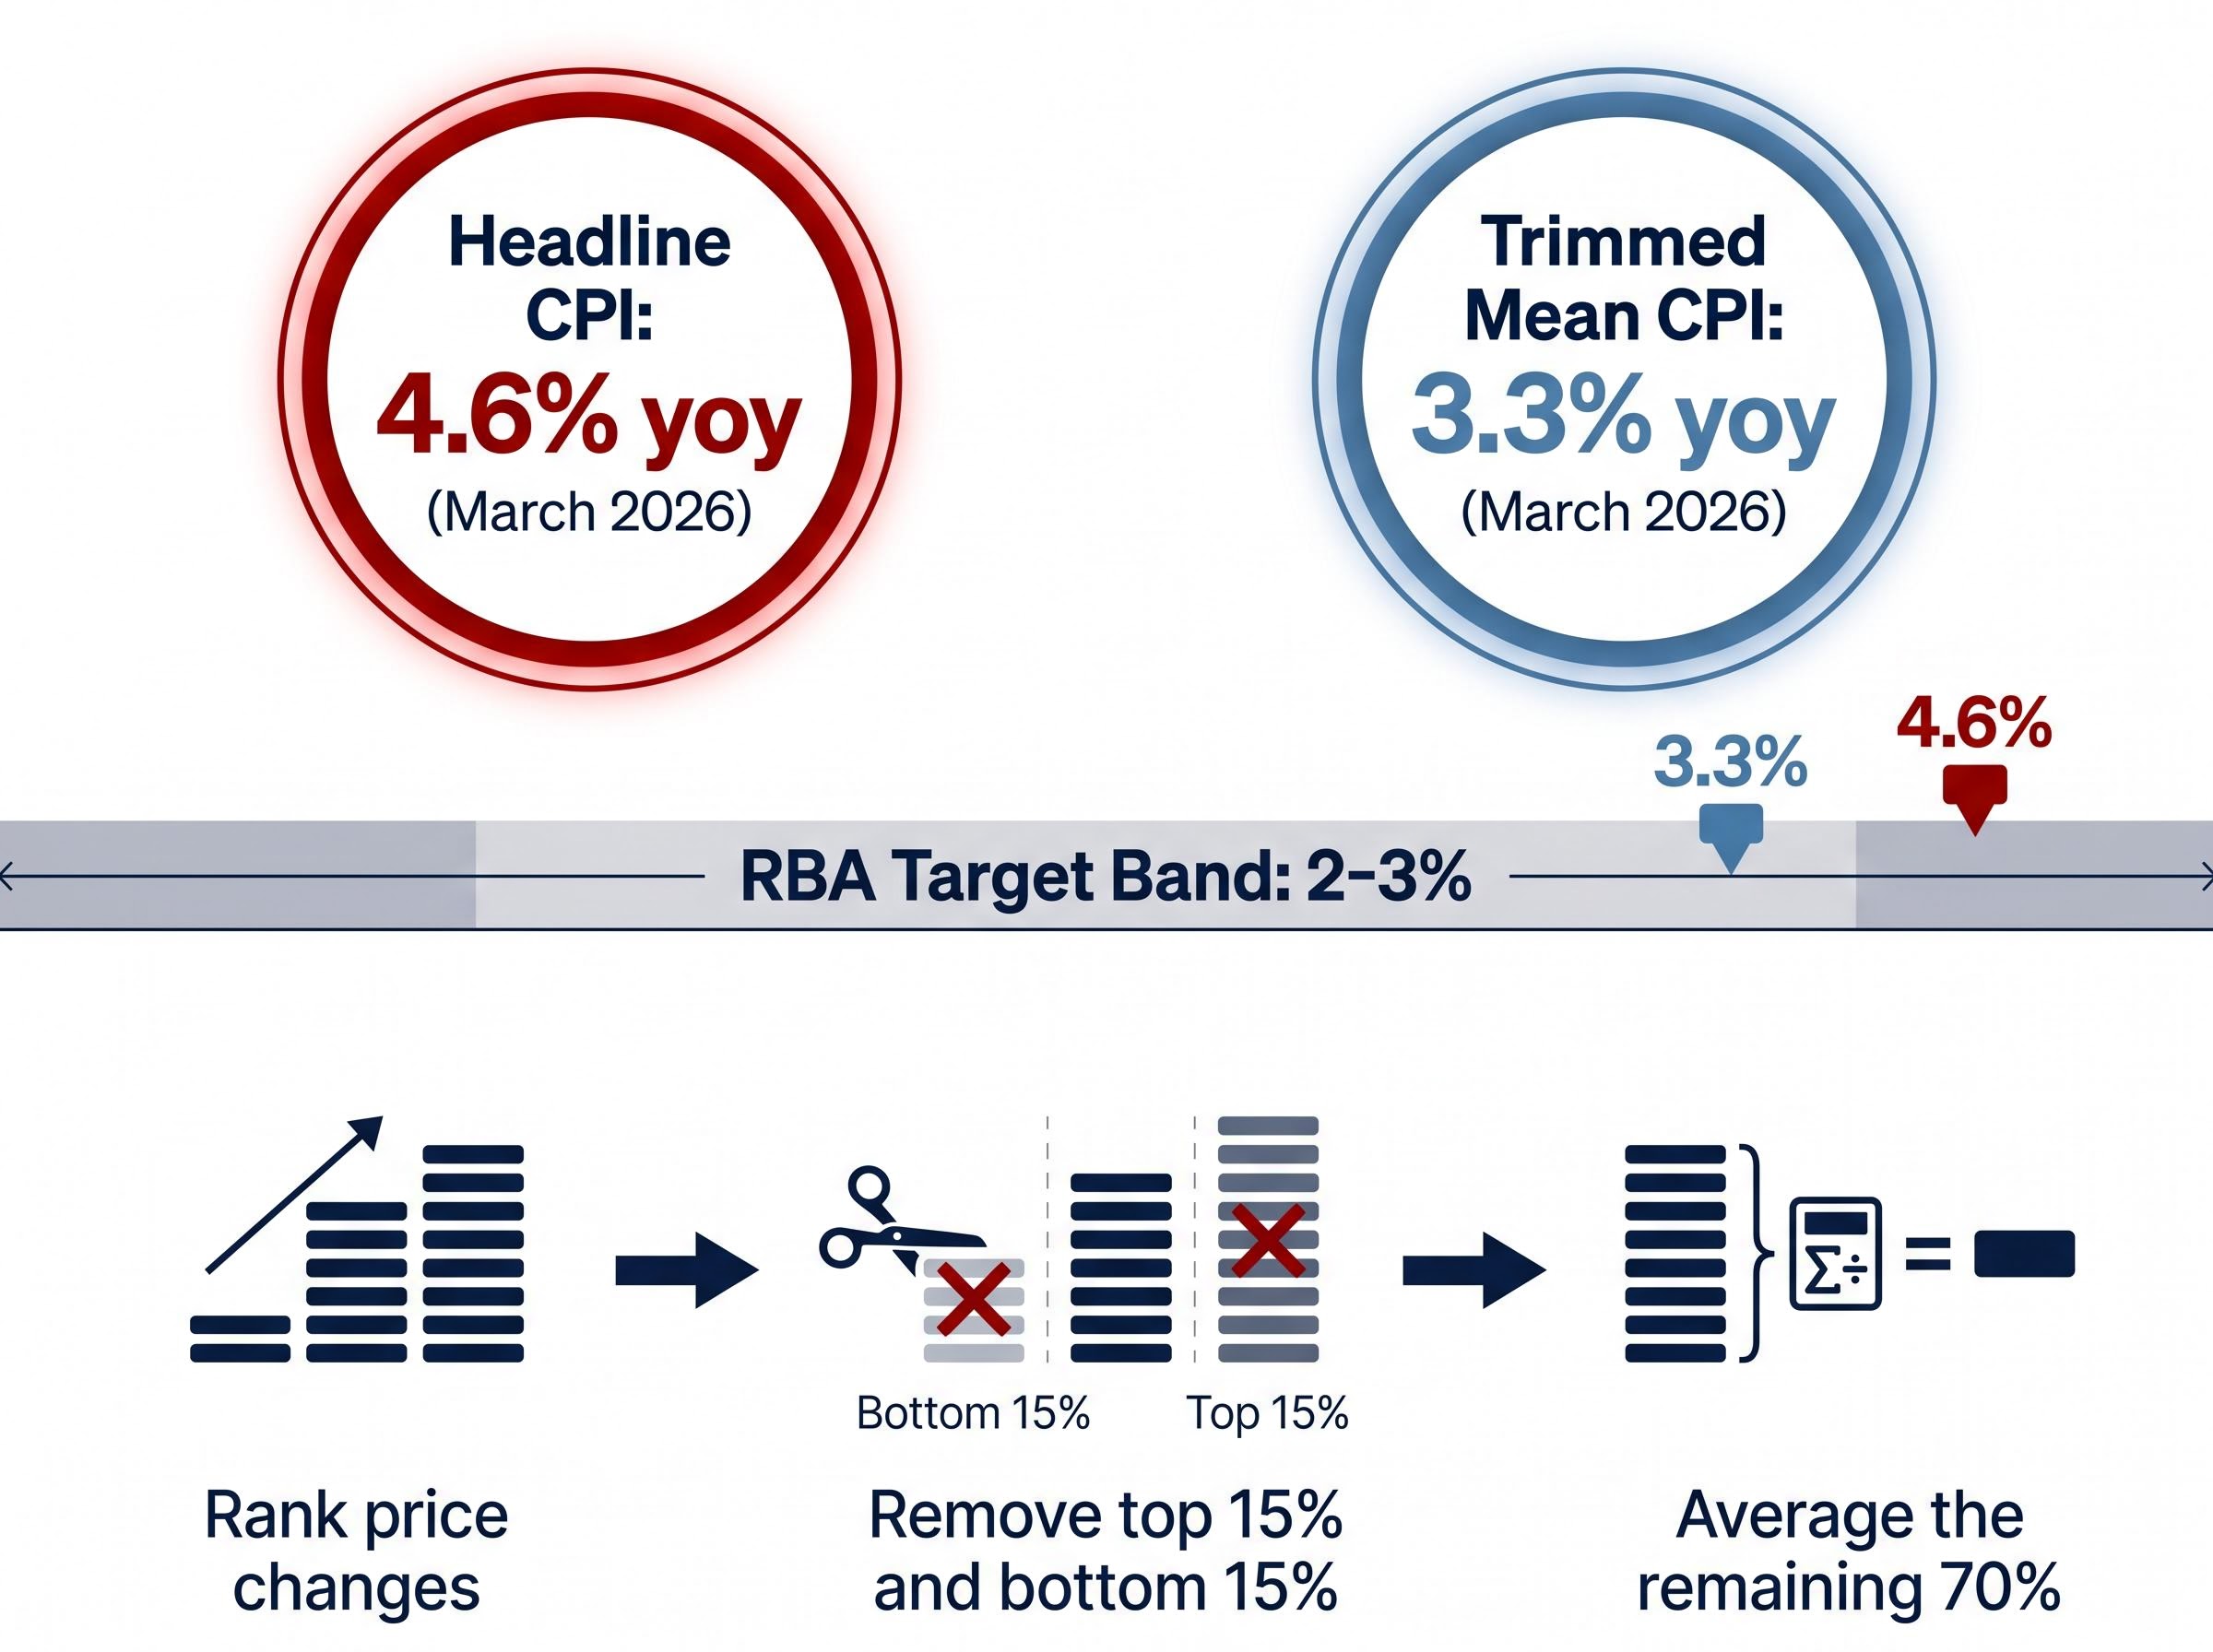
The trimmed mean CPI is calculated in three steps:
This approach filters out temporary or volatile price swings. A 32.8% monthly jump in fuel, for example, would be excluded precisely because it is extreme, allowing the trimmed mean to capture the persistent trend beneath the noise.
The RBA’s inflation target of 2-3% is expressed in terms of underlying inflation, not the headline figure. As of March 2026, the trimmed mean sits at 3.3%, still outside the target band and above 3% on one-month, three-month, and six-month annualised windows.
A separate measure, “CPI excluding volatile items,” takes a simpler approach by manually stripping out specific categories such as food and energy. This can introduce its own biases because the excluded categories are fixed regardless of conditions. The trimmed mean is statistically driven and adjusts dynamically each period, making it more robust across different types of economic shocks.
An RBA speech in February 2026 projected inflation peaking around mid-2026 before moderating. That forecast, however, predated the Middle East conflict and the oil shock escalation that followed.
Two forward-looking risks could sustain or worsen inflation through Q2 and Q3 2026:
Oil futures backwardation, where near-term contract prices sit well above longer-dated contracts, signals that institutional capital views the current supply disruption as temporary rather than a structural repricing, which partially offsets the case for aggressive tightening.
The World Bank commodity markets outlook published on 28 April 2026 projects Brent crude averaging in the $86-$115 per barrel range through the year, with the Middle East conflict identified as the primary supply disruption driving what it describes as the biggest energy price surge in four years.
Household inflation expectations reached 5.9% in April 2026, according to ANZ-Roy Morgan data. When expectations become unanchored from the target band, central banks face a significantly harder task bringing inflation down without aggressive tightening.
The Westpac-Melbourne Institute Consumer Sentiment Index fell 12.5% to 80.1 in April 2026, a two-and-a-half-year low, confirming that cost-of-living pressures are translating directly into household pessimism.
The 4.6% headline is the loudest number in this release, but it is not the one that will drive policy. The fuel shock that produced it is already partially reversing through the April excise cut, and its geopolitical origin places it largely outside the reach of monetary policy.
The 3.3% trimmed mean is quieter and more durable. Underlying inflation remains outside the RBA’s 2-3% target band, and approximately two-thirds of the CPI basket continues to rise above 3% on an annualised basis. That breadth of price pressure, not the fuel spike, is the structural concern the board cannot set aside.
Three dates now anchor the near-term outlook: the 5 May RBA decision, the 12 May Federal Budget, and the Q2 CPI data that will reveal whether the oil shock is generating second-round effects across the broader economy. The data does not cleanly dictate one path, and that ambiguity is precisely why the May meeting carries outsized significance for mortgage holders, investors, and policymakers alike.
Investors exploring the contrarian case will find our deep-dive into the RBA rate hike cycle peak, which examines historical oil shock episodes from the 1970s embargoes through the Volcker period, Oxford Economics modelling on potential GDP contractions, and the Taylor Rule implications of a single 25 basis point move.
Headline inflation loudly signals crisis. Underlying inflation quietly signals persistence. The RBA must decide which signal deserves the policy response.
This article is for informational purposes only and should not be considered financial advice. Investors should conduct their own research and consult with financial professionals before making investment decisions. Past performance does not guarantee future results. Financial projections are subject to market conditions and various risk factors.
The trimmed mean CPI removes the top 15% and bottom 15% of price changes by weight each period, then averages the remaining 70% to reveal the persistent underlying inflation trend. The RBA uses it because it filters out temporary spikes, such as the 32.8% monthly fuel surge in March 2026, to show whether inflation is structurally entrenched.
Australia's headline CPI rose to 4.6% year-on-year in March 2026, up sharply from 3.7% in February, largely due to a 32.8% monthly surge in automotive fuel costs linked to the Middle East conflict. The RBA's preferred trimmed mean measure came in at 3.3% annually, still above the 2-3% target band.
Money markets were pricing approximately a 60% probability of a 25 basis point hike at the 5 May RBA board meeting, which would lift the cash rate from 4.10% to 4.35%. Major banks including Westpac, CBA, and NAB all forecast a May hike following the Q1 2026 CPI release.
The Australian Government halved the fuel excise from 1 April 2026 for three months, after the March quarter had already closed, so it had no effect on the 4.6% headline reading. The cut is expected to mechanically reduce headline CPI in Q2 2026, with Adelaide petrol prices already falling around 24.9 cents per litre by mid-April.
Electricity prices surged 25.4% year-on-year following the expiry of the Energy Bill Relief Fund, transport costs rose 8.9% driven by fuel, housing costs climbed 6.5% with new dwelling costs accelerating, and food and beverages rose 3.1%, creating simultaneous budget pressure across multiple spending categories.