
The immediate friction point gripping Australian markets is the severe collision between surging domestic power bills and escalating global oil spikes. As of April 24, 2026, Brent crude has surged to $106.01 per barrel, while West Texas Intermediate trades aggressively between $98 and $101. This external energy shock arrived precisely as Australia recorded a March 2026 Consumer Price Index reading of 4.6%, creating an inflation outlook that has retail investors bracing for aggressive central bank intervention.
The core analytical tension dominating financial markets is the widespread fear of sustained interest rate hikes versus the underlying structural forces suggesting this panic is misdirected. A massive gap has opened between short-term commodity panic and long-term economic reality. Readers require a clear macroeconomic framework to separate temporary noise from the structural forces actually shaping the next decade of returns.
The Anatomy of the April 2026 Price Surge
The Middle East conflict has severely disrupted critical shipping routes, transmitting geopolitical friction directly into global commodity markets. This disruption immediately bleeds into domestic Australian prices through elevated refining margins and transport costs.
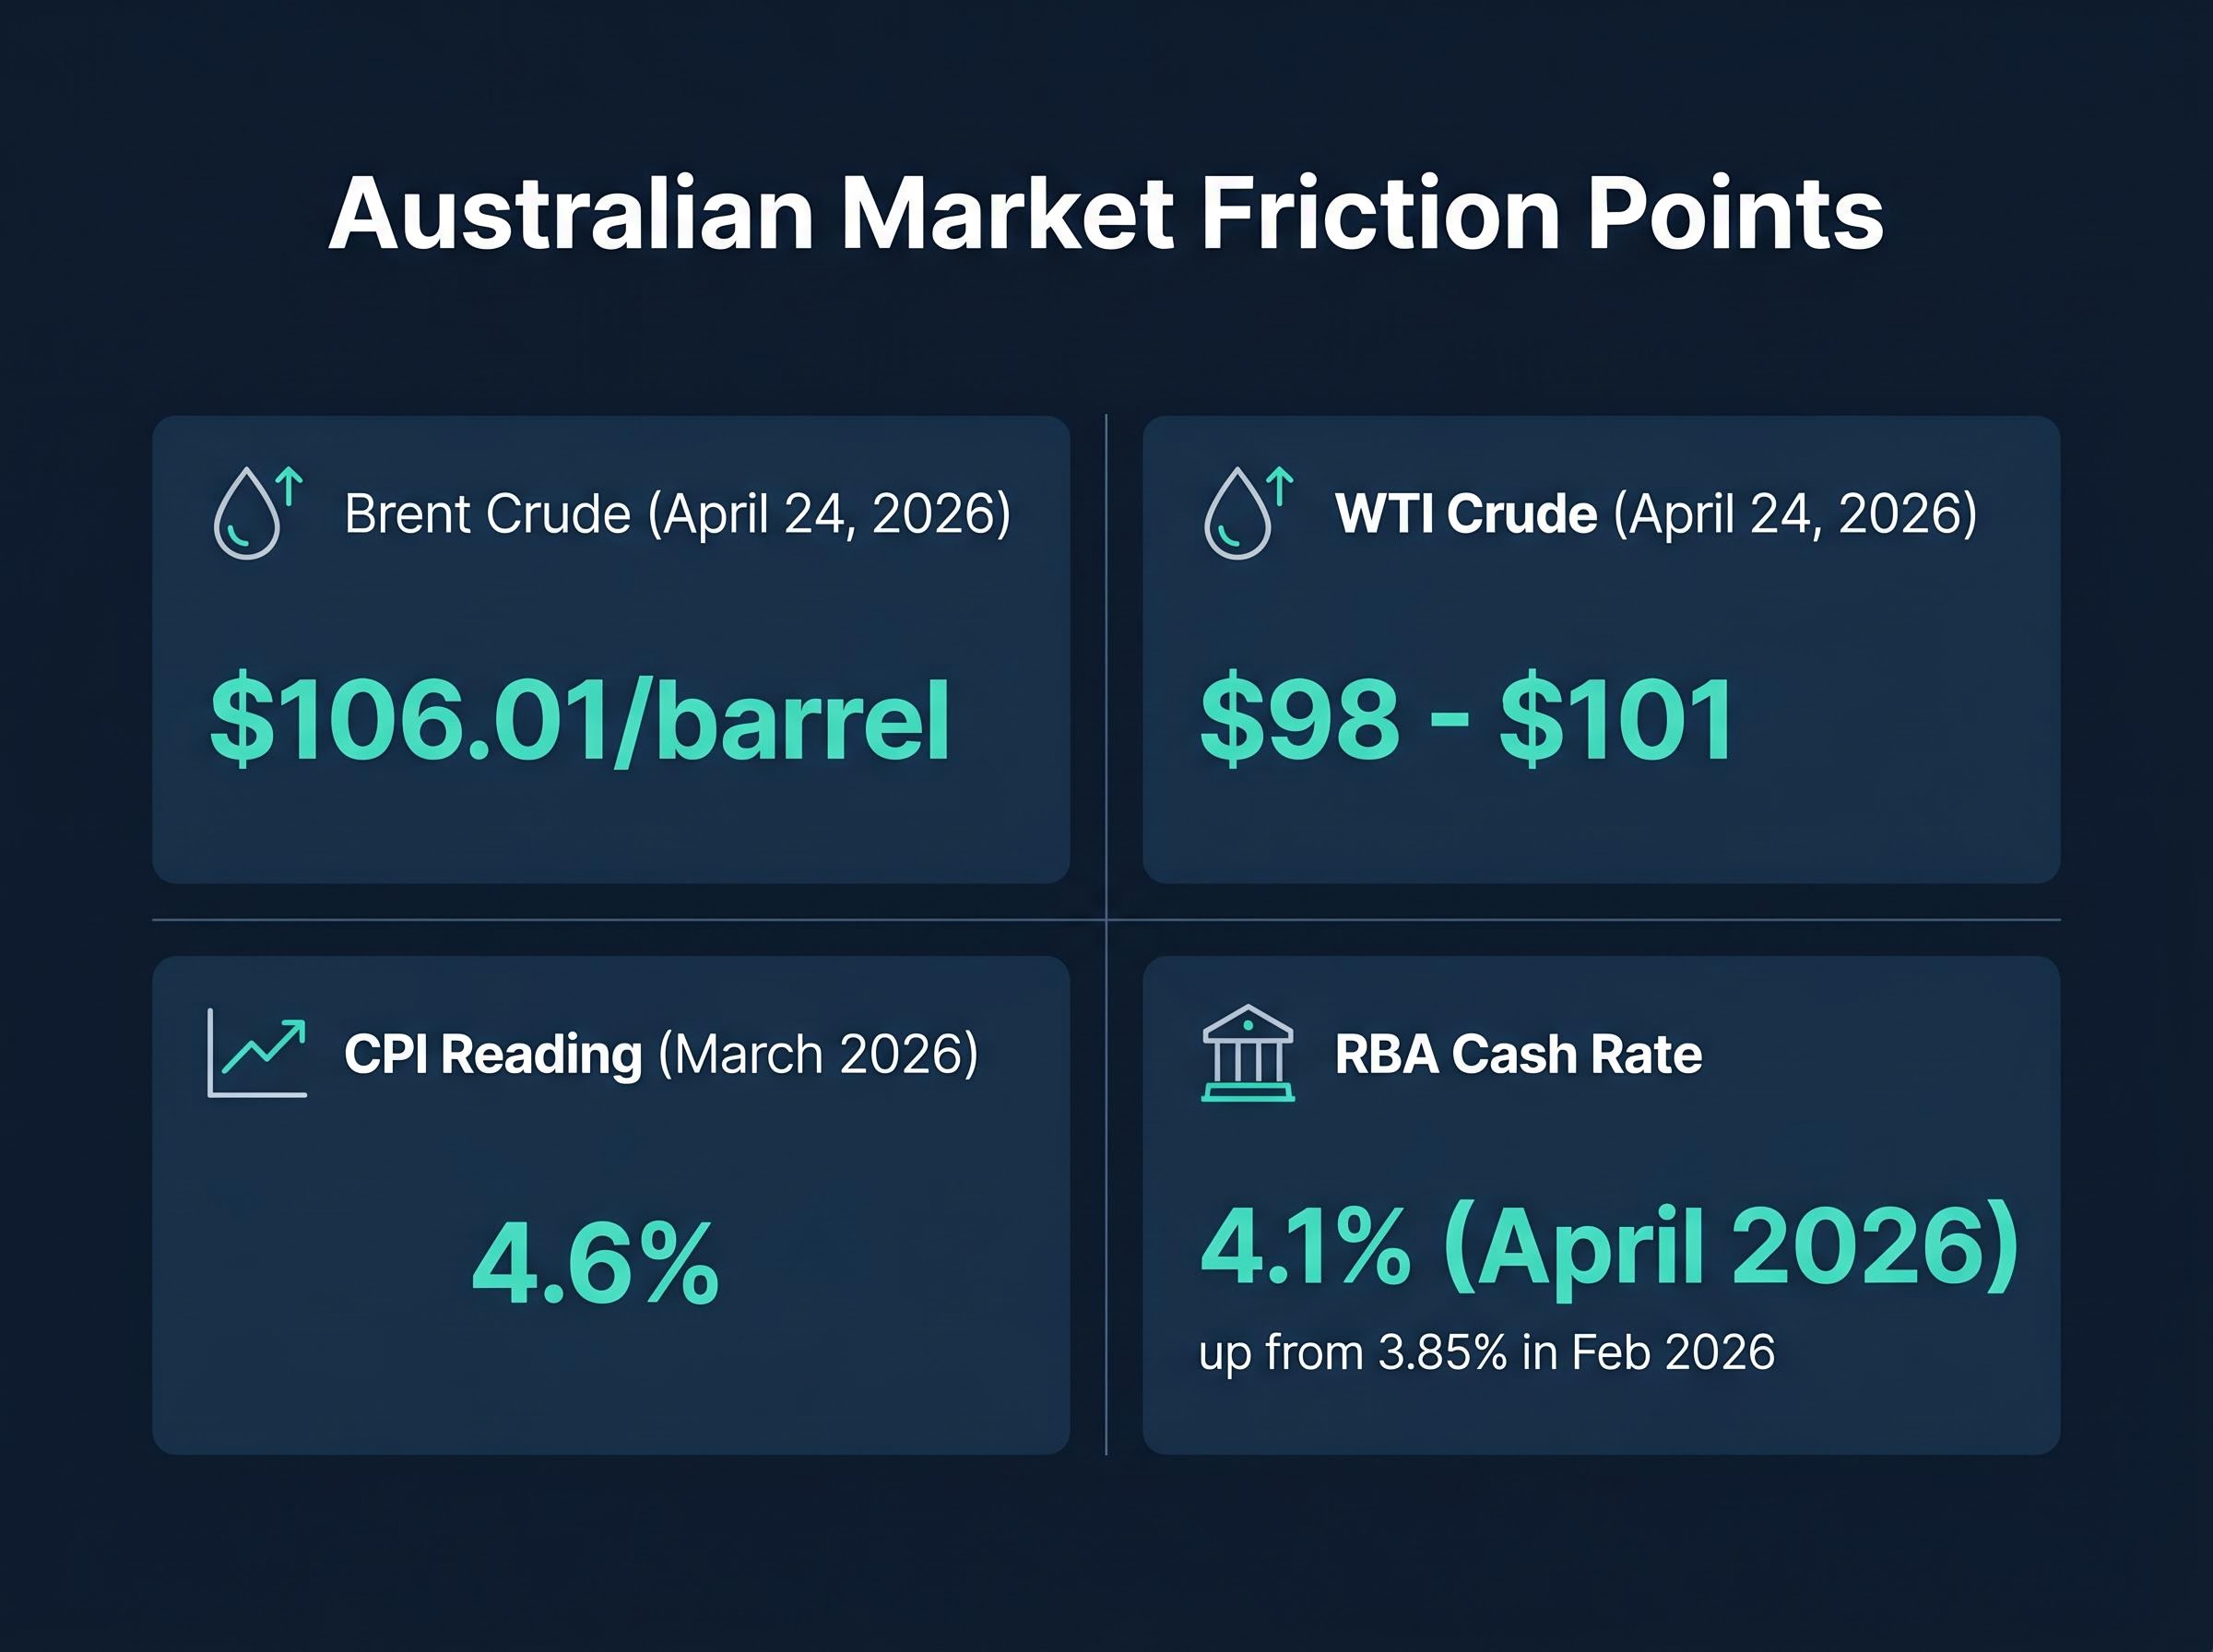
Domestically, these energy shocks are compounded by the expiration of government power bill rebates, exposing the true extent of underlying electricity cost increases. Driven by these compounding pressures, the Reserve Bank of Australia recently lifted the official cash rate to 4.1% in April 2026, following an earlier increase to 3.85% in February 2026.
The official RBA Statement on Monetary Policy details the initial underlying economic pressures that prompted this tightening cycle, framing the central bank’s early response to sticky inflation before the Middle East conflict fully materialised.
The clearest signal of short-term supply panic sits in the oil futures market. June WTI contracts are currently up 3.69%, creating a steep backwardation curve across the energy complex.
Commodity Backwardation A backwardation in futures markets occurs when near-term contracts trade at a premium to longer-dated ones. This pricing structure signals severe short-term supply panic, as buyers are willing to pay elevated prices for immediate delivery rather than wait for market stabilisation.
This pricing structure reveals exactly why portfolios are currently experiencing volatility. Traders are pricing this as a severe but contained supply disruption rather than a permanent new baseline for energy input costs. The RBA forecasts headline consumer prices to peak at 4.2% and underlying trimmed mean data at 3.7% in mid-2026, explaining the specific catalysts driving the hawkish headlines currently dominating the financial press.
When big ASX news breaks, our subscribers know first
How Modern Monetary Policy Differs from the 1980s
Understanding current central bank behaviour requires distinguishing between demand-side and supply-side price pressures. Demand-side increases occur when excess capital chases limited goods, while supply-side shocks happen when external events suddenly restrict critical inputs like oil or logistics.
The resulting erosion of purchasing power forces institutions to aggressively adjust benchmark rates, attempting to cool consumer demand without triggering a broader recession.
General price increases stem from specific, distinct economic imbalances:
Excess purchasing power outstripping supply capacity. Escalating production expenses, particularly in energy and raw materials. Currency depreciation increasing the cost of imported goods. Entrenched wage expectations driving a self-fulfilling price spiral.
Comparing the current macroeconomic environment to the aggressive tightening cycles of the 1970s and 1980s reveals fundamental differences in policy application. According to historical data, during the 1980 to 1982 period, the United States Federal Reserve aggressively crushed demand to reduce the prevailing rate from 14% to 3%, accepting unemployment exceeding 10% to achieve that goal.
Modern policymakers aim to avoid this exact scenario, recognising that destroying demand to fix a supply shock causes unnecessary economic damage. According to economic theory, monetary strategy now often incorporates frameworks like the Taylor Rule, which traditionally suggests a 1.5 percentage point rate hike for every 1 percentage point of excess price pressure.
However, resolving modern supply shocks forces central banks into a delicate balancing act. They must choose between inducing deliberate, painful recessions or allowing gradual capacity alignment over several years. This foundational knowledge is necessary for preventing panic selling during market drawdowns, demonstrating that the terrifying historical precedents of the 1980s do not neatly map to the methodical, data-driven monetary policy frameworks of 2026.
The Structural Counterweights Restraining Global Prices
While petrol pumps display the immediate energy shock, massive structural forces are quietly pushing global prices downward. These long-term deflationary counterweights are currently battling the short-term commodity spikes for dominance in the broader economy. Investors who look past next month’s consumer price print will see two distinct trends reshaping import pricing over the coming decade.
Artificial Intelligence as a Productivity Anchor
Artificial intelligence integration has emerged as a complex, dual-edged structural force in the Australian economy. As of 2025, AI technologies contribute $21 billion annually to the national economy, acting as a massive deflationary anchor. The integration of machine learning into logistical routing and inventory management alone has shaved critical percentage points off enterprise operating expenses.
Detailed McKinsey digital productivity analysis projects these generative systems could increase Australian labour efficiency by up to 1.1 percentage points annually through 2030, fundamentally shifting long-term corporate cost structures.
Corporate adoption is yielding tangible results, with 61% of companies reporting measurable operational efficiency improvements. These productivity gains provide a natural brake on wage-spiral risks by allowing businesses to maintain margins without aggressively raising end-consumer prices. However, the resulting unemployment pressures from corporate automation are compounding the economic strain already caused by higher fuel costs.
Supply Chain Rebalancing and Asian Export Dynamics
International trade shifts are fundamentally altering import pricing dynamics for Australia. Persistent economic overcapacity in China continues to export deflation to the rest of the world, as manufacturers aggressively discount goods to maintain domestic production volumes.
Simultaneously, recent United States tariff resets implemented across 2025 and 2026 have significantly impacted Southeast Asia, bringing reduced tariff rates to around 19% to 20%. Global trade patterns have largely adjusted to these conditions, presenting the potential to lower import prices for Australian consumers despite the volatility in energy markets. The net deflationary impact remains mixed, but the sheer volume of discounted Asian exports provides a crucial buffer against domestic capacity constraints.
Synthesising the Forward Rate Trajectory
Financial markets are currently forcing investors to reconcile conflicting data points into a coherent understanding of where Australian interest rates are actually heading. Forward-looking pricing via ASX futures indicates a 74% expectation of an interest rate change for the May 2026 contract.
Despite this immediate hawkish pricing, underlying futures signals regarding the temporary energy shock suggest that institutional capital anticipates an eventual normalisation of supply chains by early 2027.
Commercial banks anticipate aggressive pre-emptive tightening based on tight economic capacity and ongoing geopolitical conflicts. Westpac forecasts three additional 25-basis-point hikes between May and August 2026, which would bring the cash rate to 4.85%. This commercial consensus also projects trimmed mean data to peak at 4.0% by the end of 2026.
However, these aggressive commercial bank forecasts contrast sharply against the central bank’s stated medium-term policy expectations. Historical patterns suggest commodity-driven price spikes typically lead to brief, rather than sustained, monetary tightening.
In a February 2026 address, Michael Plumb, RBA Head of Economic Analysis, outlined the central bank’s internal expectations. He noted that despite elevated unit labour costs and high business capacity utilisation, inflation should eventually moderate to above the 2% to 3% target midpoint by mid-2028.
Weighing the structural economic headwinds against the immediate energy shocks determines the most probable rate path, translating complex competing theories into a concrete forecast that directly impacts mortgage rates and corporate valuations.
| Economic Metric | RBA Target/Forecast | Commercial Bank Consensus (Westpac) |
|---|---|---|
| Peak Trimmed Mean Inflation | 3.7% (mid-2026) | 4.0% (end-2026) |
| Cash Rate Trajectory | Gradual capacity alignment | 4.85% peak (August 2026) |
| Target Return Timeline | above the 2-3% target midpoint by mid-2028 | Extended tightening cycle |
Defensive Asset Allocation for Australian Portfolios
Macroeconomic analysis must translate into actionable asset allocation, particularly during volatile transition periods. Investors navigating the lag between central bank actions and economic realities require disciplined capital protection. Holding corporations with strong balance sheets and established pricing power remains the most reliable defence against margin compression.
Identifying companies with specific defensive characteristics like high return on equity and minimal debt is essential for effectively protecting ASX portfolio allocations against elevated input costs.
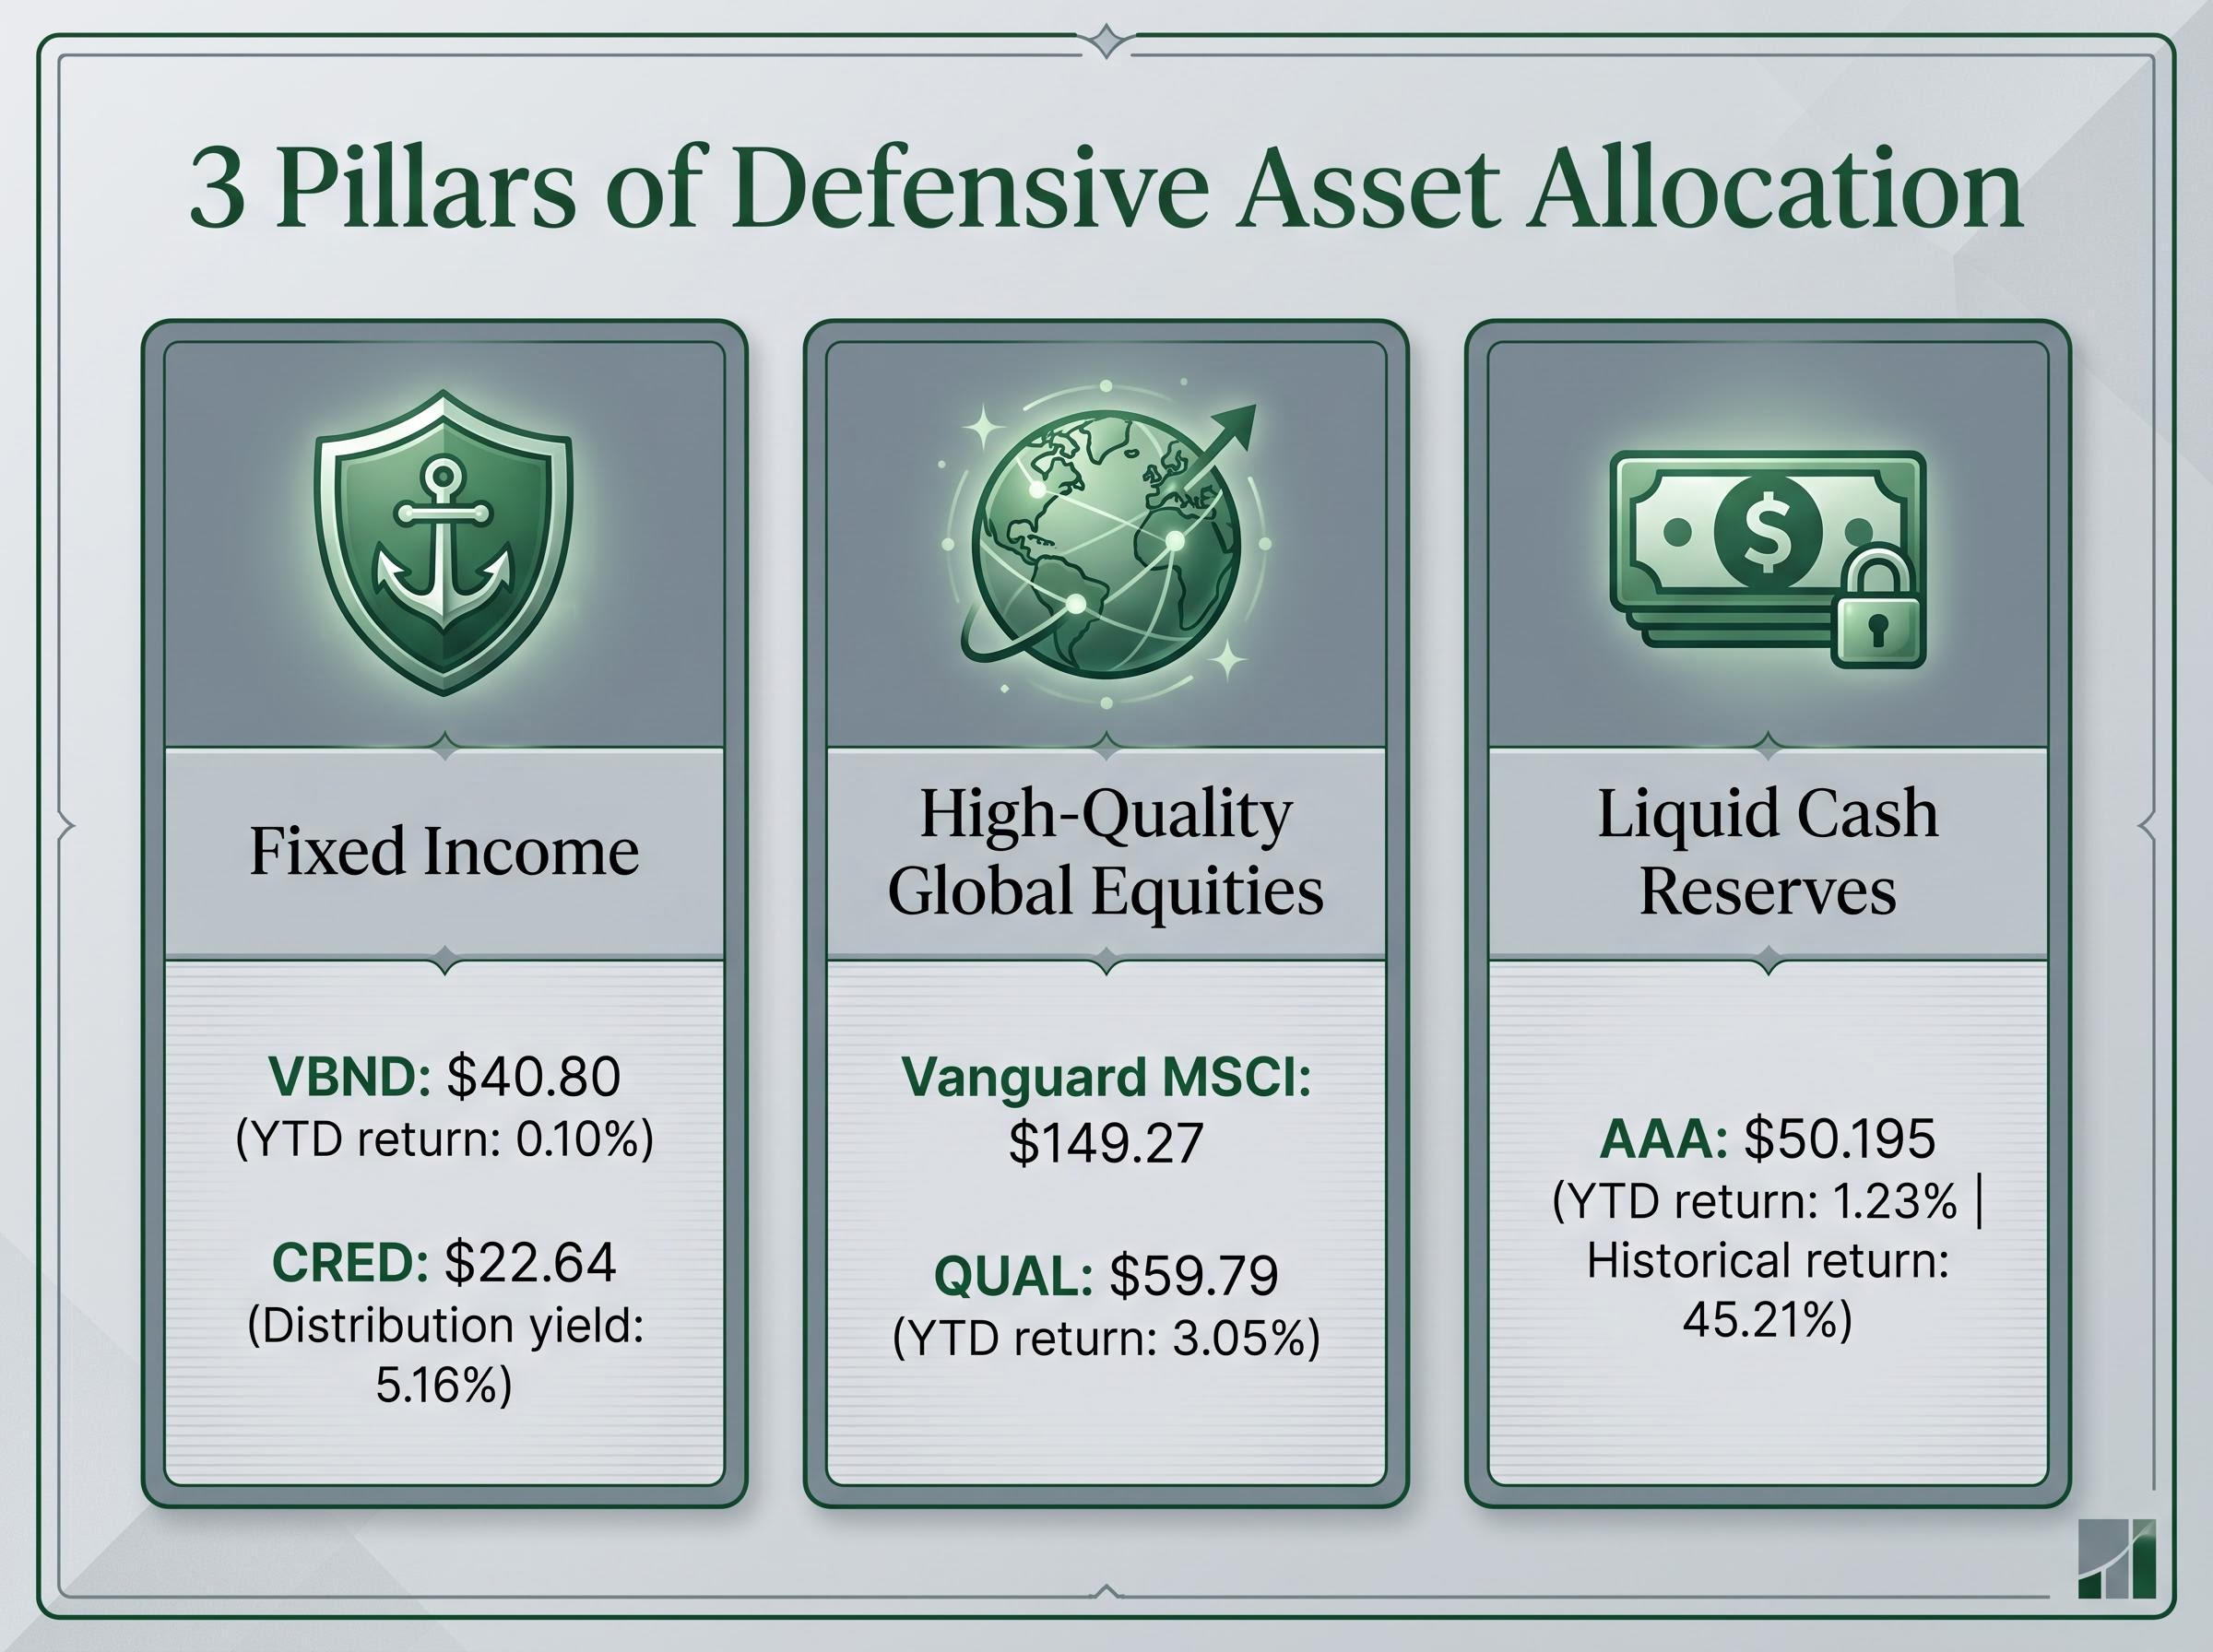
Australian portfolios can achieve this defensive positioning through three distinct allocation pillars:
- Fixed Income: The Vanguard Australian Corporate Fixed Interest Index ETF (VBND) offers baseline stability, currently priced at $40.80 with a year-to-date return of 0.10%. For higher yield generation, the BetaShares Australian Investment Grade Corporate Bond ETF (CRED) provides a distribution yield of 5.16% at a price of $22.64.
- High-Quality Global Equities: The Vanguard MSCI Index International Shares ETF provides broad exposure at $149.27, while the VanEck MSCI International Quality ETF (QUAL) filters specifically for resilient balance sheets, delivering a year-to-date return of 3.05% at $59.79.
- Liquid Cash Reserves: The BetaShares Australian High Interest Cash ETF (AAA) provides capital protection at $50.195, boasting a historical total return of 45.21% and a year-to-date return of 1.23%.
These specific ticker-level examples transform high-level economic theory into immediately actionable financial steps for the projected environment.
The Final Verdict on 2026 Market Dynamics
The collision between immediate energy-driven price spikes and long-term technological efficiencies defines the current Australian market environment. While the Middle East conflict has undeniably elevated near-term supply costs, the structural deflationary headwinds of artificial intelligence and global manufacturing overcapacity will eventually overpower these temporary shocks.
Patience and strategic defensive positioning remain paramount. Central bank actions operate with significant lag times, and reactionary portfolio adjustments often destroy capital during these transitional windows. Diversified portfolios anchored by high-quality equities, investment-grade fixed income, and strategic cash reserves possess the resilience required to navigate the projected macroeconomic trajectory over the coming years.
Investors exploring international diversification can read our comprehensive walkthrough of 2026 asset allocation strategies, which details how to systematically capture discounted European and emerging market equities during this volatile window.
These statements are speculative and subject to change based on market developments and company performance. Past performance does not guarantee future results. Financial projections are subject to market conditions and various risk factors. This article is for informational purposes only and should not be considered financial advice. Investors should conduct their own research and consult with financial professionals before making investment decisions.