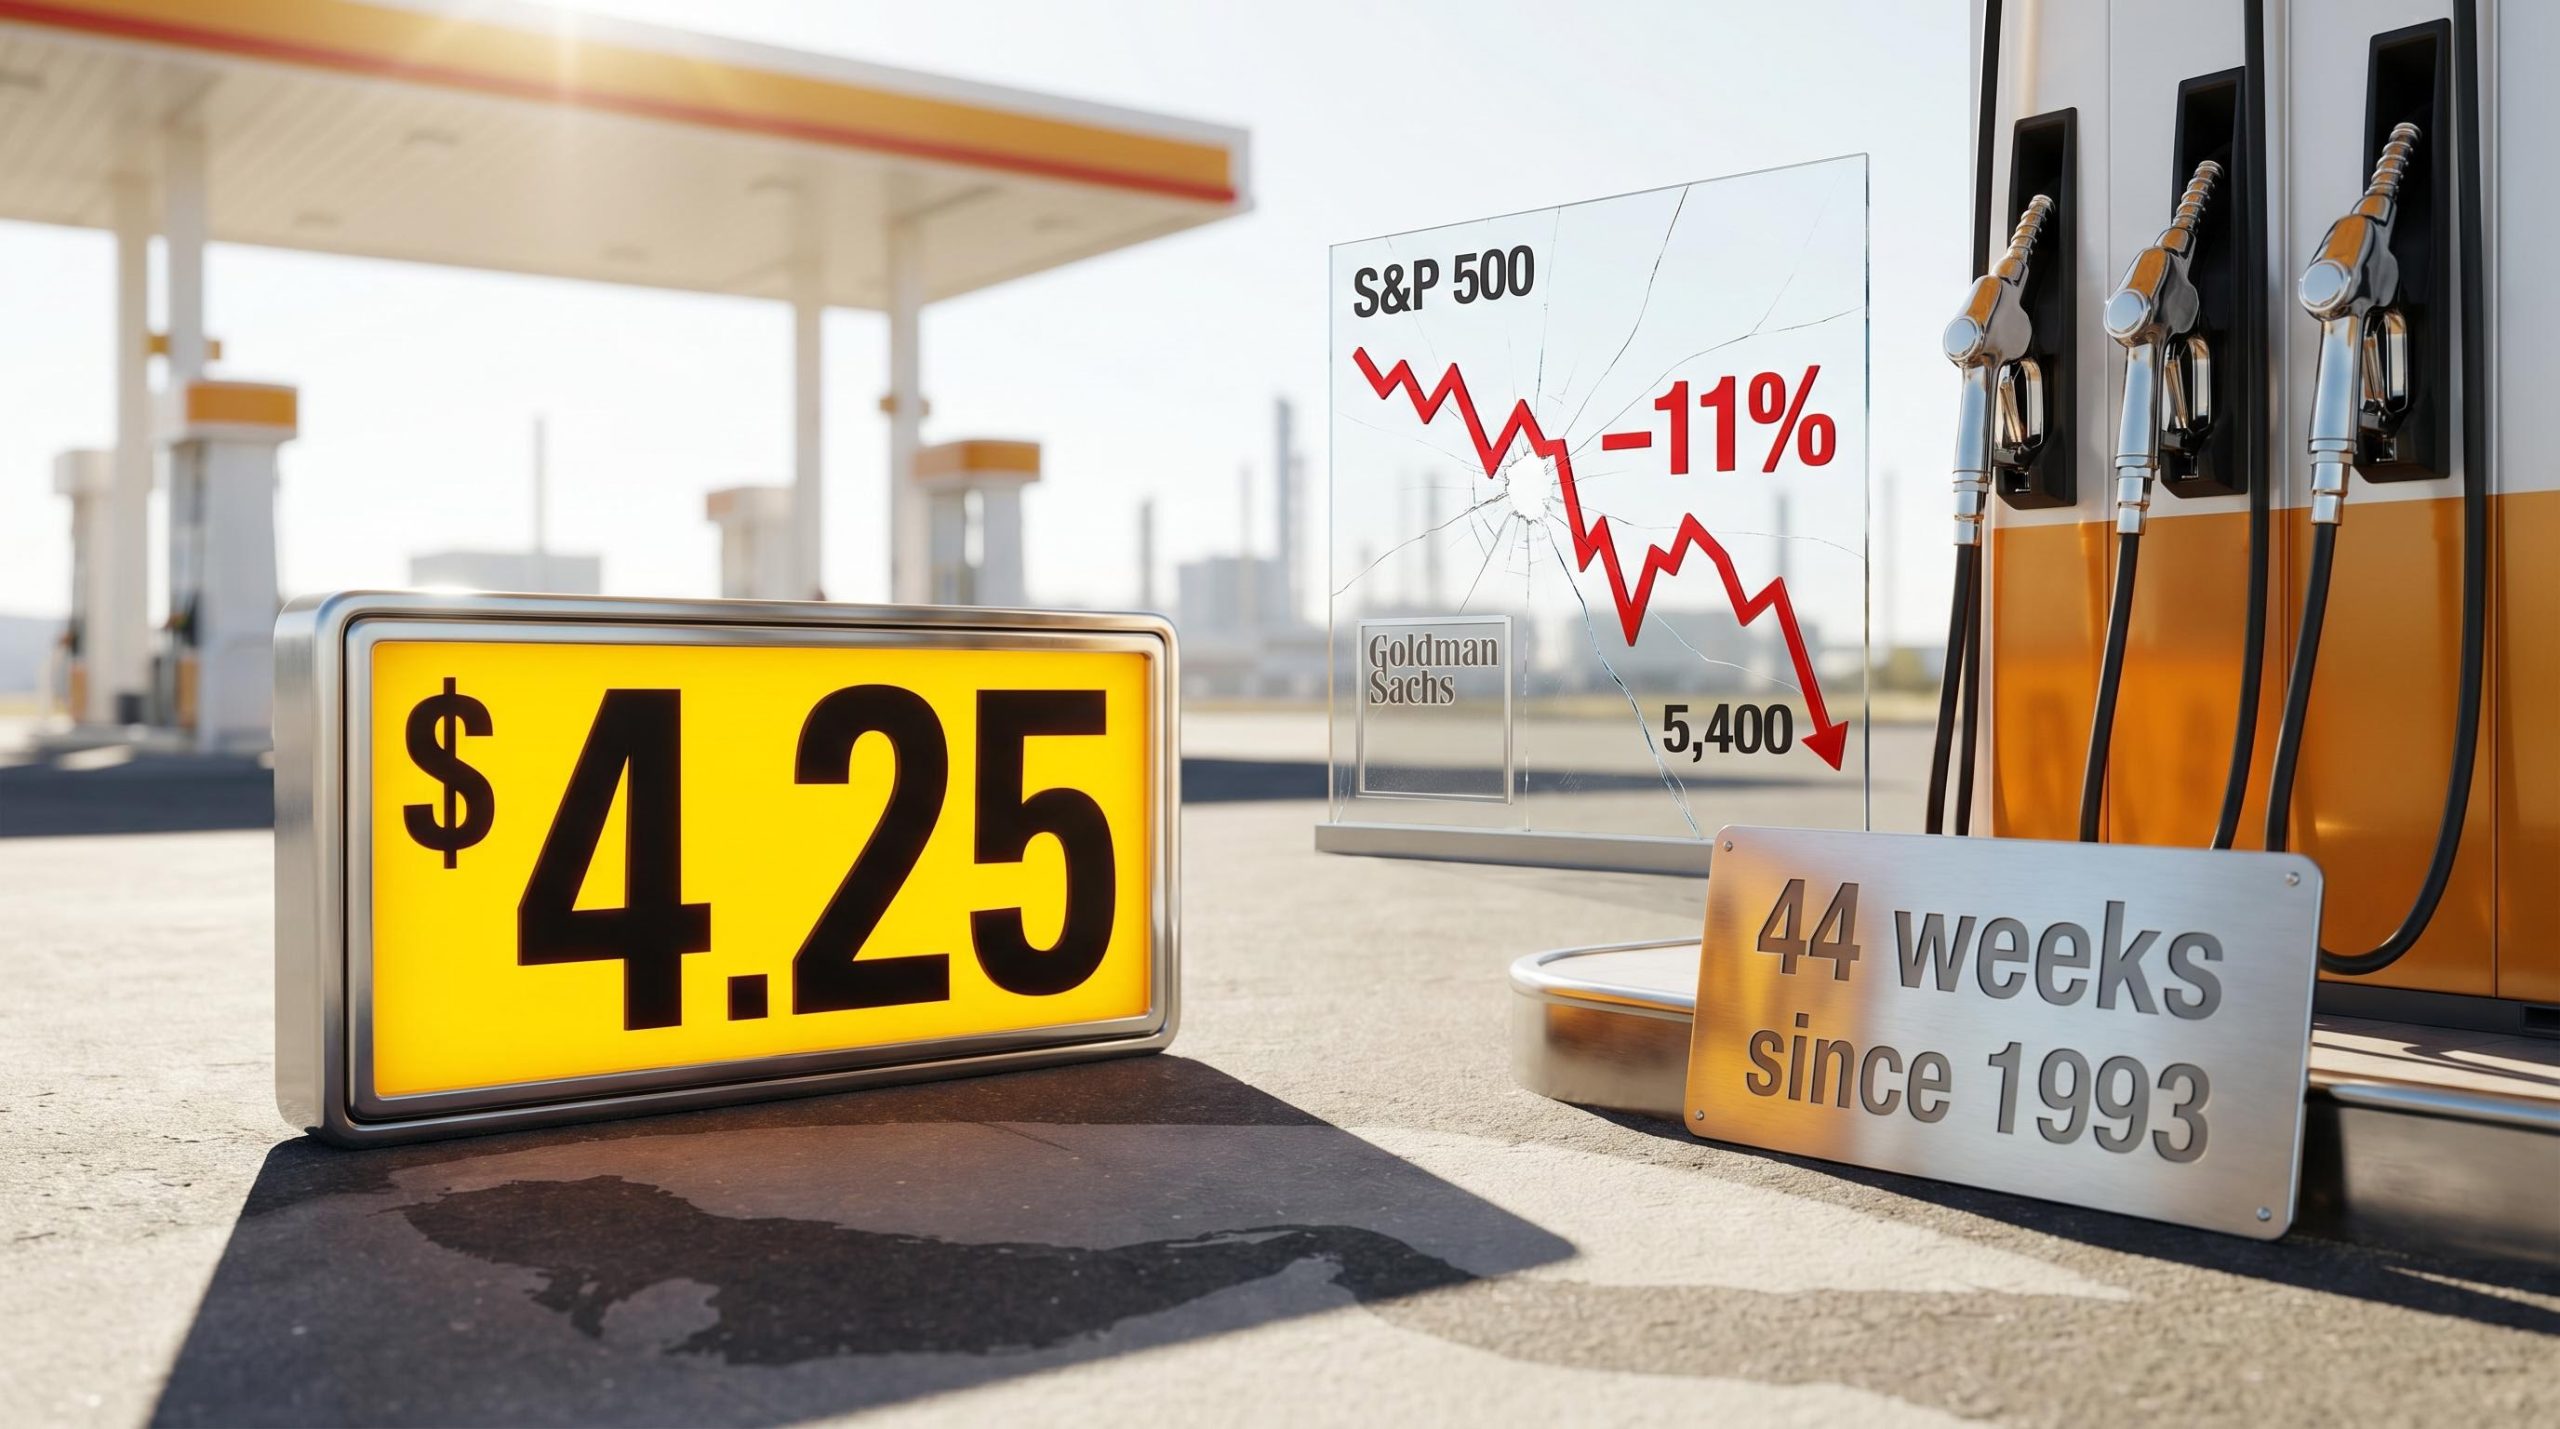
In only 44 weeks since 1993 has the U.S. national average gasoline price exceeded $4 a gallon. According to some market analyses, each time it did, the S&P 500 fell an average of 11% over the following six months. As of the week ending 27 April 2026, the national average hit $4.25 per gallon, and the clock on that six-month window has started again.
Fuel costs have risen roughly 45% since January 2026, driven by the Iran conflict and severe disruptions to Strait of Hormuz traffic. The S&P 500 already shed approximately 9% from its March peak before recovering, but the underlying energy shock remains unresolved. Goldman Sachs has flagged a downside scenario targeting 5,400 on the index under a severe oil shock. The gap between the market’s apparent calm and the signal flashing from the pump matters, and the historical record explains why.
What follows is an examination of why the $4 threshold is not an arbitrary number, how the transmission mechanism from gas prices to equity losses works, what the historical record shows across prior episodes, and what the current supply shock means for investors tracking the situation in real time.
Fuel costs have now crossed the threshold that has preceded every major equity selloff since 1993
The $4 national average is not a round number that commentators fixate on for convenience. It is a level that U.S. gasoline prices have reached in fewer than 3% of all weeks since 1993, making it among the rarest sustained price environments in modern energy markets.
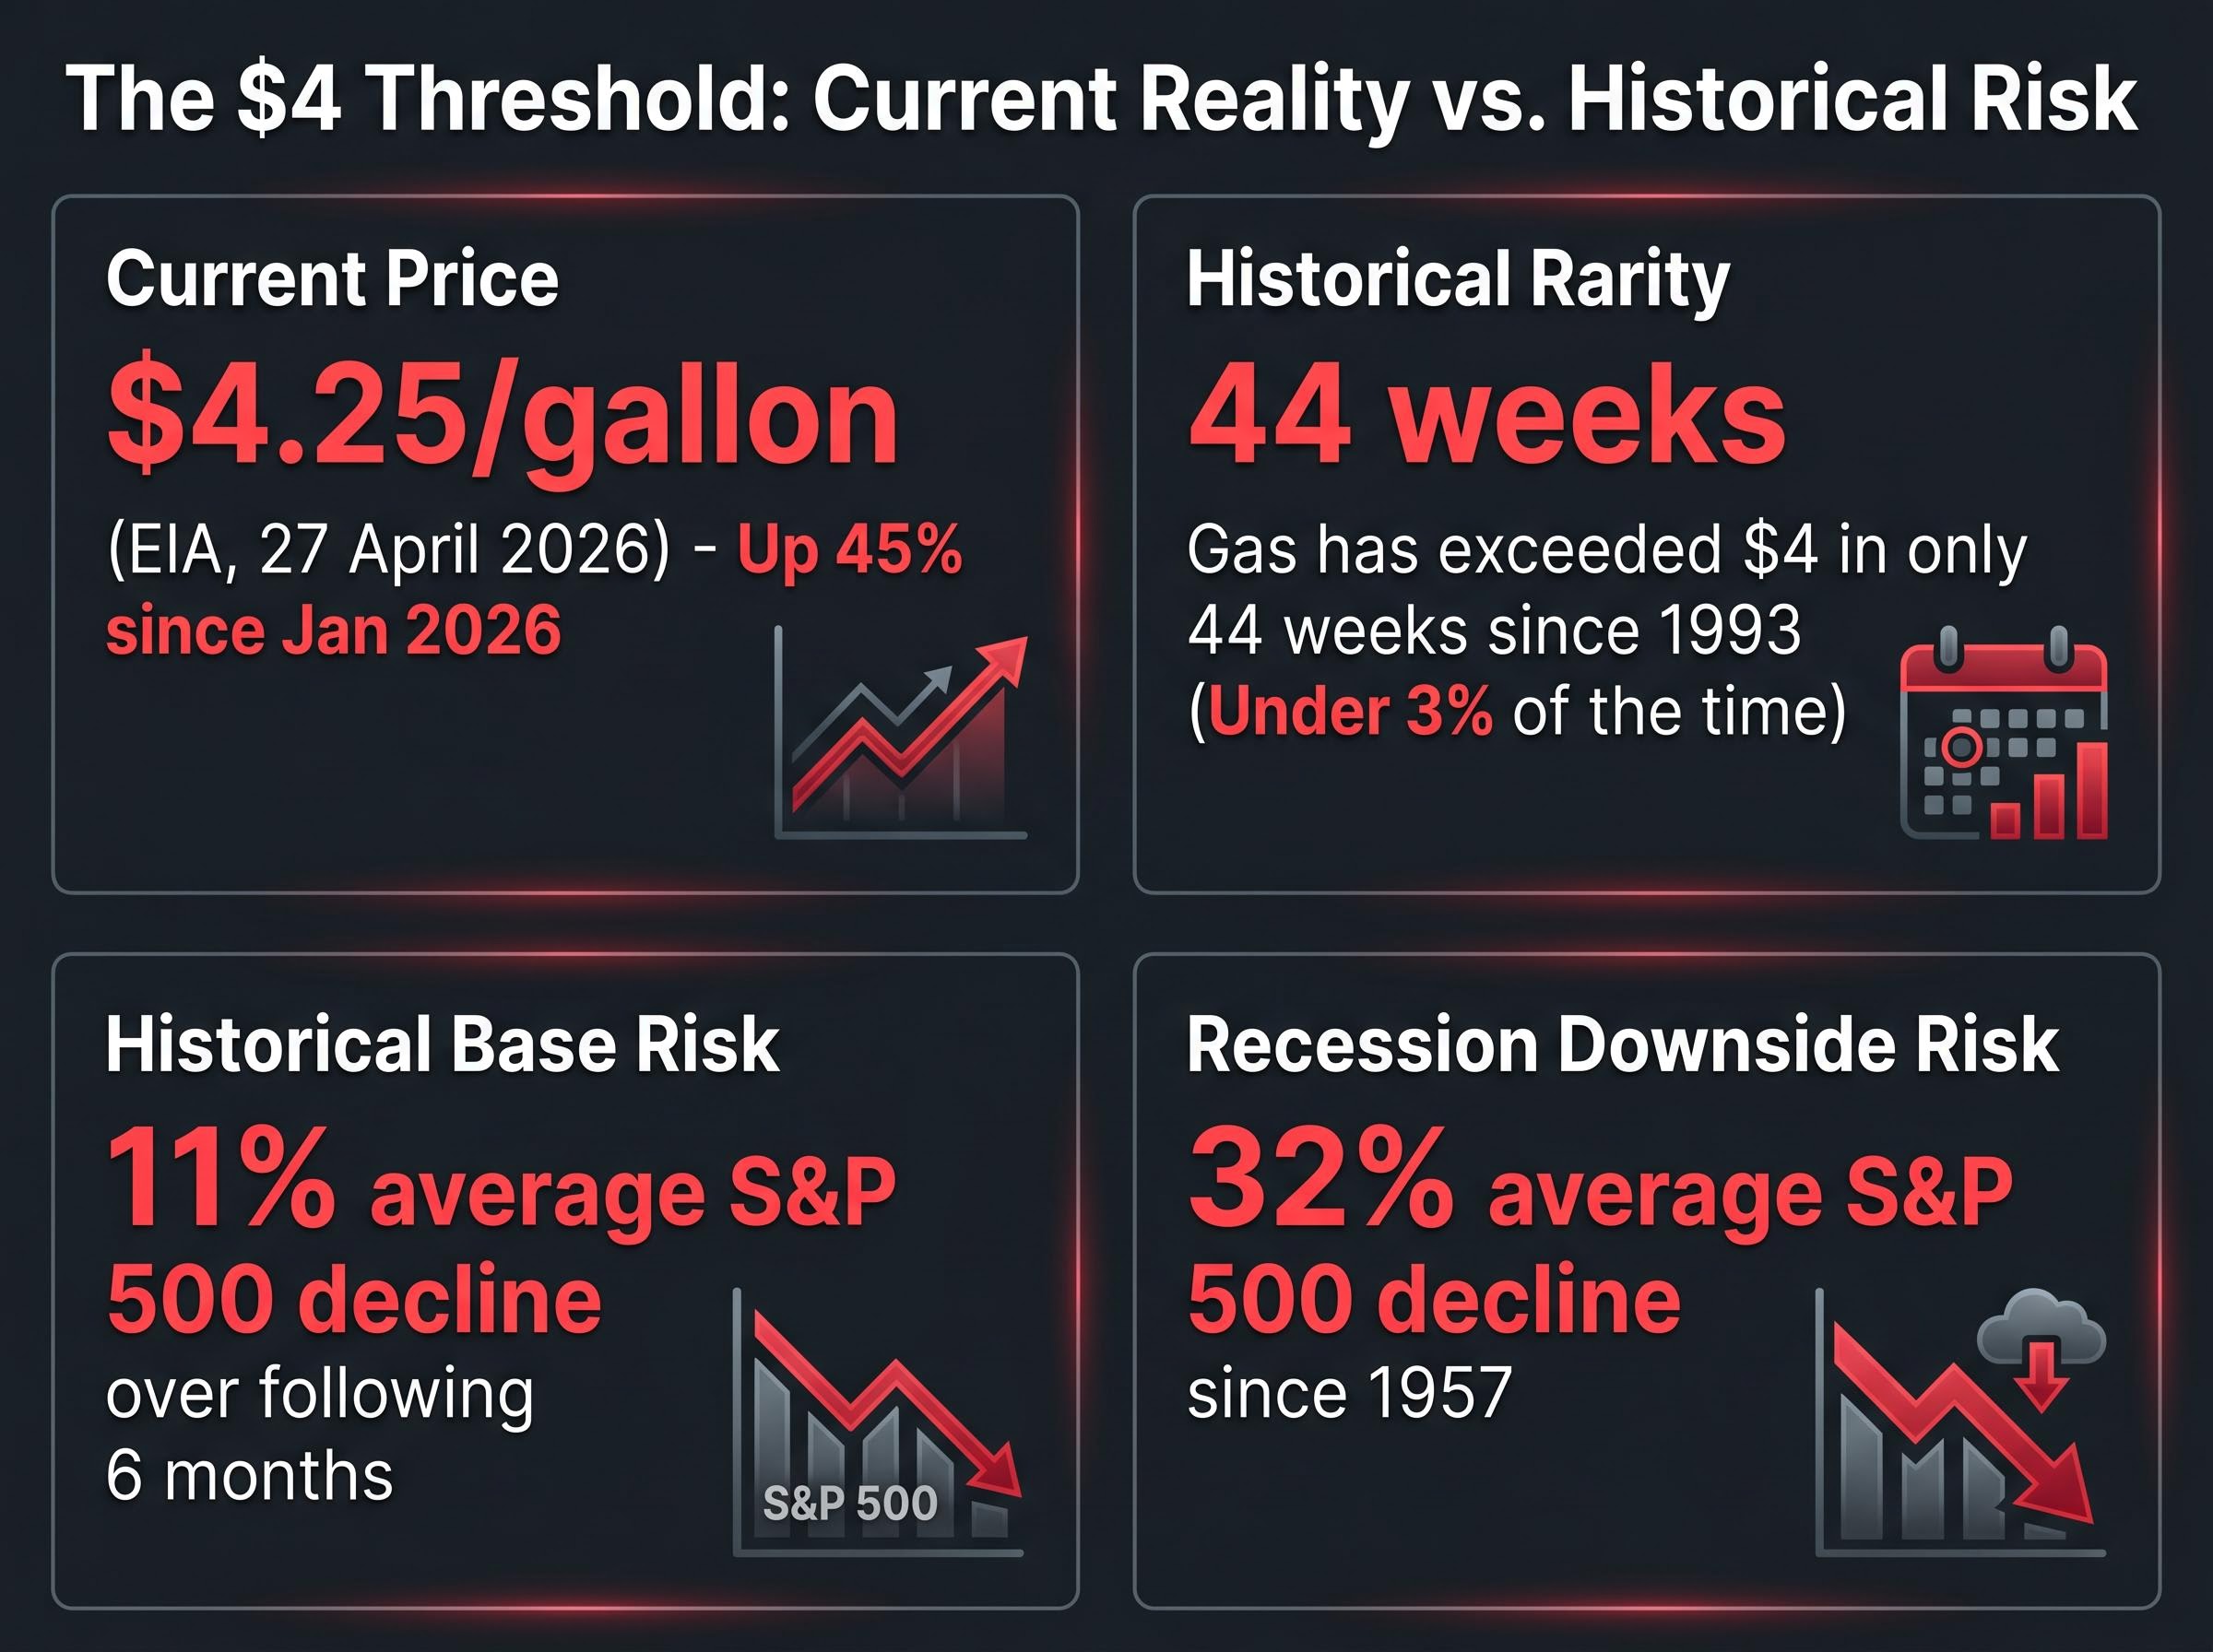
The current episode crossed that line on 2 April 2026, when AAA reported the national average exceeded $4 for the first time in four years. By 29 April 2026, the average stood at $4.229 per gallon. The Energy Information Administration’s (EIA) weekly reading for the period ending 27 April recorded $4.25 per gallon.
- National average gasoline price: $4.229/gallon (AAA, 29 April 2026)
- EIA weekly average: $4.25/gallon (week ending 27 April 2026)
- Year-to-date price increase: approximately 45% since January 2026
- Historical frequency above $4: only 44 weeks since 1993, under 3% of the total period
- Last comparable episode: August 2022, during the Ukraine invasion spike
Gasoline prices have exceeded $4 per gallon in only 44 weeks since 1993, under 3% of that period.
The rarity reframes the current reading. This is not a routine headline about consumer inconvenience. It is a data point that has historically preceded significant equity market weakness, and its appearance demands attention from investors rather than dismissal.
When big ASX news breaks, our subscribers know first
Why gasoline prices above $4 reliably signal trouble for equities
The relationship between elevated fuel costs and falling stock prices is not a statistical coincidence waiting to break down. It runs through the mechanism that drives the majority of U.S. economic output: consumer spending.
The transmission works through two channels simultaneously. The first is direct. When pump prices surge, household budgets compress. Money that would have gone to restaurants, retail, and discretionary services goes to fuel tanks instead. The second is indirect. Businesses absorb higher transportation and logistics costs, then pass them through to consumer prices, compressing demand further.
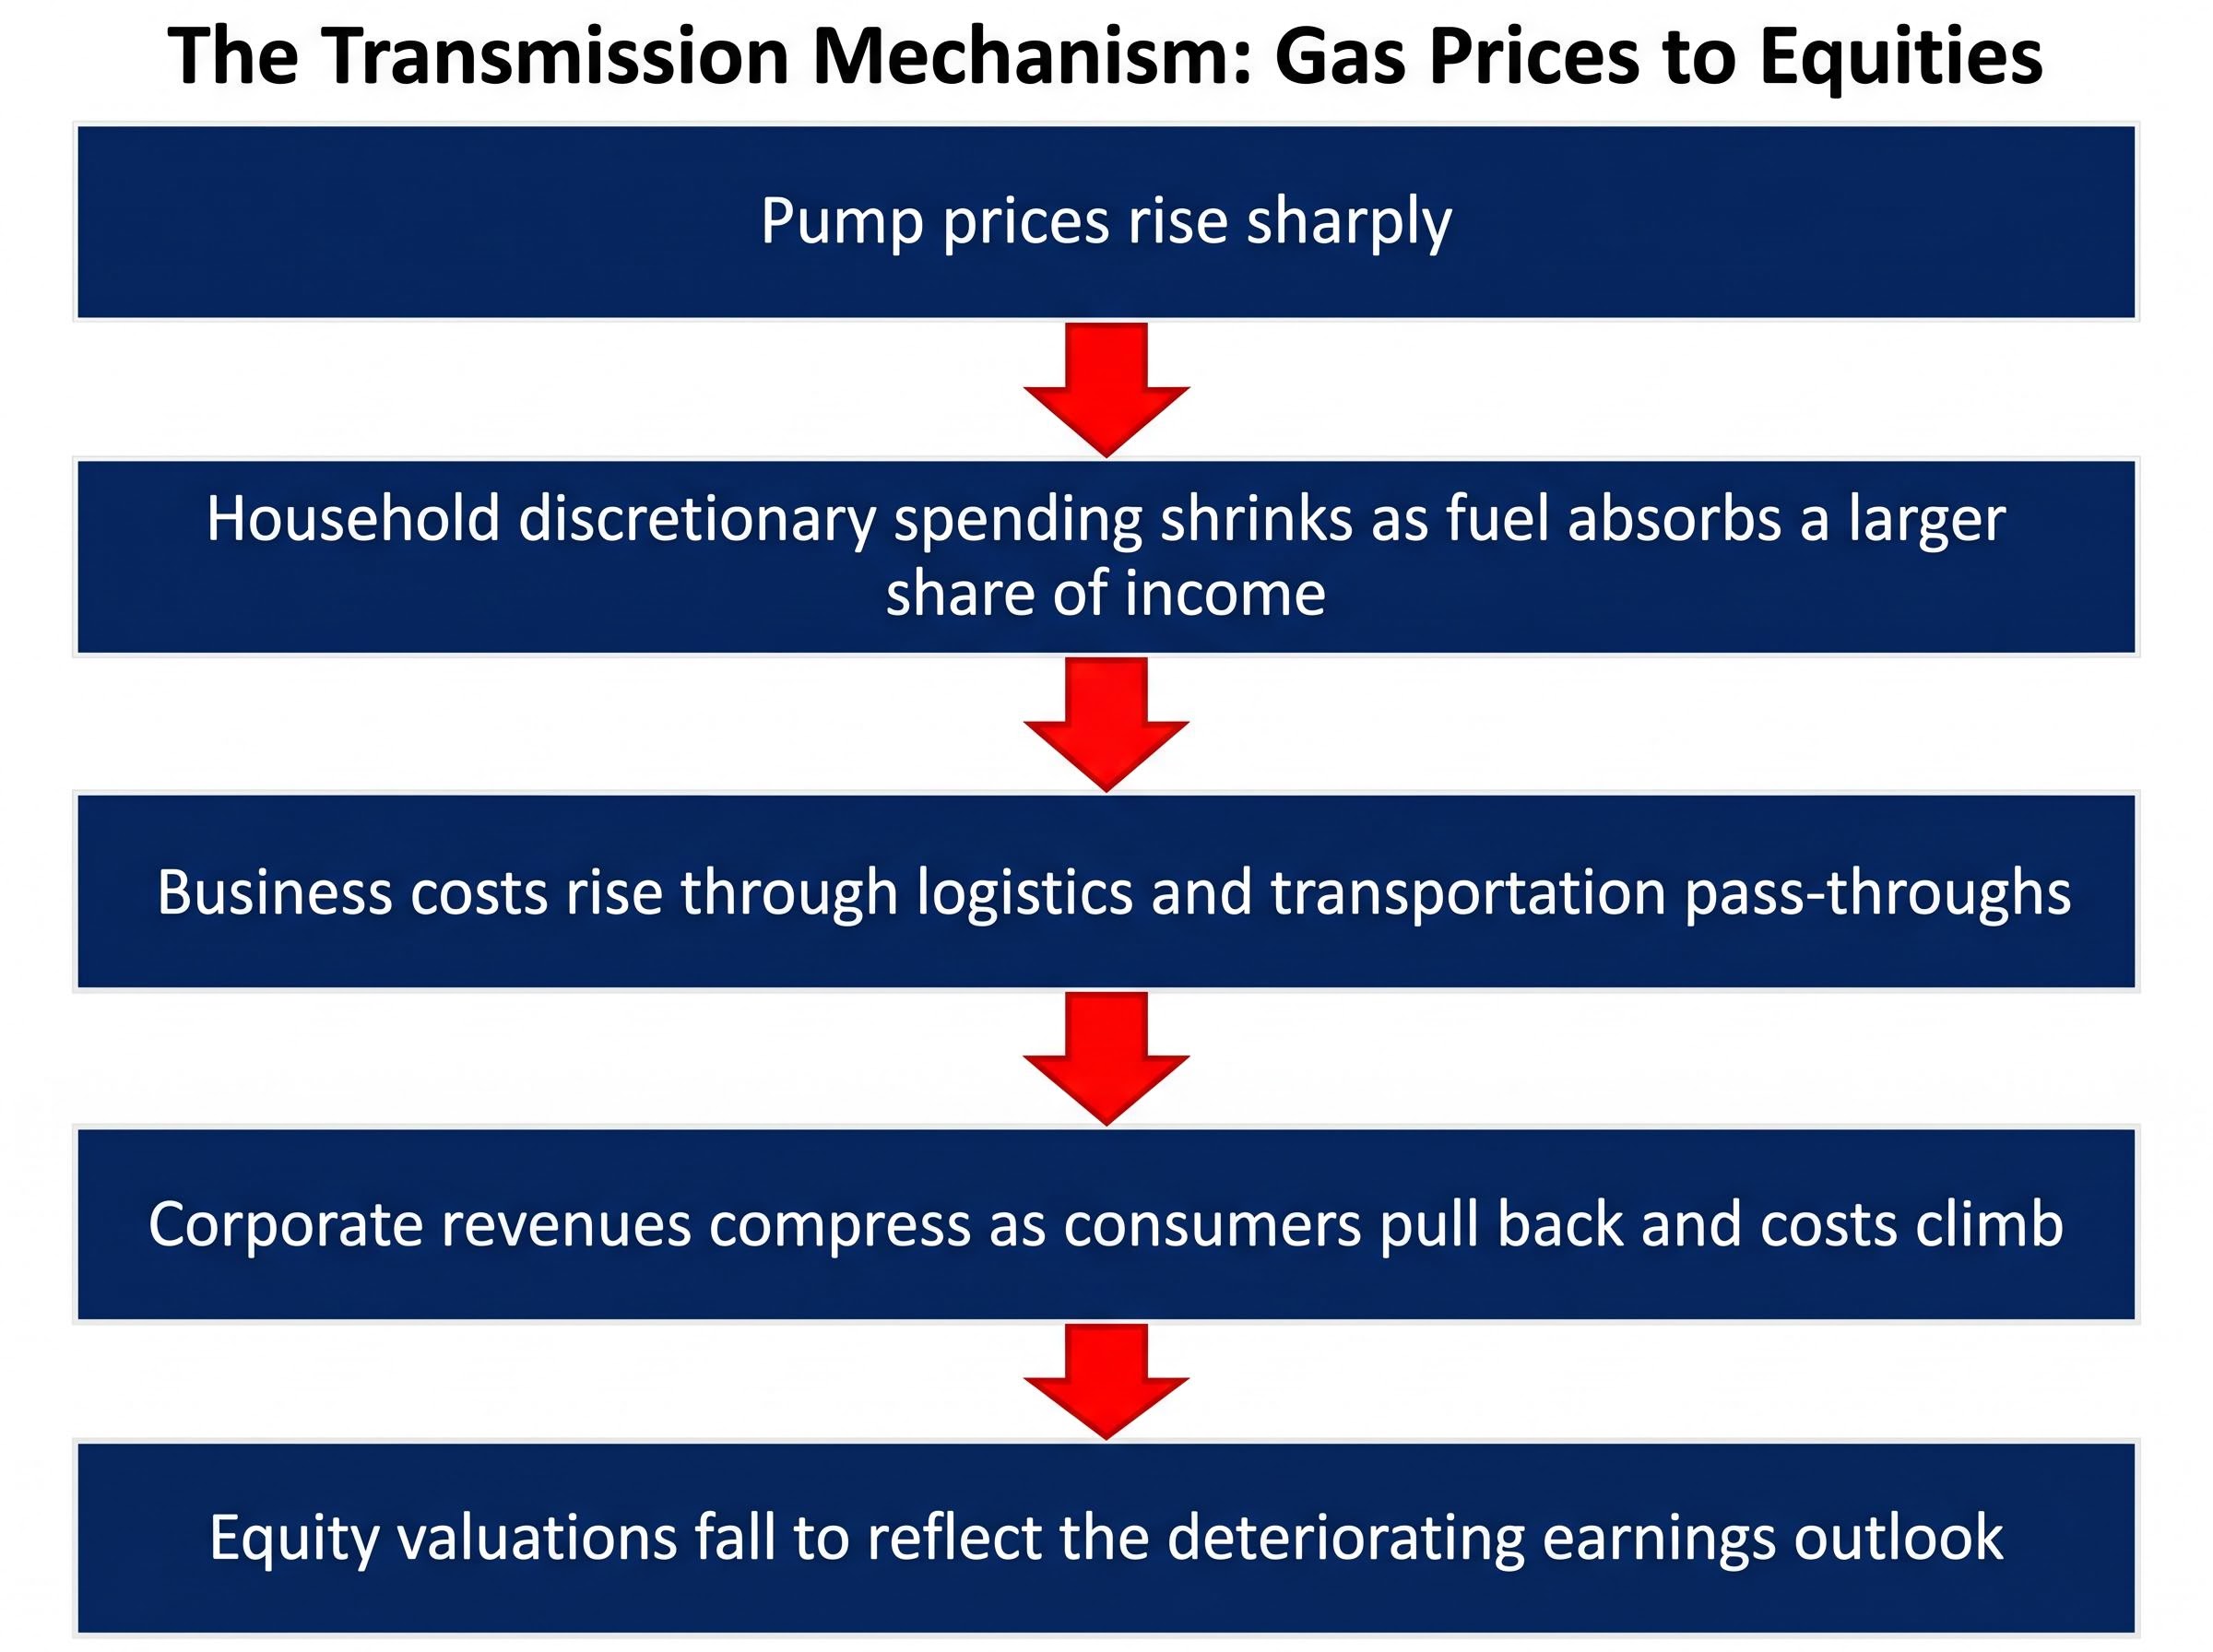
Consumer spending constitutes the predominant share of U.S. GDP. When fuel-driven spending compression hits that engine, the drag flows directly into corporate revenues and, by extension, equity valuations. The sequence is mechanical:
- Pump prices rise sharply
- Household discretionary spending shrinks as fuel absorbs a larger share of income
- Business costs rise through logistics and transportation pass-throughs
- Corporate revenues compress as consumers pull back and costs climb
- Equity valuations fall to reflect the deteriorating earnings outlook
The aggregate index return conceals significant sector divergence within the market, with energy producers including Exxon Mobil capturing gains from the commodity surge while airlines, logistics companies, and consumer discretionary stocks absorb the cost pressure that compresses their margins and earnings.
The damage compounds when the spike is rapid. The 45% move from January to April gave households and businesses almost no time to adjust spending patterns or renegotiate contracts, amplifying the shock’s impact relative to a gradual price drift.
Federal Reserve research on oil shocks and recessions establishes a documented causal pathway between sustained crude price spikes and U.S. contractions, identifying the consumer spending compression channel as the primary mechanism through which energy costs translate into GDP deterioration.
What the historical return data actually shows
According to some market analyses, across the 44 weeks since 1993 in which gasoline exceeded $4, the S&P 500 declined an average of approximately 11% over the following six months. That six-month forward window is the relevant measurement period for investors tracking the current episode, placing the historical risk zone in the range of October to November 2026.
The sample is small, concentrated across roughly two distinct periods (the 2008 commodity supercycle and the 2022 Ukraine invasion spike). A small sample means the 11% average conceals significant variance: some episodes resolved with shallower declines, while others deepened well beyond the average. The pattern is directionally reliable, but the magnitude varies with the severity of the underlying cause.
The Iran conflict has created a supply shock that distinguishes 2026 from prior episodes
The historical baseline provides a starting point, but the 2026 episode carries structural features that position it toward the more severe end of the range.
The Strait of Hormuz disruption is the proximate cause of this year’s spike, and it differs from prior triggers in a material way. The 2022 Ukraine invasion drove prices through demand-side uncertainty and sanctions-related supply redirection. The 2026 conflict has damaged physical infrastructure. Even under the current ceasefire, the Strait remains only partially operational, with estimates suggesting approximately six months to fully normalise traffic and supply flows.
Brent crude stood at approximately $107.13 per barrel on 7 April 2026. WTI crude reached approximately $100.81 per barrel by 29 April 2026. Oil began the year near $65 per barrel, a rise of more than 50% in four months.
Martijn Rats at Morgan Stanley has outlined the projection range: $80-90 per barrel as the favourable full-year 2026 average if the situation de-escalates, with $150-180 per barrel possible if the Strait remains disrupted for several additional months. Goldman Sachs has placed its S&P 500 downside target at 5,400 under a severe oil shock scenario.
| Episode | Trigger | Peak Brent price | Duration above $4 | S&P 500 outcome |
|---|---|---|---|---|
| 2022 | Ukraine invasion; sanctions-related supply redirection | ~$130/barrel | Several months (mid-2022) | Index declined approximately 20% from January to October 2022 |
| 2026 | Iran conflict; Strait of Hormuz infrastructure damage | ~$107/barrel (as of 7 April) | Ongoing since 2 April 2026 | Ongoing; 9% decline from March peak, since recovered |
The structural damage to Hormuz infrastructure is the variable that separates this episode from prior spikes that resolved relatively quickly. A ceasefire does not repair loading terminals or clear shipping lanes. The supply shock has a physical dimension that persists regardless of diplomatic progress.
Wall Street Journal reporting on Hormuz blockade planning has confirmed the geopolitical dimension extends beyond the initial conflict phase, with the potential for a prolonged U.S.-directed blockade adding a policy layer to the physical infrastructure damage that underlies the current supply shock.
How recessions amplify equity losses well beyond the 11% historical average
The 11% average decline captures all outcomes following $4 gasoline, including episodes that resolved without tipping the economy into contraction. The distribution widens sharply when recession follows.
Since the S&P 500’s inception in 1957, the index has declined by an average of 32% during recessions.
That figure, drawn from analysis of every recessionary period since the index began, represents the benchmark for the downside scenario. The gap between 11% and 32% is not academic. It is the single most consequential variable investors need to assess: not whether a decline occurs, but whether it stops at the historical gas-price average or deepens into recessionary territory.
Mark Zandi, Chief Economist at Moody’s, has described recession risk as considerable and worsening. His assessment indicates that even a swift de-escalation of the Iran conflict would likely leave lasting economic damage, preventing meaningful GDP recovery or employment growth for the remainder of 2026.
Investors wanting to model the specific probability attached to a recessionary outcome will find our full explainer on oil price surge and recession risk, which quantifies the four simultaneous transmission channels from crude prices into the broader economy and presents Moody’s Analytics 12-month recession probability alongside Morgan Stanley’s $150-180 per barrel adverse scenario.
Several compounding headwinds support that reading:
- The Strait of Hormuz disruption remains unresolved, with a six-month normalisation timeline even under optimistic assumptions
- Consumer sentiment has hit record lows amid the combined impact of the conflict and fuel price surge
- Corporate cost pass-through pressures are building as businesses absorb higher logistics expenses
- The S&P 500’s full recovery from its March 9% decline occurred despite these pressures remaining in place, raising questions about whether the market has priced in a resolution that may not materialise
The market’s recovery creates a specific vulnerability. If the rebound reflects an assumption of swift Hormuz normalisation, and that normalisation does not arrive, the re-pricing could be more abrupt than the initial decline.
What investors are actually watching right now
The Strait of Hormuz is the single most important variable. A return to full operational traffic removes the supply shock, pulls crude back toward Morgan Stanley’s $80-90 base case, and allows gasoline prices to retreat from the $4 threshold. A prolonged disruption escalates toward the $150-180 range and the Goldman Sachs downside scenario of S&P 500 5,400.
The S&P 500’s full recovery from its March 9% decline, despite the energy shock remaining unresolved, creates a specific market vulnerability. The index appears to have priced in some degree of resolution. If that resolution fails to materialise over the coming weeks, the gap between the market’s positioning and the underlying risk widens, and the subsequent repricing could be sharper than the initial selloff.
The monitoring framework for the next six months
The historically relevant window extends approximately six months from the point gasoline crossed $4, placing the risk period through October to November 2026. Three data points deserve the closest attention, ranked by market impact:
- Strait of Hormuz traffic normalisation: The binary variable. Full reopening collapses the supply premium; continued disruption sustains it. The estimated six-month normalisation timeline means this variable will not resolve quickly even under a durable ceasefire.
- Weekly EIA gasoline price data (released every Monday): The high-frequency signal tracking whether the $4 threshold holds or breaks. The EIA’s full-year 2026 average forecast of $3.70 per gallon implies prices would need to fall back substantially from current levels, a move that requires meaningful Hormuz progress.
- S&P 500 response to any renewed energy price escalation: The market’s reaction function matters. A calm response to further crude increases would suggest the energy shock is being absorbed; a sharp selloff would confirm the vulnerability outlined above.
If prices remain elevated through Q2 and Q3 2026, the historical pattern’s six-month window extends the risk period into late 2026, overlapping with the timeline for Hormuz normalisation and any recessionary effects that may follow.
The $4 signal has a track record, and 2026 is testing it again
Three analytical threads converge on the current moment. The $4 gasoline threshold has appeared in fewer than 3% of weeks since 1993, and when it has appeared, some market analyses indicate the S&P 500 has declined an average of 11% over the following six months. The 2026 supply shock, driven by physical infrastructure damage at the Strait of Hormuz, sits toward the more severe end of the historical range rather than the mild end. And if the energy shock tips the economy into recession, the historical benchmark widens from 11% to 32%.
Genuine uncertainty remains. The S&P 500 recovered its initial 9% decline, and a swift Hormuz resolution could break the historical pattern in the benign direction. The EIA’s $3.70 full-year average forecast implies the agency’s base case includes meaningful price relief in the second half of the year.
The current $4.25 per gallon reading confirms the pattern is active. Goldman Sachs’s 5,400 downside target provides institutional corroboration that the risk is being taken seriously at the highest levels of market analysis. The historical base rate, combined with the structural severity of the 2026 supply shock, justifies treating this signal with the seriousness the data supports, while remaining responsive to how the geopolitical situation develops over the six-month window ahead.
This article is for informational purposes only and should not be considered financial advice. Investors should conduct their own research and consult with financial professionals before making investment decisions. Past performance does not guarantee future results. Financial projections are subject to market conditions and various risk factors.