
TD Cowen Sees 27% Upside in DoorDash, Sets $225 Target
11 hrs ago

The University of Michigan Consumer Sentiment Index hit 49.8 in April 2026, a record low comparable to the depths of the COVID-19 shock. Yet U.S. retail sales surged +8.8% year-over-year in March 2026. When consumers report that they are terrified but keep spending, the question for investors becomes pointed: which signal deserves more weight?
Domino’s Pizza reported Q1 2026 results on 27 April 2026, becoming one of the first consumer-facing companies to offer a window into household spending behaviour this earnings season. U.S. same-store sales grew just +0.9%, decelerating sharply from +3.7% in Q4 2025. Management described a challenging macro backdrop and consumer caution, particularly in March. For investors trying to read the economy through individual earnings reports, the release raises a question worth examining carefully: is a $15 pizza delivery order the canary in the coal mine?
What follows is a framework for interpreting early-season earnings data as macroeconomic signals. The analysis contextualises the Domino’s results against peer company performance and hard spending data, and gives retail investors a structured way to decide what evidence would confirm or refute a broader consumer spending slowdown.
The distinction matters: Domino’s did not report a sales decline. It reported a deceleration. U.S. same-store sales grew +0.9% in Q1 2026, positive but a fraction of the +3.7% recorded in Q4 2025 and below the +3.0% full-year 2025 figure. The sequential comparison, Q4 to Q1, is the most analytically meaningful lens here.
The broader financials told a consistent story of softening momentum:
Forward guidance revised: Domino’s lowered its full-year 2026 U.S. same-store sales outlook to low single-digit growth, with management citing March as the most acutely weak month and referencing both competitive pressure and consumer caution.
Investors who treat this deceleration as a collapse, or dismiss it as noise, both make the same error: imprecision. The factual baseline is that growth slowed meaningfully but did not turn negative. What matters is whether the trajectory continues.
A $15 delivery pizza sits at a specific point in the consumer spending hierarchy: fully discretionary, low-cost, high-frequency. It is not rent, not groceries, not a car payment. It is the kind of purchase that household budgets absorb easily in good times and trim first when confidence falters. That positioning makes Domino’s same-store sales data unusually sensitive to early shifts in consumer behaviour, often before larger categories like apparel or electronics register stress.
Domino’s is also among the first consumer-oriented companies to report Q1 2026 results, making its commentary an early, unfiltered read on the earnings season. The combination of high-frequency discretionary exposure and early reporting sequence gives the data disproportionate signal value for investors attempting to gauge household spending trends in real time.
University of Michigan Consumer Sentiment: 49.8 in April 2026, a record low, down 6.6% from March and comparable to COVID-era troughs recorded in 2020. The index measures how consumers feel about their financial situation and the broader economy.
Companies reporting in the first two weeks of earnings season provide signals before consensus expectations have been updated by the weight of subsequent results. Domino’s commentary on March weakness arrived before most consumer-sector peers had reported, giving investors a first-mover analytical advantage. That advantage is only useful, however, if the signal is cross-referenced rather than acted upon in isolation.
Consumer sentiment indices measure how people feel. They do not measure what people will do. That distinction is the source of Q1 2026’s most confounding analytical tension.
Both major sentiment gauges point to elevated consumer anxiety. The University of Michigan index hit 49.8 in April 2026, a record low. The Conference Board Consumer Confidence Index registered 89.4 in April, up marginally from 91.8 in March but well below long-run averages. By these measures, American consumers have not felt this pessimistic since the early months of the pandemic.
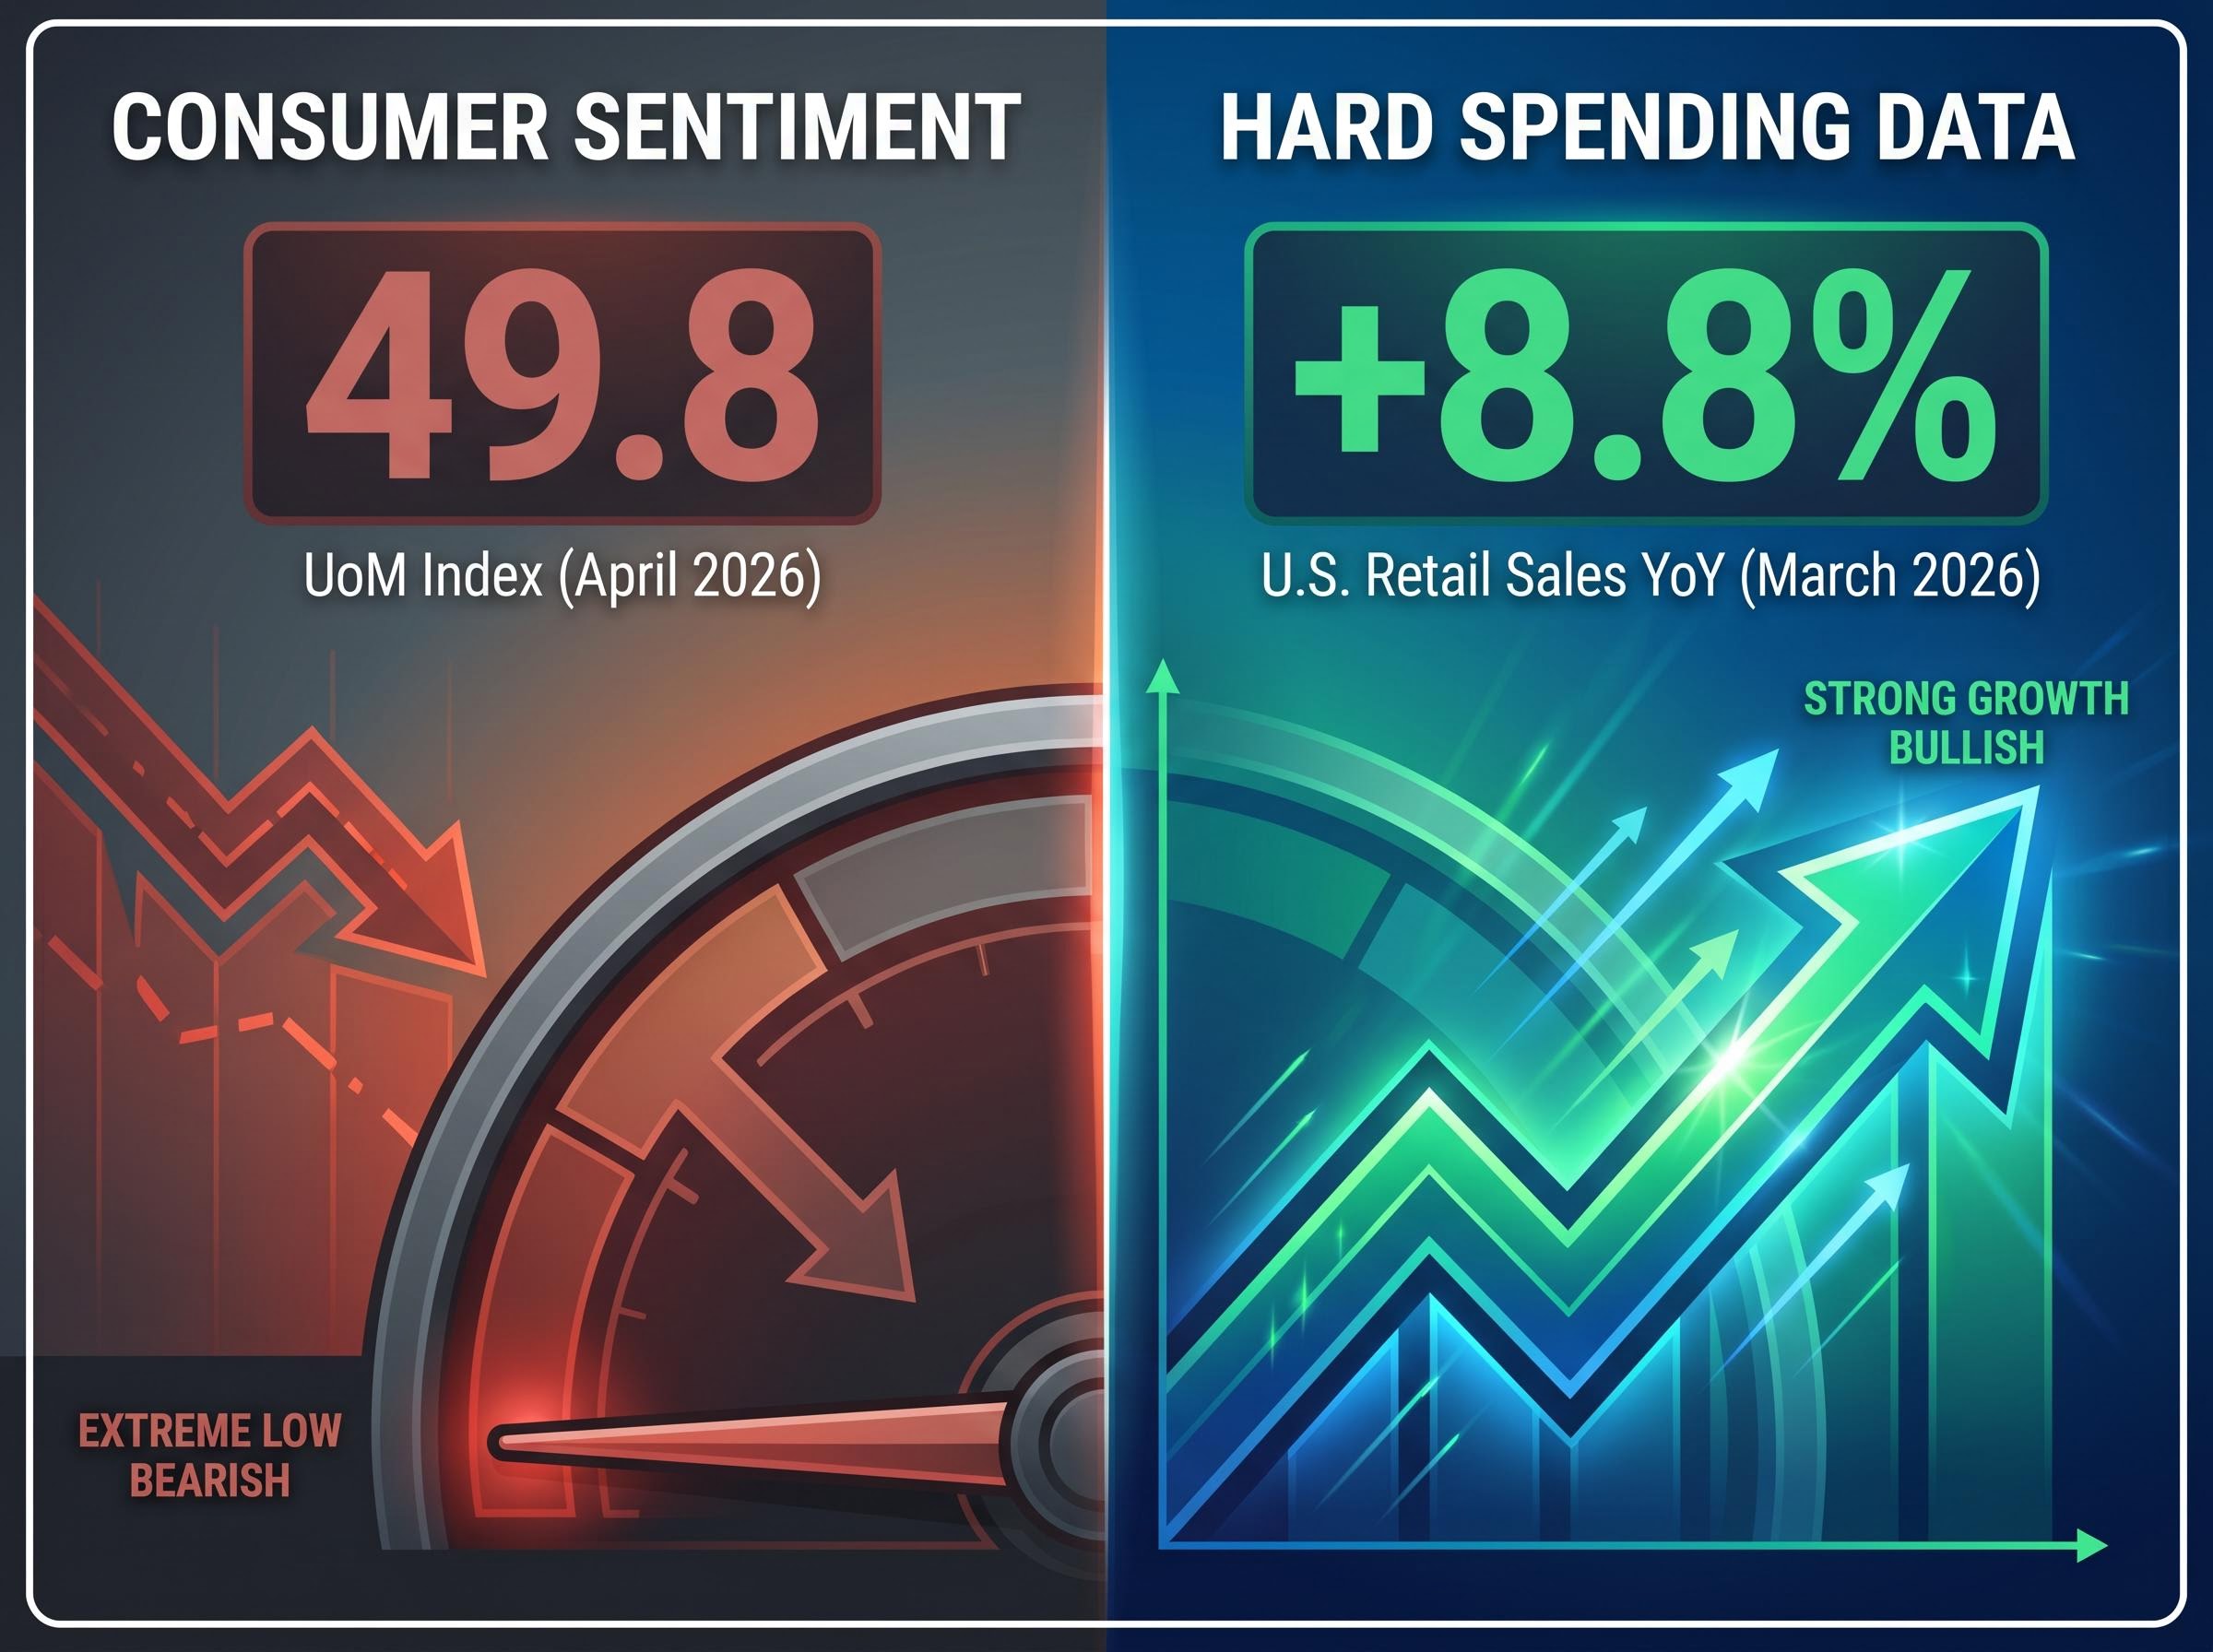
The hard spending data tells a different story. U.S. retail sales rose +8.8% year-over-year in March 2026, with Q1 2026 retail sales up +3.7% year-over-year. Personal consumption expenditures (PCE), a broader measure of consumer spending, increased +2.8% year-over-year in February 2026, stable from January, with real PCE rising $17.0 billion in January. The Federal Reserve’s April 2026 Beige Book noted that consumer spending increased slightly across most districts, with February recording a +0.5% month-over-month gain.
| Indicator | Signal Direction |
|---|---|
| UoM Consumer Sentiment (April 2026): 49.8 | Bearish (record low) |
| Conference Board Confidence (April 2026): 89.4 | Cautious (below trend) |
| U.S. Retail Sales (March 2026): +8.8% YoY | Bullish |
| PCE (February 2026): +2.8% YoY | Neutral / Stable |
| Fed Beige Book (April 2026): Spending increased slightly | Mildly Bullish |
This pattern has appeared before. During periods of tariff and trade uncertainty, sentiment and spending have historically diverged, with consumers reporting heightened anxiety while continuing to spend at or near prior levels. Conflating these two measures is one of the most common interpretive errors investors make, and in Q1 2026, the gap between them is the central analytical challenge.
The Domino’s deceleration gains analytical weight when set alongside what other consumer-facing companies reported for the same period.
McDonald’s delivered the most significant corroborating data point. U.S. same-store sales turned negative in Q1 2026, described as the worst decline since the COVID-19 pandemic. If Domino’s deceleration raised a question, McDonald’s contraction sharpened it: the quick-service restaurant (QSR) segment, where budget-conscious consumers make high-frequency dining decisions, is under genuine pressure.
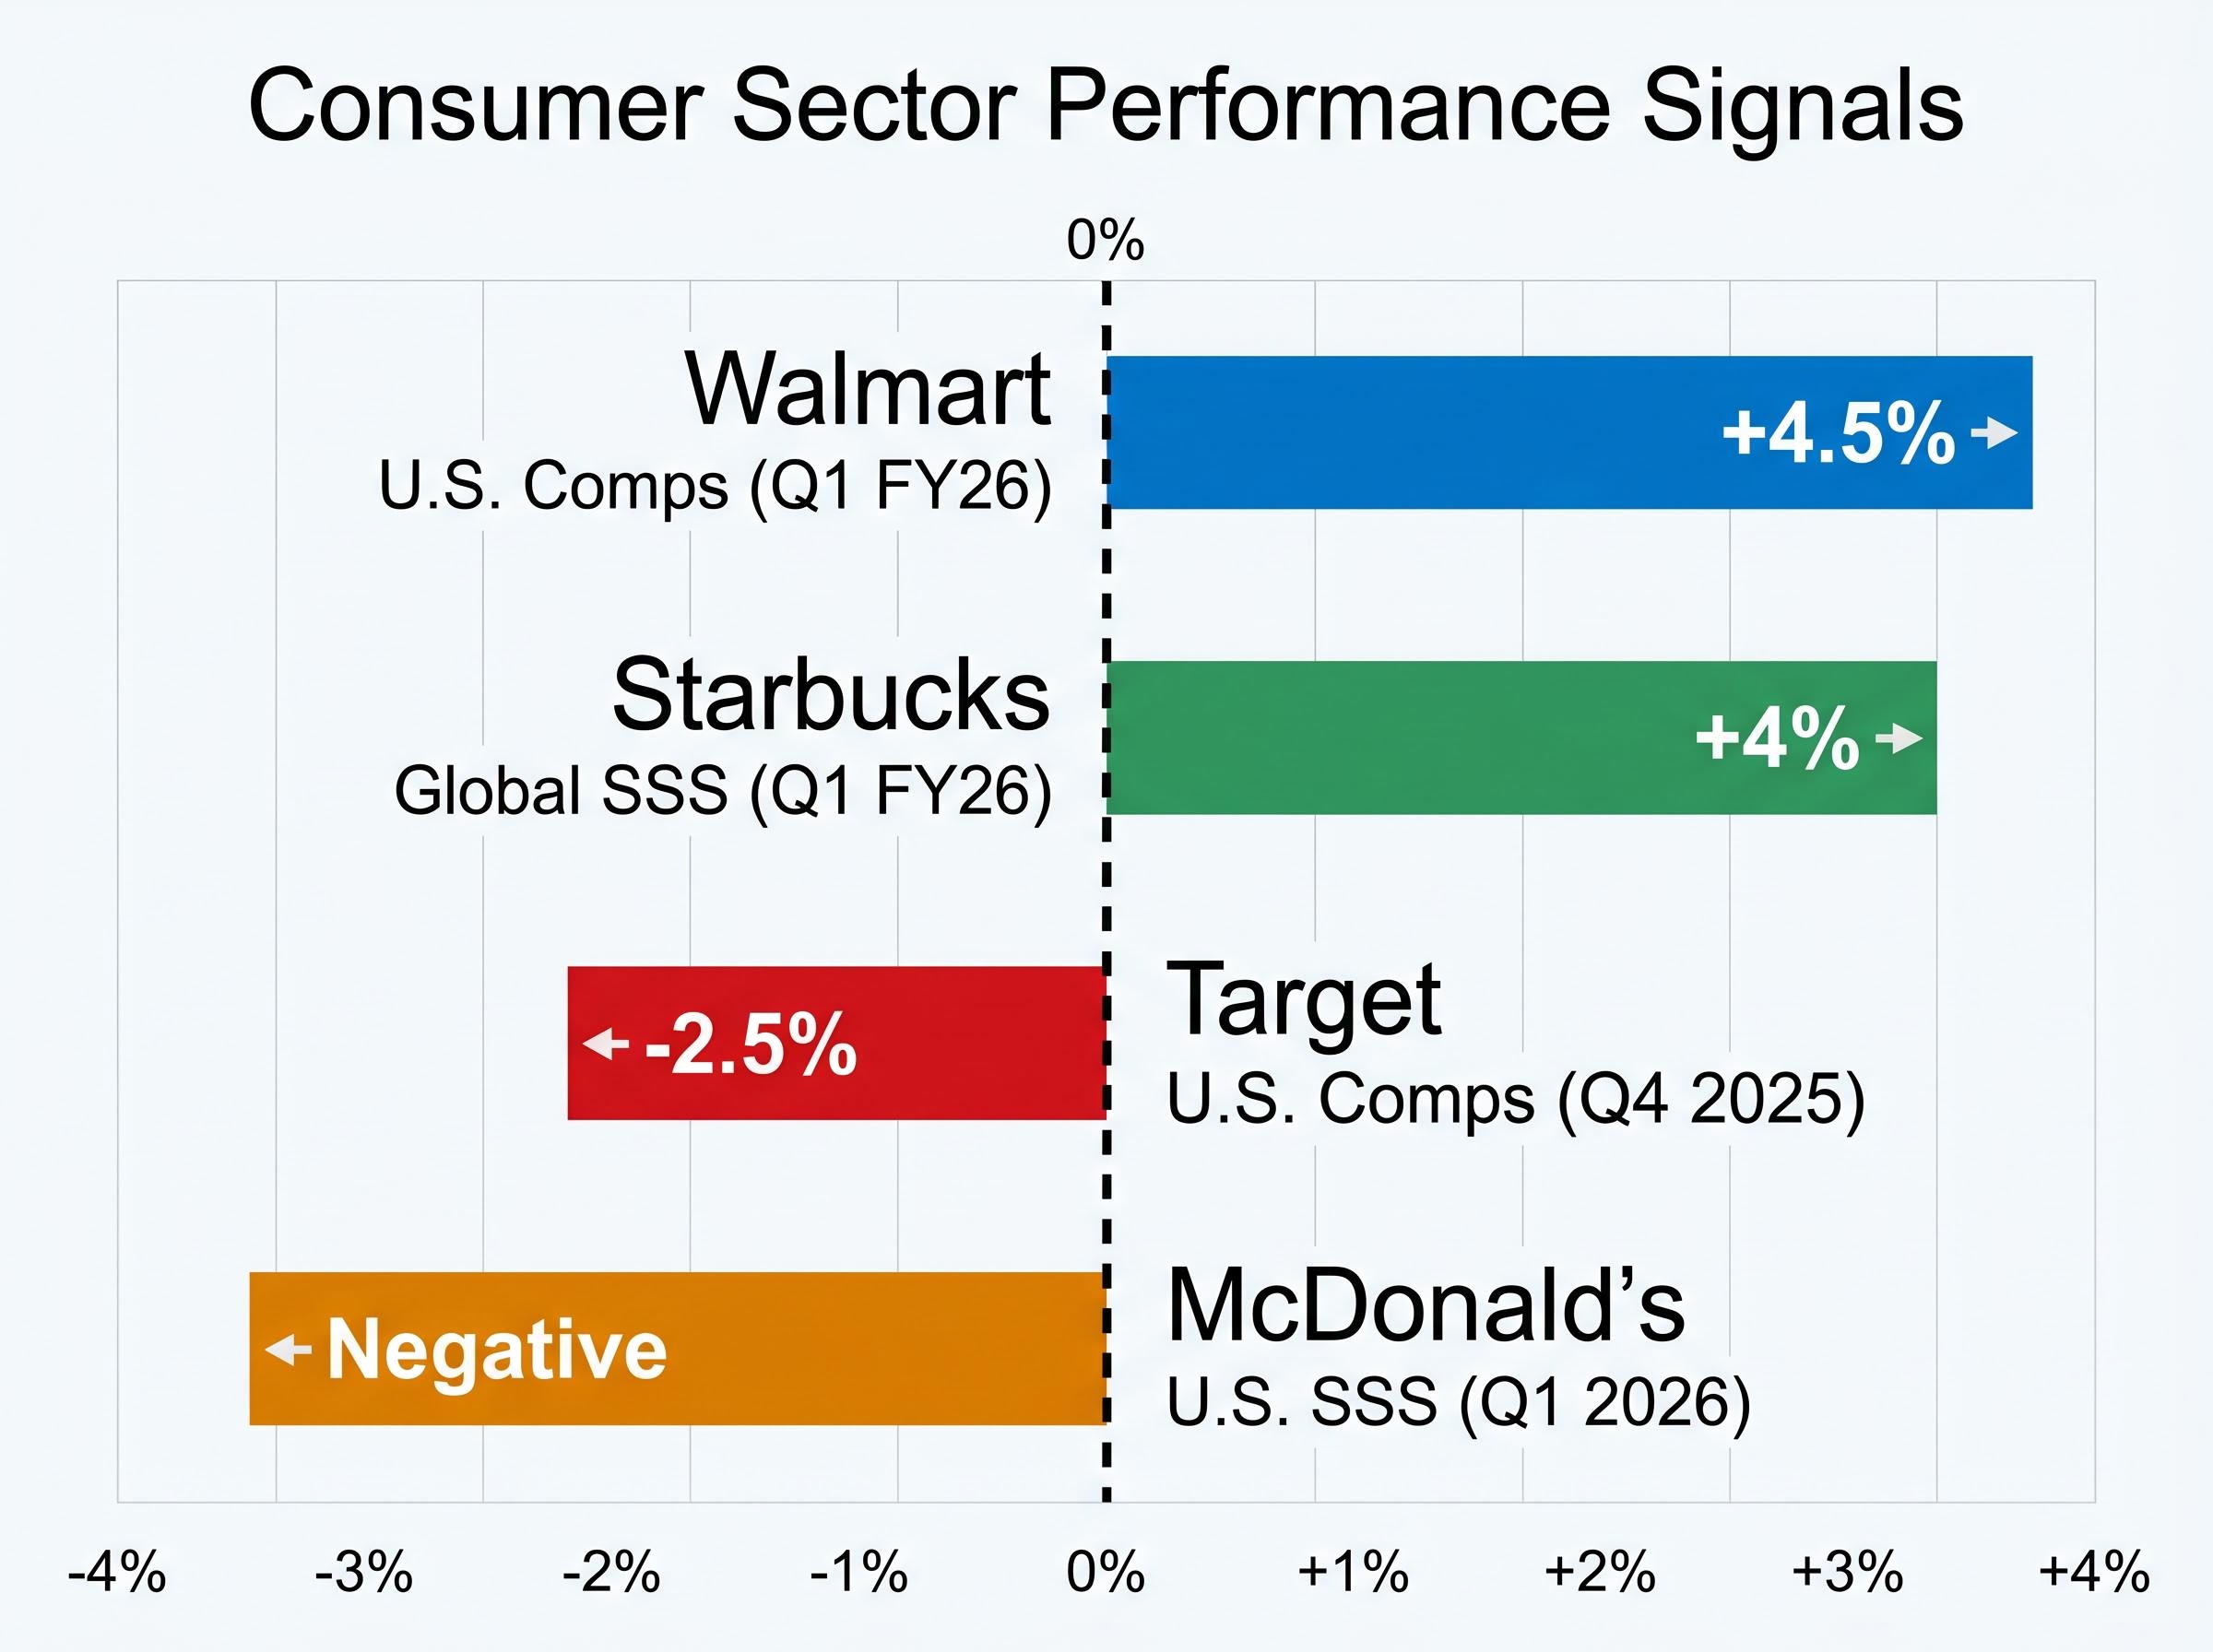
Walmart told a different story entirely. U.S. comparable sales rose +4.5% in Q1 FY26, consistent with a value trade-down dynamic where consumers stretch dollars at discount-format retailers rather than cutting spending outright. Starbucks posted +4% global same-store sales growth in Q1 FY26, suggesting brand-specific resilience. Target, reporting Q4 2025 comparable sales of -2.5%, reflected the squeeze on mid-market positioning between discount and premium.
Chipotle reported on 29 April 2026, two days after Domino’s, offering a forthcoming lens on the fast-casual segment.
| Company | Metric | Result | Interpretation |
|---|---|---|---|
| McDonald’s | U.S. SSS (Q1 2026) | Negative | QSR under pressure; worst since COVID |
| Walmart | U.S. Comps (Q1 FY26) | +4.5% | Value trade-down beneficiary |
| Starbucks | Global SSS (Q1 FY26) | +4% | Brand-specific resilience |
| Target | U.S. Comps (Q4 2025) | -2.5% | Mid-market squeeze |
The segmentation pattern assembles itself:
One company’s results cannot confirm a macroeconomic trend. Domino’s +0.9% same-store sales growth is a data point, not a verdict. Company-specific dynamics, including competitive pressure in pizza delivery and value wars across QSR, add noise to the macro signal. The interpretive challenge is separating what belongs to Domino’s from what belongs to the consumer economy.
A structured approach reduces the risk of over-reaction or premature dismissal:
The equity market is already offering its own forward-looking read. The XLY ETF (Consumer Discretionary Select Sector SPDR) has fallen 8.55% year-to-date as of April 2026, suggesting that investors are pricing in sector-level deterioration ahead of hard data confirmation.
Chipotle’s Q1 2026 results, due 29 April, will help clarify whether the QSR and fast-casual weakness observed at McDonald’s and Domino’s extends more broadly or remains concentrated in specific formats. Broader retail and restaurant reporters through May represent the next layer of evidence. The distinction investors should track is whether subsequent results corroborate a QSR-specific dynamic or reveal a genuinely broadening consumer pullback.
The temptation is to resolve the contradiction. Sentiment is at record lows; spending is positive. One of them must be wrong.
Neither is wrong. Both are accurate measures of different things, and the divergence between them may be the most important signal of all.
The defining tension of Q1 2026: The University of Michigan Consumer Sentiment Index at 49.8, a record low, alongside U.S. retail sales growth of +8.8% year-over-year. Consumers have rarely felt this pessimistic while spending this freely.
Historically, sentiment tends to lead spending behaviour by one to three quarters in consumer stress cycles. The lag means that today’s record-low sentiment readings may not yet have translated into spending cuts, but they increase the probability that such cuts arrive later in 2026. The equity market appears to be pricing this dynamic: the XLY ETF’s -8.55% year-to-date decline suggests that investors expect forward deterioration even as current aggregate data holds up.
Record-low sentiment readings as a contrarian equity signal have historically preceded average 12-month S&P 500 returns of approximately 24-25%, though the current decline is more extreme and sustained than most prior cycles, which limits the reliability of that contrarian case and makes the current setup harder to map onto historical precedent.
Domino’s management guidance revision to low single-digit growth for full-year 2026 is consistent with this reading. A company with real-time demand visibility is signalling that the softening it observed in March is expected to persist, not reverse.
The cross-company pattern reinforces the interpretation:
For investors in consumer-facing equities, the gap between sentiment and spending represents a specific type of risk window. The period between when consumers start feeling worse and when they actually spend less is exactly when forward-looking equity pricing adjustments tend to occur, making it the most actionable window for portfolio positioning.
The Domino’s Q1 2026 results are most accurately characterised as an early-season warning signal worth monitoring, not confirmation of a broad consumer spending collapse. Same-store sales decelerated but remained positive. The macro data is mixed: sentiment is historically bearish, aggregate spending is resilient, and the composition of that spending is shifting toward value.
The cross-company pattern provides more analytical weight than any single earnings release. QSR weakness at McDonald’s and Domino’s, Walmart’s value trade-down strength, and Target’s mid-market pressure point to a consumer economy that is reorganising its spending rather than curtailing it outright. The XLY ETF’s -8.55% year-to-date decline suggests the equity market is pricing in further deterioration.
Upcoming consumer-sector reports through May, beginning with Chipotle on 29 April, represent the next layer of evidence. Investors tracking the consumer spending slowdown thesis should treat the current data as a hypothesis that subsequent earnings will either strengthen or undermine. Resolving the sentiment-spending divergence too quickly in either direction risks misreading one of the more nuanced setups of 2026.
Investors wanting to stress-test this framework against broader structural data will find our full explainer on the 2026 stock market and economy divergence, which examines the CMBS delinquency rate hitting a cycle high of 7.55%, the Fed’s shift from rate cuts to rate holds, and what Goldman Sachs, Morgan Stanley, and the Brookings Institution have each said about how long such divergences historically persist.
This article is for informational purposes only and should not be considered financial advice. Investors should conduct their own research and consult with financial professionals before making investment decisions. Past performance does not guarantee future results.
A consumer spending slowdown refers to a deceleration in the rate at which households purchase goods and services, typically measured through indicators such as retail sales data, personal consumption expenditures (PCE), and same-store sales figures reported by consumer-facing companies.
Domino's U.S. same-store sales decelerated to +0.9% in Q1 2026 from +3.7% in Q4 2025, with management citing a challenging macro backdrop, competitive pressure in pizza delivery, and notably weak consumer behaviour in March 2026.
The two measures track different things: sentiment gauges how consumers feel, while retail sales measure what they actually spend. Historically, sentiment tends to lead spending behaviour by one to three quarters, meaning current record-low readings may signal spending cuts arriving later in 2026 rather than immediately.
Walmart reported U.S. comparable sales of +4.5% in Q1 FY26, suggesting consumers are trading down to value-format retailers, while McDonald's and Domino's face pressure in the quick-service restaurant segment and Target reported negative comparable sales of -2.5% reflecting mid-market vulnerability.
Investors should monitor Chipotle's Q1 2026 results (reported 29 April) and the broader wave of consumer-sector earnings through May, tracking whether QSR and discretionary weakness broadens beyond McDonald's and Domino's or remains confined to specific formats and price points.


