
How Dual-Class Shares Put $24 Billion in Gulf Capital at Arm’s Length
11 hrs ago

Four of the most valuable companies on Earth are projected to generate a combined $650-$700 billion in capital expenditure in 2026, yet some of them will post earnings-per-share growth in the low single digits while revenue climbs 14-31%. The gap between those two numbers is not a contradiction. It is the mechanical signature of an AI infrastructure investment cycle operating at a scale the market has never processed before.
With Alphabet, Meta, Amazon, and Microsoft all reporting Q1 2026 earnings on the same day later this week, the same paradox is surfacing across every preview: revenue is surging, but EPS is barely moving. For retail investors watching their portfolios, that disconnect can look alarming, or like an opportunity. Understanding which it is requires grasping how large infrastructure investments flow through financial statements, why the timing mismatch between spending and returns creates temporary earnings compression, and what metrics matter more than headline EPS during a capital expenditure supercycle.
The numbers tell the story before any explanation is needed.
Meta’s Q1 2026 consensus projects revenue of approximately $55.57 billion (+31% year-on-year) alongside EPS of approximately $6.65 (+3% year-on-year). Revenue growth is outpacing earnings growth by a factor of ten.
Alphabet presents a sharper version of the same pattern: revenue of approximately $107 billion (+19% YoY) paired with EPS of approximately $2.67 (-5% YoY). Revenue is accelerating while earnings are declining. Amazon falls in between, with consensus revenue of approximately $177 billion (+14% YoY) and EPS of approximately $1.65 (+4% YoY).
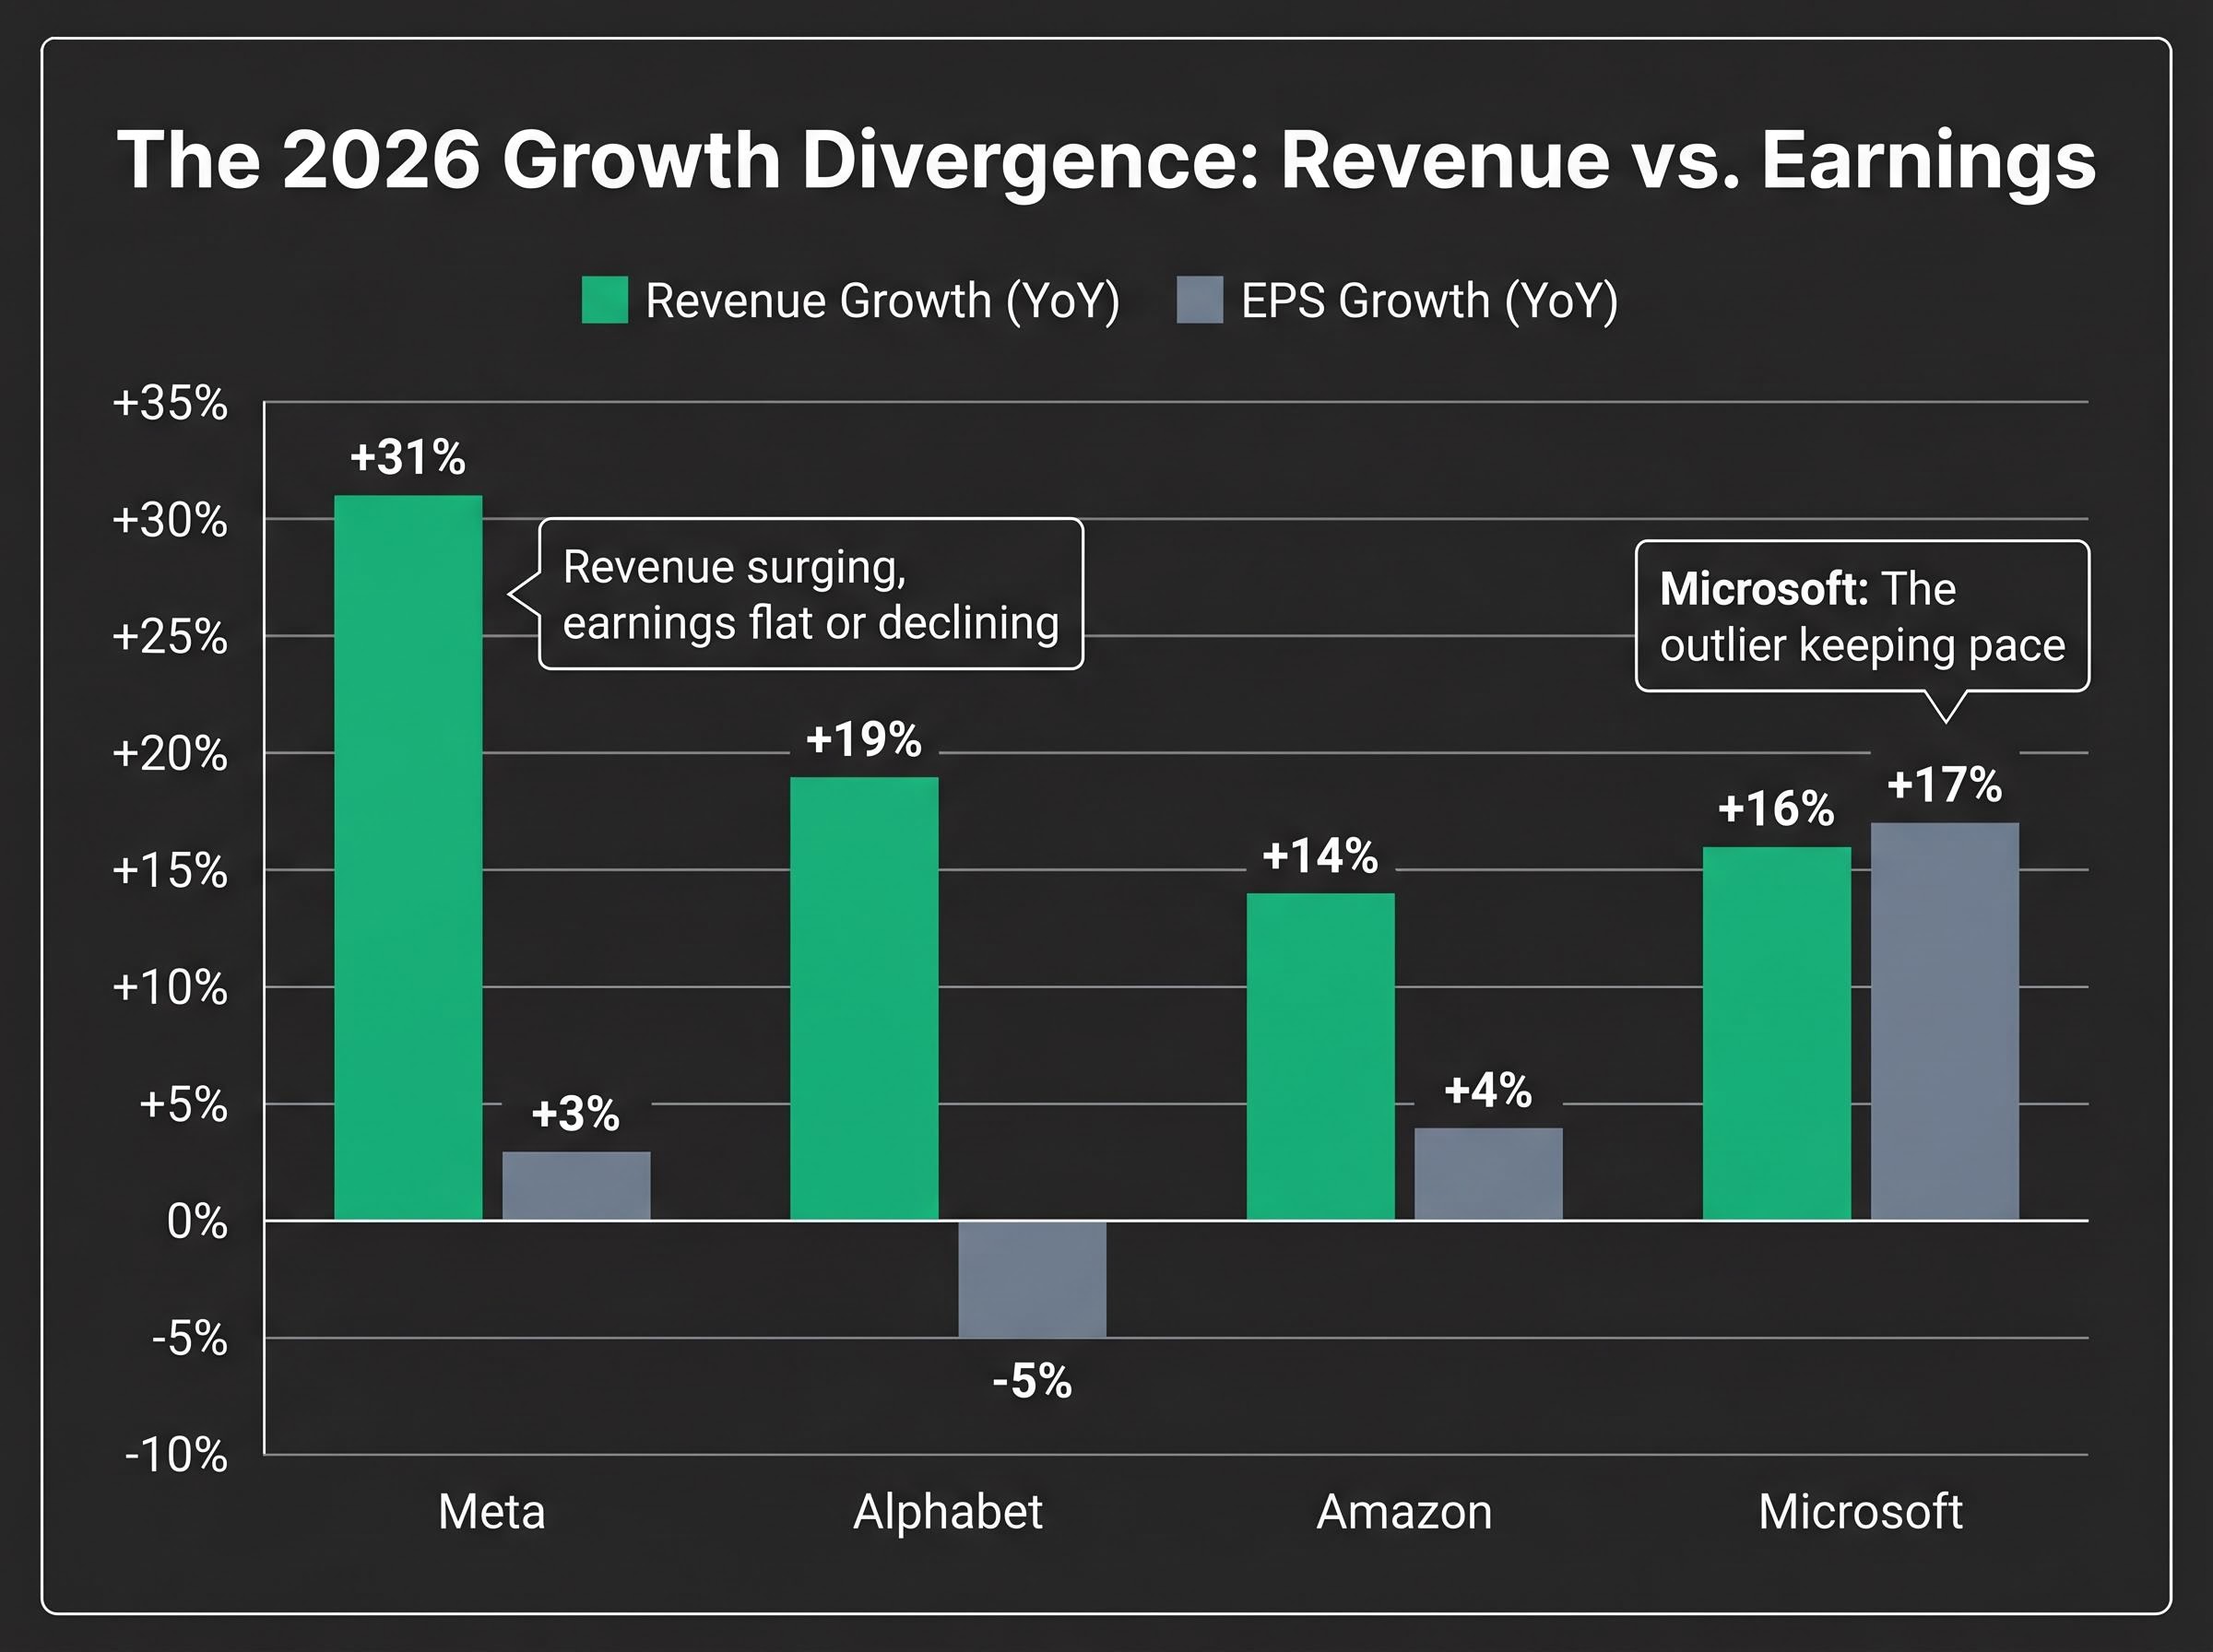
Microsoft is the outlier. Its fiscal Q3 2026 consensus projects revenue of approximately $81.4 billion (+16% YoY) alongside EPS of approximately $4.06 (+17% YoY), making it the only one of the four where earnings growth is keeping pace with revenue.
| Company | Q1 2026 Revenue Growth (YoY) | Q1 2026 EPS Growth (YoY) | 2026 CapEx Guidance |
|---|---|---|---|
| Meta | +31% | +3% | $115-$135B |
| Alphabet | +19% | -5% | $175-$185B |
| Amazon | +14% | +4% | $200B |
| Microsoft | +16% | +17% | ~$110-$120B (estimated) |
The explanation is mechanical, not mysterious. These companies are front-loading costs for assets (servers, data centres, custom chips) whose revenue benefits will arrive over years, while the spending hits cash flow and depreciation schedules immediately. That timing gap between when money leaves the business and when it starts generating profit is the entire reason revenue and EPS are diverging. Investors who confuse that compression with business deterioration risk selling into exactly the kind of infrastructure build that historically precedes the highest-return phase.
Futurum Group’s tracking of 2026 hyperscaler capital expenditure commitments puts combined spending guidance for the four largest infrastructure providers in the $660-$690 billion range, consistent with the scale of the divergence now visible in consensus revenue and EPS projections.
Capital expenditures do not appear as an expense on the income statement the way salaries or marketing costs do. When a company like Amazon commits $200 billion to data centre infrastructure, that spending is capitalised, meaning it is recorded as an asset on the balance sheet rather than deducted from revenue immediately. The profit drag arrives gradually, through depreciation.
The three-step process works as follows:
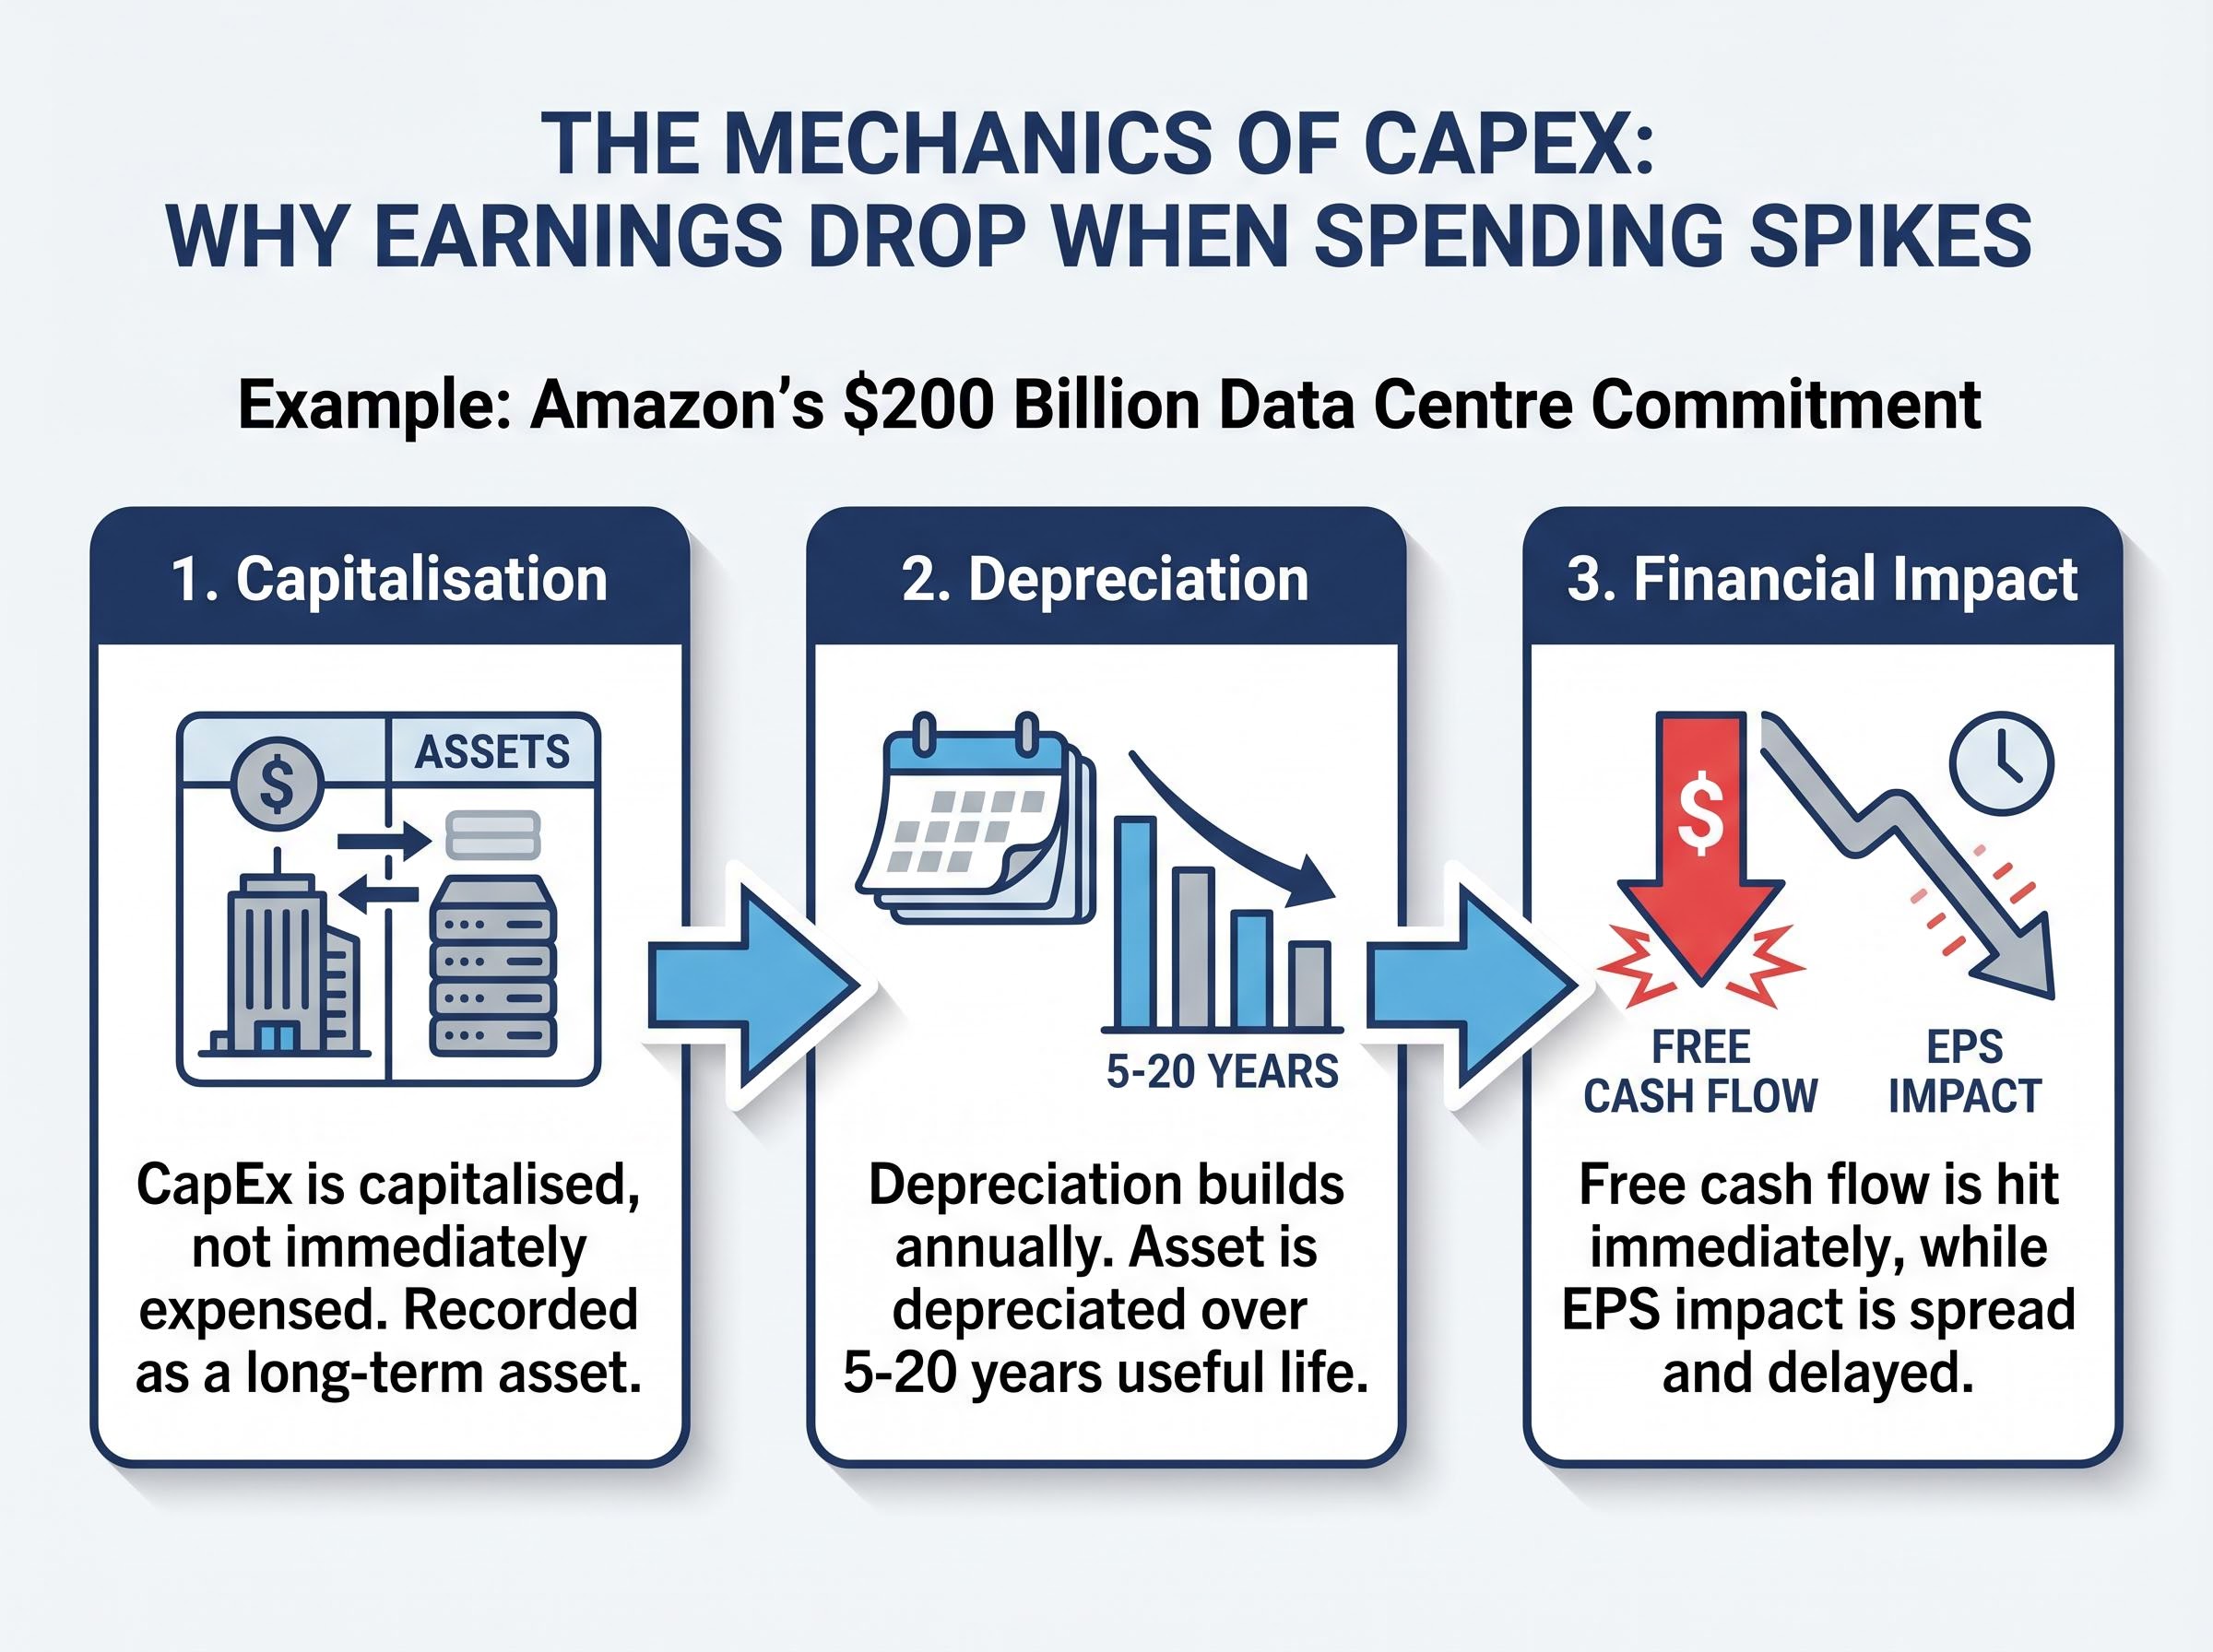
This creates a dual pressure on earnings. The depreciation charge grows as new assets are added faster than old ones are fully depreciated. Where financing costs apply, interest payments add a further drag before a single dollar of AI-generated revenue is earned.
Free cash flow (FCF), the cash remaining after a company pays for its operations and its capital investments, is where the pain is most visible. FCF is calculated as cash from operations minus CapEx.
In 2025, CapEx across Alphabet, Meta, Microsoft, and Amazon reached approximately 55-75% of operating cash flow, eroding more than 50% of free cash flow for the group. A $200 billion CapEx commitment against Amazon’s approximately $716.9 billion revenue base creates FCF negativity risk if revenue growth lags spending.
That FCF compression is not theoretical. It constrains share buybacks, limits dividend capacity, and reduces financial flexibility. For investors evaluating these companies, the gap between accounting earnings (EPS) and actual cash leaving the business is the single most important distinction to grasp during this cycle.
Societe Generale has projected hyperscaler free cash flow turning negative by late 2026 before recovering in Q1 2027, a trajectory that frames the FCF erosion documented across the Big 4 not as a brief compression but as a multi-quarter trough with a specific recovery timeline investors can monitor.
The four largest AI spenders share the same macro thesis, but their financial positions and market receptions have diverged sharply, revealing how differently the market judges CapEx programmes depending on the funding mechanics behind them.
Meta has become the market’s benchmark for managing the CapEx balance well:
The market rewarded Meta because its CapEx programme is funded entirely from existing cash generation. A 41% operating margin provides the self-funding capacity that investors now treat as the entry condition for tolerating heavy spending.
MUFG has identified debt financing as CapEx outstrips free cash flow as a structural shift now underway across hyperscalers, raising the return threshold required to justify current infrastructure commitments and adding a refinancing risk dimension that does not appear in free-cash-flow or EPS analysis alone.
Microsoft experienced the opposite reaction earlier in the cycle. Despite strong Azure growth, the stock fell 7-10% following its calendar Q4 2025 earnings, with below-expected cloud growth contributing to the decline. The market was signalling that cloud revenue acceleration needed to match the pace of infrastructure spending. Microsoft’s fiscal Q3 2026 consensus ($81.4 billion revenue, $4.06 EPS) now projects 17% EPS growth, suggesting it may have moved further along the monetisation curve, but the earlier penalty illustrates how the market’s tolerance for CapEx can shift quarter to quarter.
Amazon represents the highest-risk case among the four:
Amazon CEO Andy Jassy framed the $200 billion commitment in his shareholder letter by noting that near-complete customer commitments are already in place to absorb the full year’s planned capital spending.
The AI chip division’s $50 billion run rate is the clearest near-term proof of monetisation, but at $200 billion, the sheer scale of the commitment creates acute FCF risk if revenue growth does not accelerate beyond 12%.
Alphabet brings strategic optionality beyond direct cloud revenue:
Alphabet’s TPU co-development with Broadcom and its expanding Anthropic stake represent bets that could generate returns beyond direct cloud revenue, including potential IPO upside. Near-term EPS remains compressed, with a projected 5% decline in Q1 2026, but the revenue line is accelerating.
These four companies collectively represent over 18% of the S&P 500. How investors read their CapEx cycle has direct portfolio implications for anyone holding broad U.S. index funds.
The current AI infrastructure cycle feels unprecedented, and in absolute dollar terms it is. But the structural pattern has played out before, and the closest precedent offers both reassurance and a warning about scale.
Amazon’s AWS buildout between 2012 and 2016 followed the same dynamic. CapEx peaked at approximately $10-$20 billion annually. EPS was severely compressed as Amazon sacrificed near-term profits for infrastructure dominance. The market initially penalised the stock, then dramatically re-rated upward as cloud returns materialised. The pattern of infrastructure-first, earnings-later delivered outsized long-term returns for investors who held through the compression phase.
The scale contrast is stark: $10-$20 billion at AWS’s peak versus $650-$700 billion combined for the Big 4 in 2026.
The 4G telecom rollout (circa 2010-2014) offers a secondary precedent. Major carriers experienced EPS compression during heavy network CapEx, followed by earnings recovery as subscriber monetisation scaled.
The historical record bears this out: how equity markets price earnings compression during growth phases has been documented repeatedly, with Tesla delivering a 1,651% cumulative return across a decade of reported losses while the Russell 2000 routinely trades at record levels with more than 40% of its constituents unprofitable.
Both precedents followed the same three-phase cycle:
The structural parallel to the current AI cycle is clear. The open question analysts are asking is whether AI monetisation will prove as durable and broadly adopted as cloud computing did, or whether enterprise AI adoption will lag the infrastructure curve. Fear of missing out on AI infrastructure positioning is driving 60%+ year-on-year CapEx growth, pushing combined hyperscaler spend toward $700 billion. Consensus points to 2026-2027 as the observation window where the CapEx-to-return inflection should become visible, if it is coming at all.
EPS alone is an insufficient signal during a CapEx supercycle because the spending mechanically suppresses it. The question is not whether EPS is lower than expected, but whether the infrastructure spending is generating committed, growing revenue. Analysts evaluating these companies in 2026 have shifted toward four alternative metrics.
| Metric | What It Measures | What to Look For | Best Current Illustration |
|---|---|---|---|
| CapEx as % of Operating Cash Flow | Spending intensity relative to cash generation | Below 75%; above triggers FCF negativity risk | Amazon (highest risk) |
| FCF Yield and FCF Erosion Trend | How much actual cash remains after investment | Stabilising or improving quarter-on-quarter | Meta (strongest FCF position) |
| EV/EBITDA Adjusted for AI Revenue Backlog | Valuation relative to committed future revenue | Backlog growing faster than CapEx commitments | Microsoft (commercial backlog) |
| Revenue Growth Acceleration Rate | Whether the revenue line is accelerating, flat, or decelerating as CapEx rises | Accelerating, indicating spend is translating to demand | Alphabet (+18% and accelerating) |
The first metric, CapEx as a percentage of operating cash flow, is the primary stress test. In 2025, the Big 4 collectively spent 55-75% of operating cash flow on capital investments. When that ratio exceeds 75%, FCF negativity risk becomes acute.
The market’s emerging “profit accountability” test synthesises these signals into a single evaluation:
Margin resilience plus revenue acceleration plus self-funding capacity is the combination that earned Meta its post-earnings stock surge. High spend alone, without those accompanying signals, triggers caution.
Meta’s forward price-to-earnings ratio of approximately 25x amid its AI investments illustrates how the market prices self-funded CapEx programmes differently from those requiring external financing or margin sacrifice.
Retail investors who apply these four metrics to the upcoming Q1 2026 earnings reports will be reading the same signals institutional analysts are using, providing a more sophisticated basis for hold or sell decisions than headline EPS alone.
The downstream effects of AI infrastructure spending on enterprise software pricing are already visible: per-seat SaaS pricing has dropped from 21% to 15% usage in a single year, and IDC projects the model will be obsolete by 2028 as vendors shift to consumption-based structures, a dynamic that adds another revenue-model variable to the returns equation for infrastructure investors.
All four companies report after market close on Wednesday, 30 April 2026. This convergence makes it a uniquely concentrated signal for the entire AI investment thesis.
Beyond headline EPS, three specific signals will determine whether the market rewards or penalises each report:
The broader market context adds weight to the results. The S&P 500 and Nasdaq recently reached new record highs ahead of these earnings. With the combined weighting of Alphabet, Meta, Amazon, and Microsoft exceeding 18% of the S&P 500, the results will move the index for any investor holding broad U.S. equity exposure.
Microsoft’s fiscal Q3 2026 consensus projects 17% EPS growth alongside 16% revenue growth, suggesting it has moved further along the monetisation curve than its peers. Shares dropped 7-10% in the wake of calendar Q4 2025 earnings, meaning this week’s report will serve as a gauge of whether Azure growth has returned to an accelerating trajectory.
The specific question: whether Copilot’s transition to a paid product, which has outperformed internal expectations according to Bloomberg reporting, is demonstrably showing up in commercial revenue. Meta’s approximately 10% post-earnings surge following its Q4 2025 results remains the benchmark for what a “rewarded” report looks like this cycle.
This week’s simultaneous earnings from four of the largest AI spenders on Earth will either validate or test the thesis that EPS compression is temporary and returns are materialising, making it one of the highest-signal events of 2026 for any investor with U.S. equity exposure.
EPS compression during a CapEx supercycle is a mechanical outcome of how capital investments flow through financial statements, not a verdict on business health. The depreciation lag, the FCF drag, and the timing mismatch between infrastructure spending and revenue generation are structural features of every major buildout. History supports this reading: the AWS cycle and the 4G rollout both followed the same pattern of suppressed earnings followed by re-rating. But the current cycle’s scale, approaching $650-$700 billion combined, is unprecedented, and the timeline to earnings inflection remains uncertain, with analysts pointing to 2026-2027 as the window where the thesis is confirmed or challenged.
The actionable framework is straightforward. Watch CapEx as a percentage of operating cash flow. Monitor whether revenue is accelerating against the spending rate. Apply the profit accountability test: margin resilience, revenue growth, and self-funding capacity, before treating an EPS miss as a reason to exit.
This week’s earnings from all four companies represent the most concentrated real-time test of the AI investment thesis since the supercycle began.
This article is for informational purposes only and should not be considered financial advice. Investors should conduct their own research and consult with financial professionals before making investment decisions. Past performance does not guarantee future results. Financial projections are subject to market conditions and various risk factors.
A CapEx supercycle is a period of exceptionally heavy capital expenditure, typically on infrastructure like data centres and chips, where spending is so large and sustained that it mechanically suppresses earnings per share through rising depreciation charges even as revenue grows strongly.
When these companies spend billions on AI infrastructure, the costs are capitalised as assets rather than expensed immediately, so earnings are only reduced gradually through depreciation over years while the full cash outlay hits immediately, creating a timing gap between revenue growth and earnings growth.
Free cash flow is calculated as operating cash flow minus CapEx, so when CapEx reaches 55-75% of operating cash flow as it did across the Big 4 in 2025, more than half of generated cash is consumed by investment, reducing the funds available for buybacks, dividends, and financial flexibility.
Analysts recommend monitoring CapEx as a percentage of operating cash flow (with above 75% flagging FCF risk), free cash flow yield trends, EV/EBITDA adjusted for AI revenue backlog, and revenue growth acceleration rate to assess whether infrastructure spending is translating into committed demand.
Amazon's AWS buildout from 2012-2016 and the 4G telecom rollout from 2010-2014 both followed the same pattern of suppressed earnings during heavy CapEx phases, followed by earnings re-rating as revenue monetisation scaled, though the current AI cycle's $650-$700 billion combined spend is far larger than either precedent.


