
What Domino’s Q1 Results Reveal About the Consumer Spending Slowdown
15 hrs ago

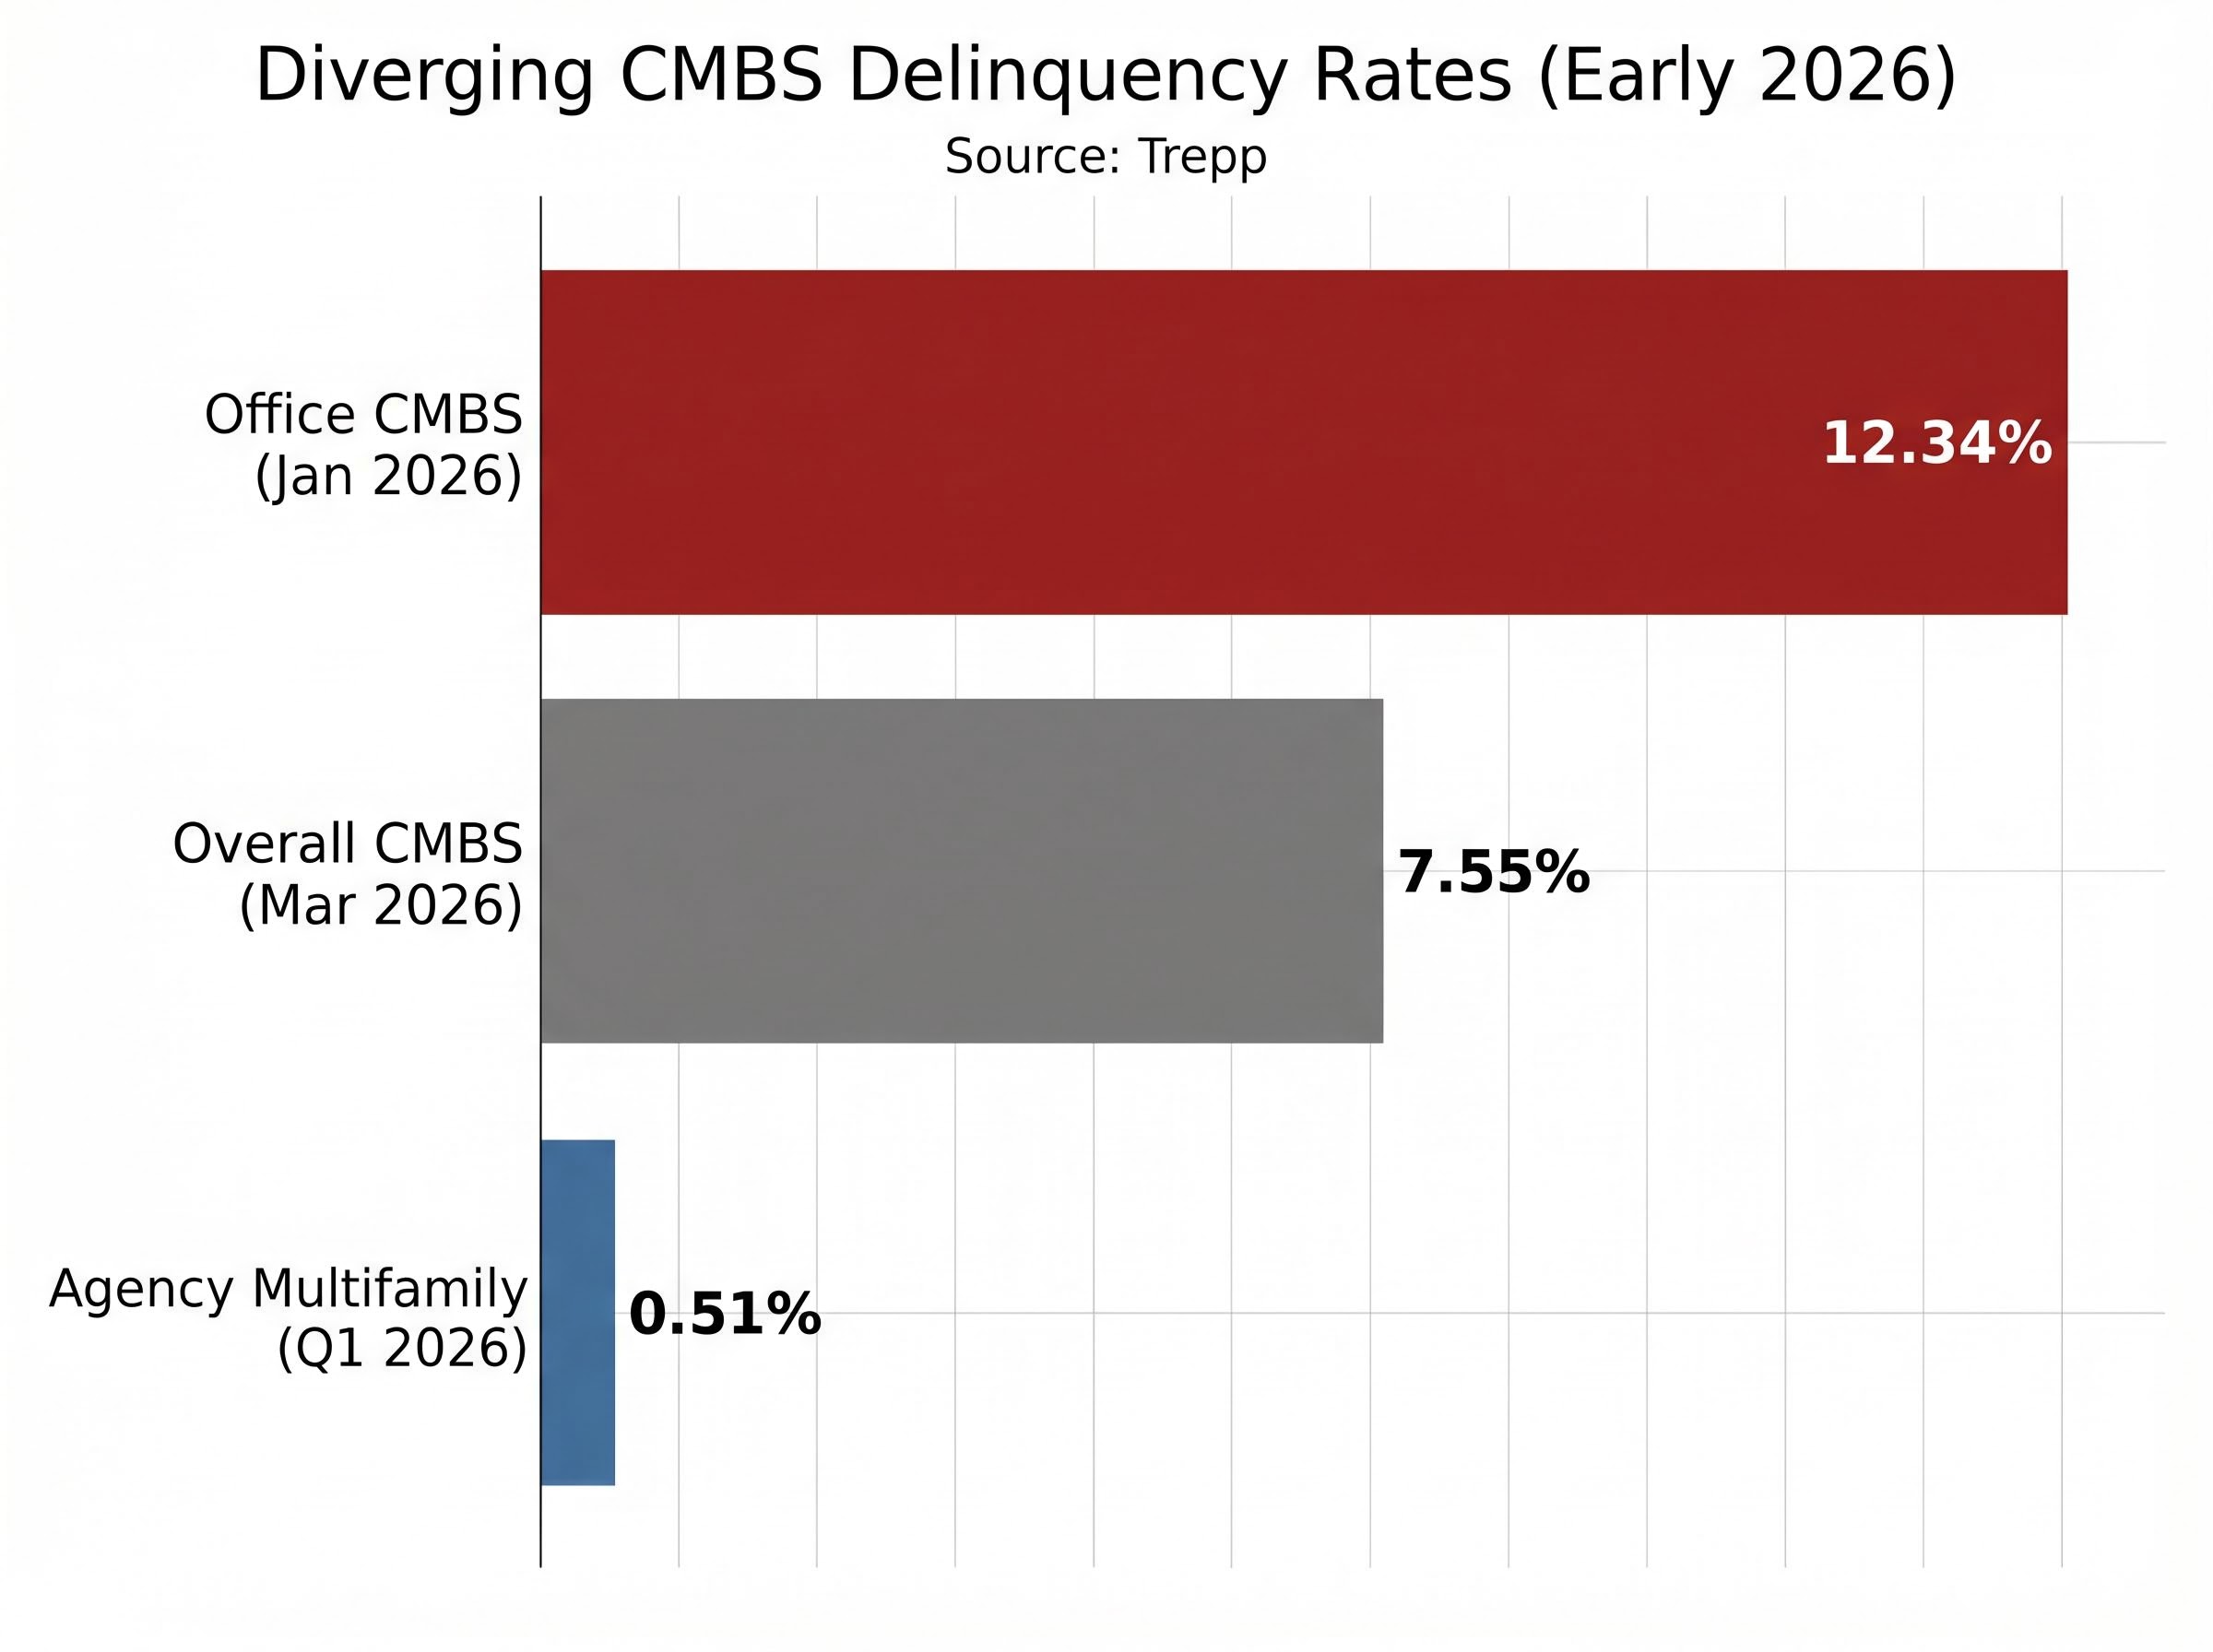
“`json { “fact_checked_full_article”: “Office CMBS delinquency hit 12.34% in January 2026, the highest rate since Trepp began tracking the metric in 2000. At the same time, the S&P 500 has been trading near all-time highs. The gap between equity market strength and the quiet deterioration building in commercial real estate debt markets represents one of the more striking disconnects in the current investment environment. With an estimated $875-$936 billion in CRE loans maturing in 2026 alone, and payoff rates on securitised maturities dropping from 67.8% to 60.0% in recent quarters, the refinancing machinery underpinning a large segment of U.S. real estate is under measurable strain. This analysis breaks down what the CMBS delinquency data signals, how the maturity wall creates compounding pressure, and why regional banks, with an estimated 45% of their loan books tied to CRE lending, represent the clearest transmission channel between credit market stress and the broader economy.\n\n## How CMBS and the commercial real estate debt machine actually works\n\nThe commercial mortgage-backed securities market follows a mechanical sequence that determines how property-level stress becomes investor-level loss. Understanding this chain is the foundation for every risk discussed in this analysis.\n\n1. Loan origination: A bank or lender issues a mortgage to a commercial property owner (office tower, apartment complex, retail centre).\n2. Pooling and securitisation: Hundreds of these individual loans are bundled together into a single pool. That pool is then divided into slices, called tranches, each carrying a different level of risk and return.\n3. Tranche issuance: Investors buy into specific tranches. Senior tranches receive payments first and carry lower yields. Junior tranches absorb losses first but offer higher returns.\n4. Coupon payments: The borrowers’ monthly mortgage payments flow through the structure to pay investors. When borrowers pay on time, the system works as designed.\n5. Loan maturity: Each underlying loan has a fixed term, typically five to ten years. At maturity, the borrower must either refinance into a new loan or pay off the balance.\n6. Refinancing or default: If the borrower cannot refinance or repay, the loan becomes delinquent. Losses travel up through the tranche structure, hitting junior investors first.\n\n\”Delinquency\” in this context means a borrower has either missed payments or failed to refinance at maturity, triggering a chain of consequences through the securitised structure. For years, lenders delayed recognising these failures through a practice known as \”extend and pretend,\” granting loan extensions rather than forcing resolution. That era is ending as rate pressure and maturity volumes converge.\n\n> Forward risk signal: Morningstar DBRS warns that more than half of approximately $100 billion in 2026 securitised CRE mortgages are unlikely to pay off at maturity, pointing to a substantial pipeline of restructurings, extensions, and realised losses ahead.\n\nThe total U.S. CRE loan market stands at approximately $5 trillion outstanding. The maturity figures that follow represent the portion of that total coming due in a compressed window.\n\n## CMBS delinquency: diverging pressures in office and multifamily\n\nThe headline number is stark. Trepp reported office CMBS delinquency at 12.34% in January 2026, a record in over two decades of data collection. The overall CMBS delinquency rate has been climbing alongside it: 7.30% in December 2025, 7.47% in January 2026, a brief dip to 7.14% in February 2026, and then 7.55% in March 2026, the most recent reading available.\n\n> The 12.34% office CMBS delinquency rate recorded in January 2026 is the highest figure since Trepp began tracking the metric in 2000, surpassing levels reached during the 2008-2010 financial crisis aftermath.\n\nKBRA reported approximately $25 billion in total delinquent CMBS balances as of February 2026. That figure captures the accumulated stock of loans that have not resolved cleanly through refinancing or payoff.\n\nThe picture across segments, however, is far from uniform. Agency-backed multifamily delinquency sits at approximately 0.51% as of Q1 2026, according to Trepp. That reading reflects the structural support provided by government-sponsored enterprise (GSE) guarantees through Fannie Mae and Freddie Mac. The gap between 12.34% in office and 0.51% in agency multifamily illustrates how differently stress is distributed across the CRE universe.\n\n
| Segment | Delinquency Rate | Date | Source |
|---|---|---|---|
| Office CMBS | 12.34% | January 2026 | Trepp |
| Overall CMBS | 7.55% | March 2026 | Trepp |
| Agency multifamily | 0.51% | Q1 2026 | Trepp |
| Total delinquent CMBS balance | $25 billion | February 2026 | KBRA |
\n
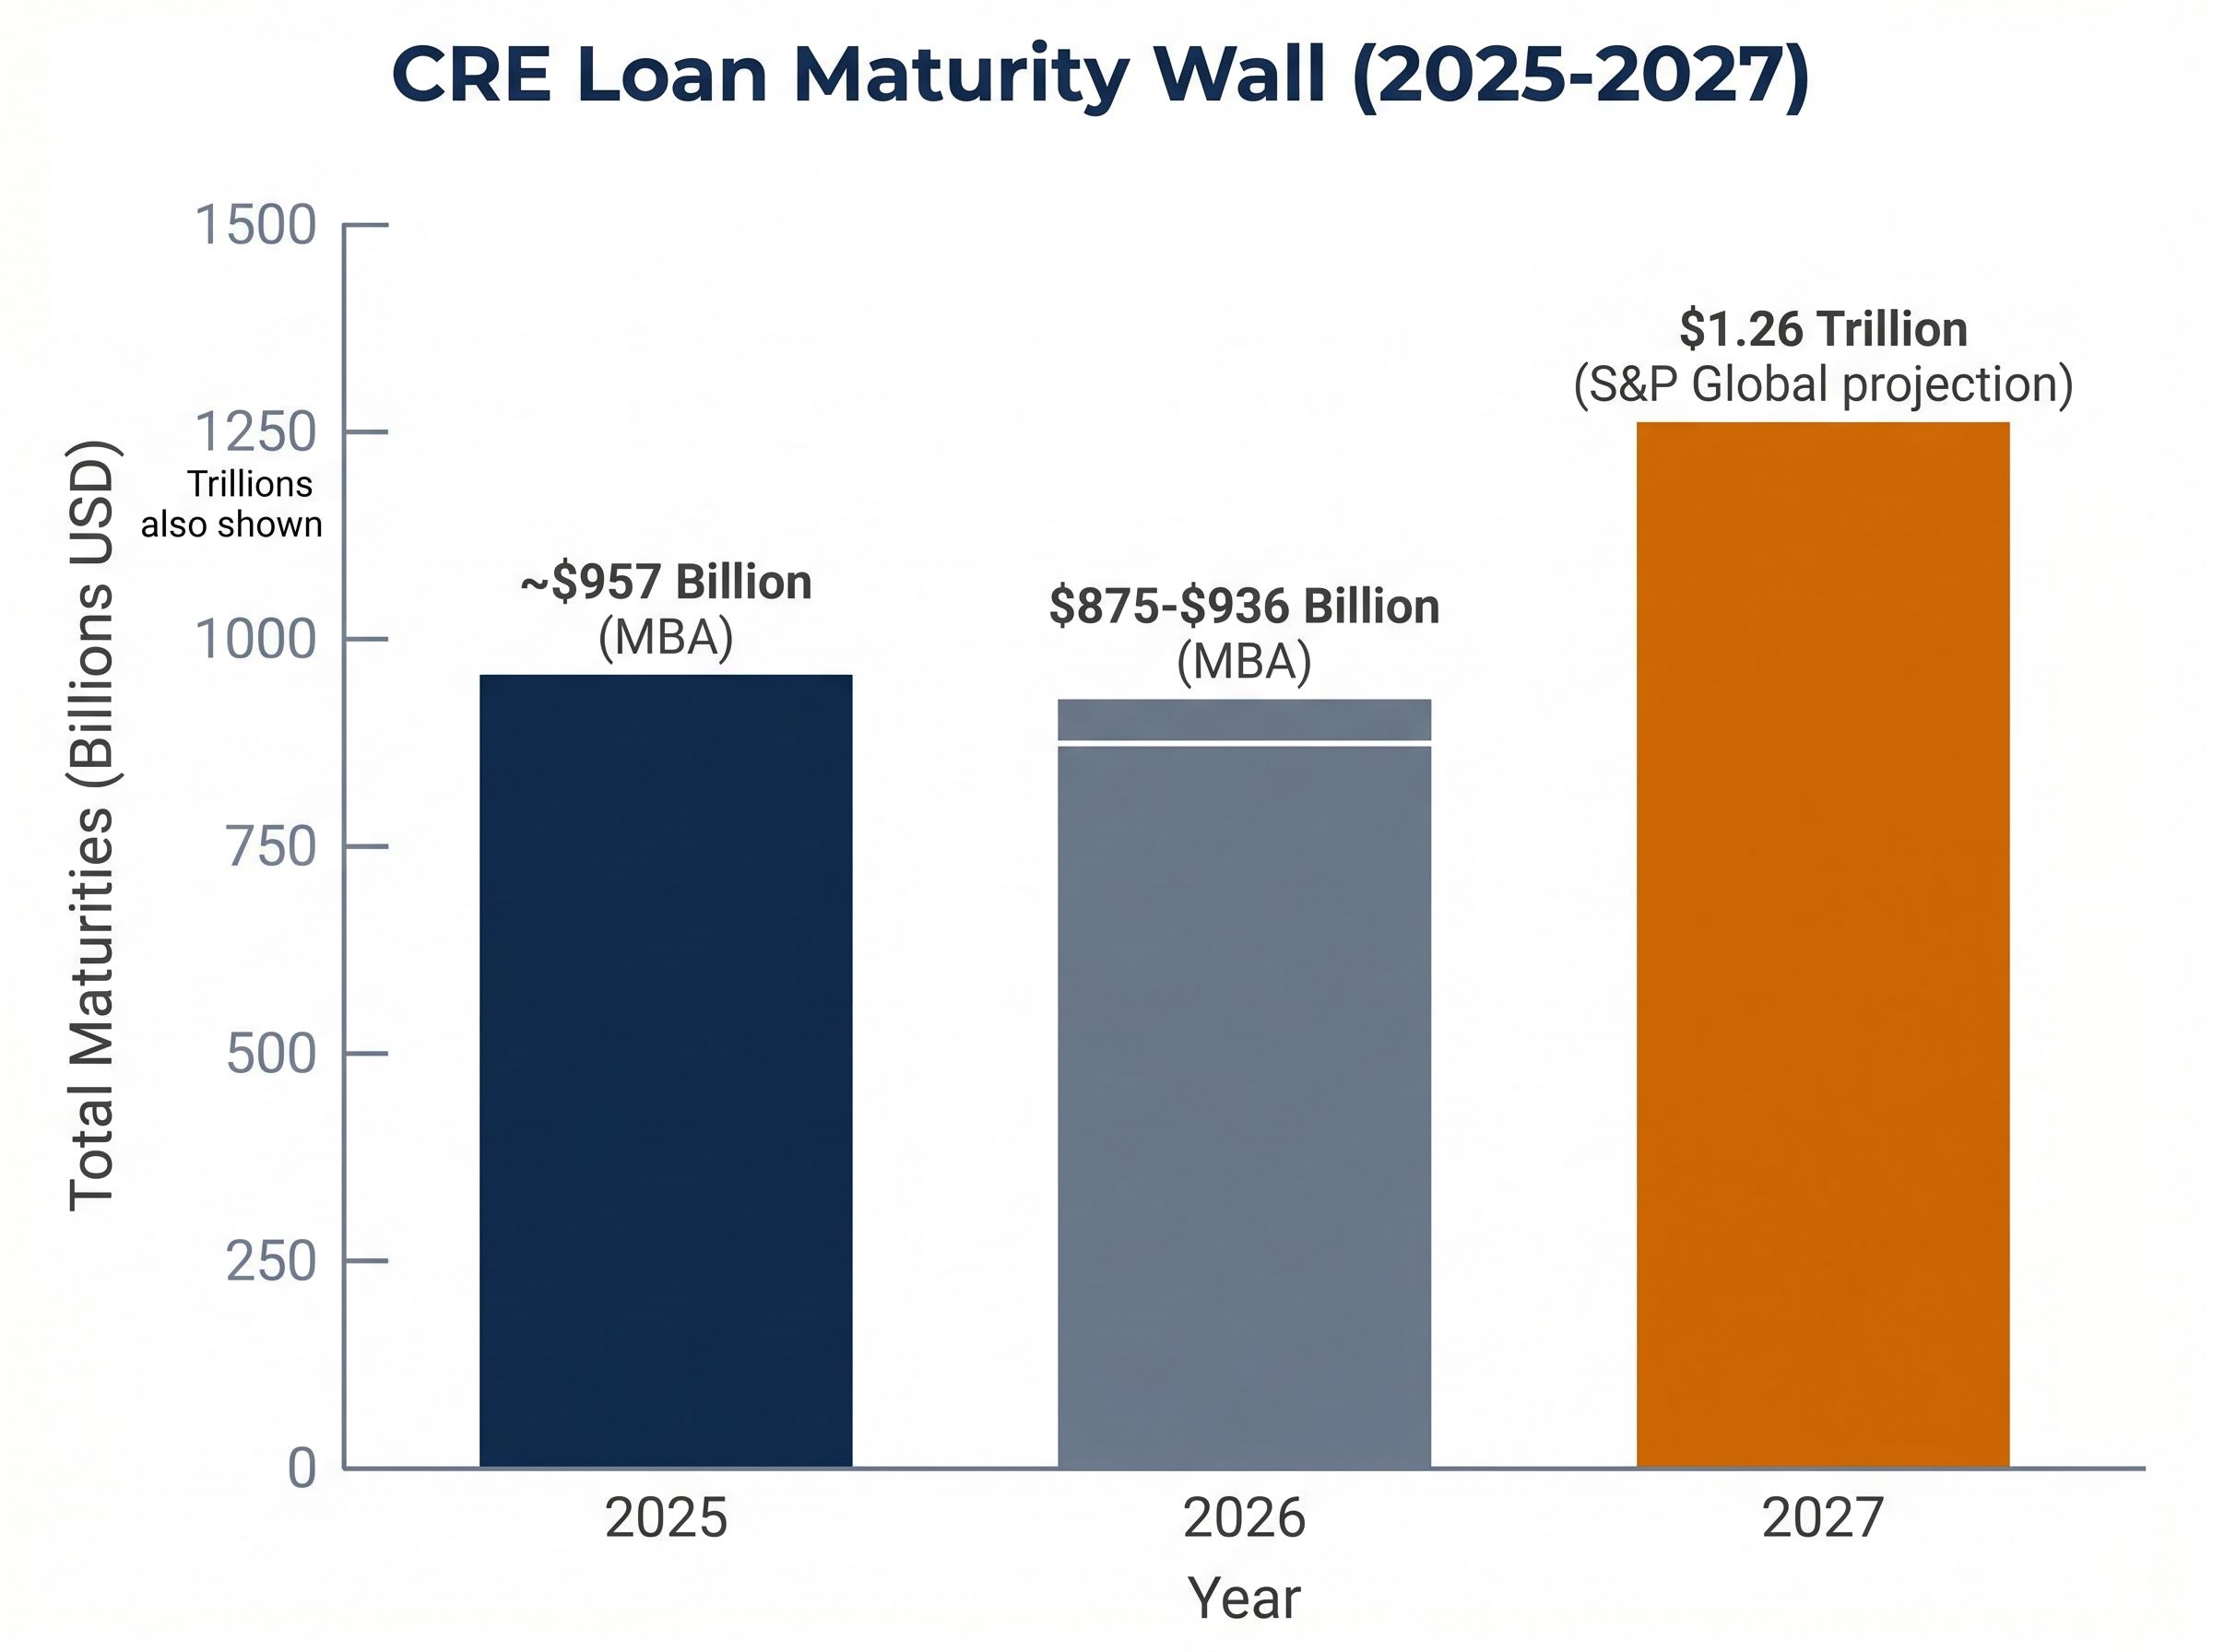
\n\nThe structural forces behind each segment’s trajectory are distinct:\n\n- Office: Hybrid and remote work patterns have produced a secular, not cyclical, reduction in demand. The ending of loan extension accommodations is now converting latent stress into realised delinquencies.\n- Multifamily: A construction wave and rent deceleration in oversupplied markets are creating pressure from the supply side. Non-agency multifamily CMBS, which lacks GSE backing, carries meaningfully higher risk than the agency segment.\n\nThe multifamily picture is worth watching closely. Multifamily CMBS delinquency jumped approximately 30 basis points in March 2026, according to Trepp and Multifamily Dive reporting. That movement, while still modest in absolute terms, may signal that the relatively benign multifamily environment is beginning to shift.\n\n### Agency backing does not mean zero risk in multifamily\n\nThe 0.51% agency multifamily delinquency rate reflects the protection that GSE guarantees provide to investors holding agency-backed securities. Fannie Mae and Freddie Mac absorb credit losses on these pools, insulating bondholders from individual loan defaults.\n\nThat protection, however, does not extend to borrowers, property sponsors, or regional banks holding non-agency multifamily loans. A property owner whose multifamily loan sits outside the agency structure faces the same refinancing challenges as any other commercial borrower. For investors assessing bank-level exposure, the distinction between agency and non-agency multifamily on a bank’s balance sheet is material.\n\n## The maturity wall is arriving at the worst possible moment\n\nThe scale of CRE loans coming due over the next two years is not just large; it is accelerating into a tightening environment.\n\n1. 2025: Approximately $957 billion in commercial and multifamily loan maturities, according to the Mortgage Bankers Association (MBA).\n2. 2026: An estimated $875-$936 billion in total CRE maturities, with approximately $100 billion in the securitised segment alone (Morningstar DBRS) and $76.6 billion in hard CMBS maturities (Trepp).\n3. 2027: S&P Global projects a peak of $1.26 trillion in CRE maturities, the highest annual volume in the cycle.\n\n
| Year | Total CRE Maturities | Securitised Subset | Payoff Rate |
|---|---|---|---|
| 2025 | ~$957 billion (MBA) | N/A | 67.8% (earlier quarters) |
| 2026 | $875-$936 billion (MBA) | ~$100 billion (Morningstar DBRS) | 60.0% (Q1 2026) |
| 2027 (projected) | $1.26 trillion (S&P Global) | TBD | TBD |
\n
\n\nRegional banks, the primary CRE refinancing intermediaries, have pulled back. Loan-to-value ratios have been reduced, credit criteria tightened, and lending postures turned selective. That contraction in available credit is occurring at the moment the system needs the most refinancing capacity.\n\n### Declining payoff rates mean losses are no longer theoretical\n\nThe payoff rate on maturing securitised CRE loans tells the story most directly.\n\n> Morningstar DBRS data shows payoff rates on securitised CRE maturities have fallen from 67.8% to 61.7% in Q4 2025 to 60.0% in Q1 2026. Roughly 40% of securitised maturities are not paying off on schedule.\n\nFor every 100 loans reaching maturity in the securitised segment, approximately 40 are not resolving as expected. Those 40 loans enter a pipeline of extensions, restructurings, discounted payoffs, or outright losses. The $25 billion total delinquent CMBS balance reported by KBRA as of February 2026 represents the accumulated stock of this unresolved stress. That stock is growing, not shrinking.\n\n## Why regional banks are the exposure investors should be watching most closely\n\nThe delinquency data and maturity wall numbers describe market-level stress. Regional banks are where that stress translates into balance sheet risk that retail investors can track directly.\n\nRegional banks carry an estimated 45% of their loan books in CRE lending (an unverified estimate from secondary commentary sources), a concentration level that makes them structurally far more exposed than large money-centre banks with diversified balance sheets. That concentration creates a direct transmission mechanism: as more CRE loans mature and fail to refinance cleanly, regional banks must either extend the loans (keeping deteriorating risk on their balance sheets), accept losses on restructurings, or absorb collateral value declines against outstanding loan balances.\n\nThe tightened underwriting standards these banks have adopted are both a defensive response to existing stress and a potential amplifier of the refinancing gap. Less available credit means more maturity failures, which means more losses flowing back onto the same balance sheets that are already pulling back. Set against the $875-$936 billion in 2026 maturities, the scale of the refinancing challenge these institutions face is substantial.\n\n### What to look for in regional bank earnings and filings\n\nInvestors holding regional bank stocks, exchange-traded funds, or funds with regional bank exposure can monitor specific disclosures for early warning signals:\n\n- CRE loan concentration percentage in 10-Q footnotes (typically reported as a percentage of total loans)\n- Provision for credit losses on the income statement, particularly trends in CRE-specific provision levels\n- Net charge-off rates on CRE portfolios in the credit quality schedule\n- Loan-to-value ratios on new CRE originations, which signal underwriting appetite\n- Proportion of CRE loans on extension versus those paying off at maturity, which indicates the volume of deferred loss recognition\n\nRising provision-to-loan ratios in CRE categories function as an early warning signal, not a lagging one. These disclosures are available in SEC EDGAR 10-Q filings and FDIC/OCC quarterly banking reports.\n\n## What this means for investors navigating a stretched market\n\nEquity indexes at record highs and credit-layer stress building simultaneously is not necessarily a contradiction. Markets can price equities for growth while credit markets absorb sector-specific losses. The risk is that the margin of error compresses for investors who are not watching both layers.\n\nThe conditions that would signal CRE credit stress becoming systemic rather than sector-contained are identifiable and trackable:\n\n- Overall CMBS delinquency accelerating beyond the current 7.55% (Trepp, March 2026 baseline). Source: Trepp monthly reports.\n- Securitised payoff rates falling below 55% from the current 60.0% (Morningstar DBRS, Q1 2026 baseline). Source: Morningstar DBRS quarterly publications.\n- Regional bank CRE charge-off rates rising sharply in Q2 or Q3 2026 earnings. Source: SEC EDGAR 10-Q filings and FDIC quarterly banking profiles.\n- Consumer sentiment deterioration and small business capital expenditure decline, which Bret Jensen at Seeking Alpha has flagged as macro context suggesting the economic cushion absorbing CRE stress is thinner than headline equity indexes imply. Source: University of Michigan consumer sentiment survey, NFIB small business surveys.\n\n> S&P Global projects CRE maturities will reach $1.26 trillion in 2027, above both the 2025 and 2026 volumes. The maturity pressure cycle has not yet peaked.\n\nThe 2027 projection means the current stress cycle extends well beyond this year. Investors who establish a monitoring framework now have the advantage of evidence-based positioning before conditions tighten further, rather than reacting after credit deterioration becomes visible in equity prices.\n\nThis article is for informational purposes only and should not be considered financial advice. Investors should conduct their own research and consult with financial professionals before making investment decisions.\n\nPast performance does not guarantee future results. Financial projections, including maturity volume estimates and delinquency rate trajectories, are subject to market conditions and various risk factors.\n\n## The bottom line\n\nRecord office CMBS delinquency, a maturity wall that has not yet peaked, declining payoff rates, and concentrated regional bank exposure represent a coherent set of compounding risks that equity index performance alone does not capture. The data is institutional, verifiable, and directionally consistent across multiple sources: Trepp, Morningstar DBRS, KBRA, MBA, and S&P Global all point toward the same conclusion.\n\nThe stress is building. The 2027 maturity peak of $1.26 trillion means the resolution timeline extends well beyond 2026. Investors who incorporate credit-layer monitoring into their process, tracking the specific delinquency, payoff, and bank disclosure metrics outlined above, are better positioned to distinguish between a contained sector correction and a broader credit event before equity markets are forced to price the difference.\n\n—” } “`
The same maturity pressure compressing CMBS payoff rates is running through private credit simultaneously; private credit valuation gaps and the 2026 maturity wall have produced secondary market bids at roughly 65 cents on the dollar against stated net asset values, a pricing signal that suggests broader credit stress is not confined to the securitised real estate segment alone.
NBER research on monetary tightening and commercial real estate distress estimates that a 10% to 20% default rate on CRE loans could produce up to $160 billion in additional bank losses and materially increase insolvency risk across hundreds of regional institutions, a scale that gives quantitative grounding to the balance sheet concerns the current delinquency trajectory implies.
CMBS delinquency measures the percentage of loans in commercial mortgage-backed securities pools where borrowers have missed payments or failed to refinance at maturity. Rising delinquency rates signal credit stress building in the commercial real estate sector, which can flow through to regional bank balance sheets and broader financial markets.
Office CMBS delinquency reached a record 12.34% in January 2026, the highest since Trepp began tracking the metric in 2000, while overall CMBS delinquency hit 7.55% in March 2026 and roughly 40% of securitised maturities are not paying off on schedule. An estimated $875-$936 billion in CRE loans mature in 2026 alone, with the peak maturity year of $1.26 trillion projected for 2027.
Regional banks carry an estimated 45% of their loan books in CRE lending, making them far more concentrated than large money-centre banks. When CRE loans fail to refinance cleanly, regional banks must extend deteriorating loans, absorb restructuring losses, or write down collateral values, creating a direct transmission channel between CRE credit stress and broader economic risk.
Investors should watch overall CMBS delinquency rates (currently 7.55% as of March 2026), securitised payoff rates (currently 60.0% as of Q1 2026), and regional bank CRE charge-off rates disclosed in SEC EDGAR 10-Q filings and FDIC quarterly banking profiles. A payoff rate drop below 55% or accelerating charge-off rates in Q2-Q3 2026 earnings would be key escalation signals.
Extend and pretend refers to the practice of lenders granting loan extensions to struggling commercial property borrowers rather than forcing resolution through foreclosure or loss recognition. This practice has delayed the recognition of CRE credit stress, but rising interest rates and accelerating maturity volumes are now ending this era and converting deferred losses into realised delinquencies.


