How $4B in Fuel Costs Erased American Airlines’ Record Q1
31 mins ago
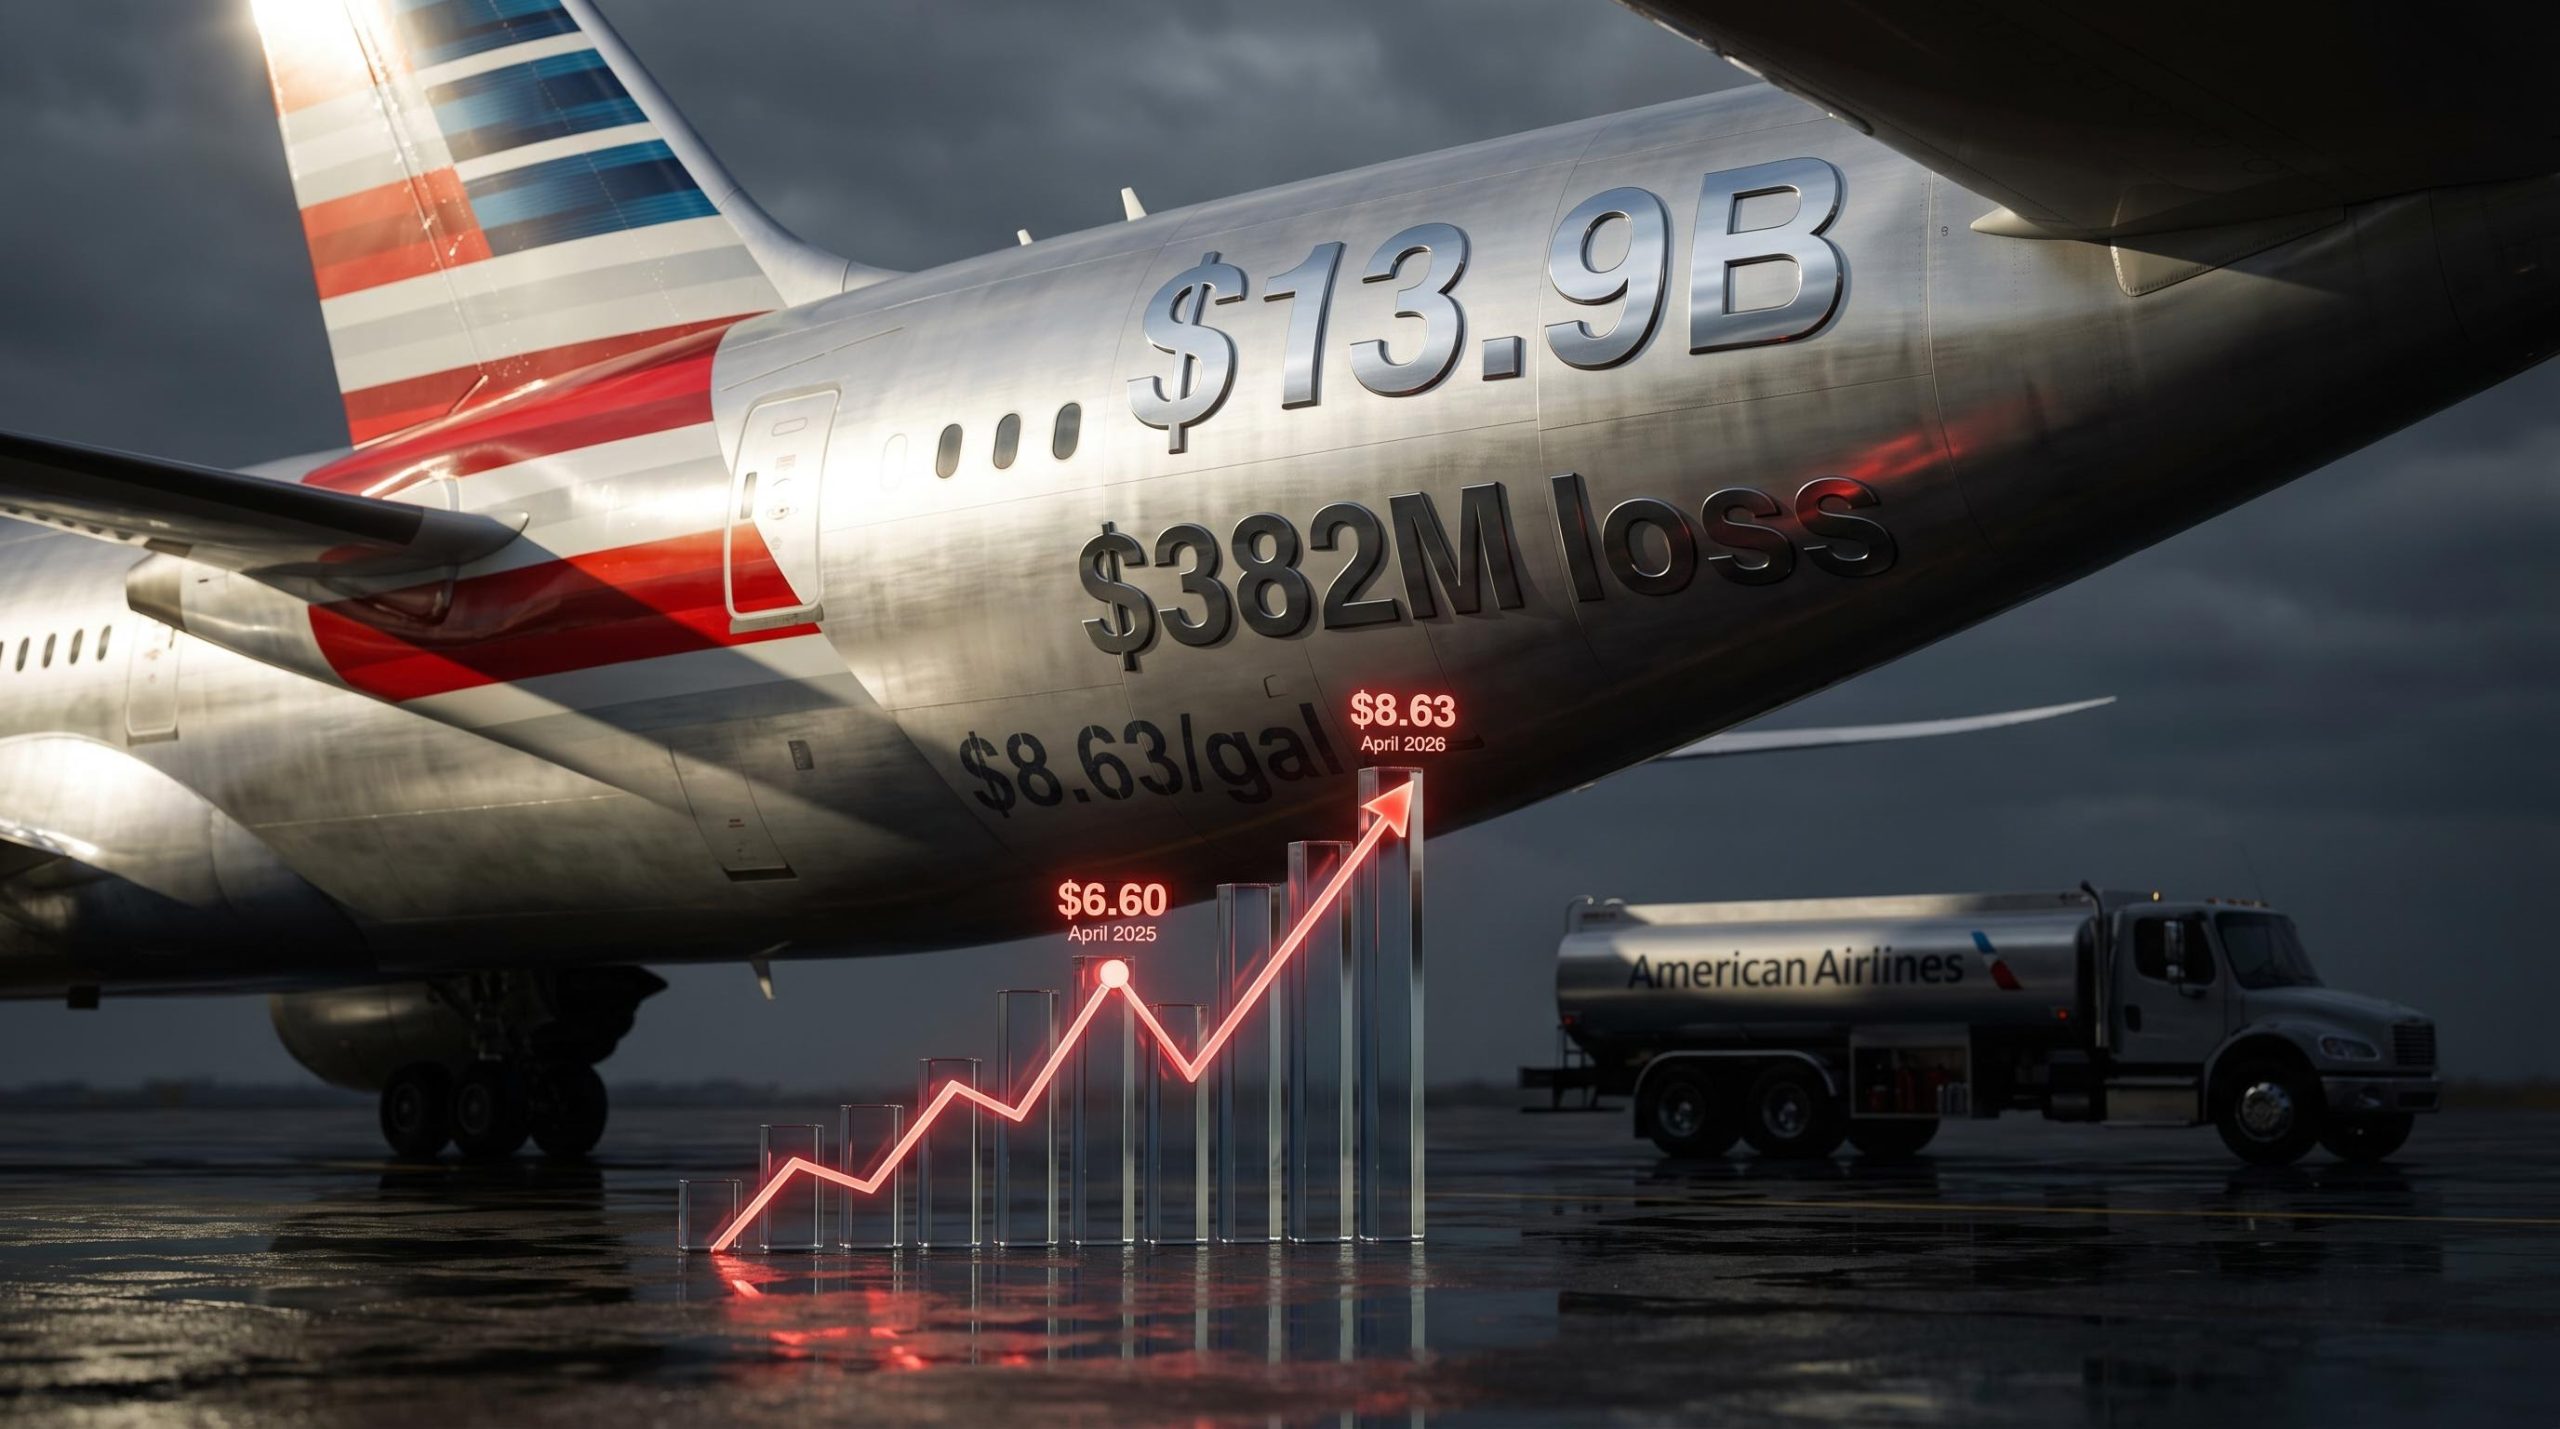
American Airlines closed its first quarter of 2026 with record revenue of $13.9 billion while simultaneously posting a $382 million GAAP net loss, a tension that captures the brutal economics facing U.S. carriers as jet fuel prices spike above $8.60 per gallon. The April 23 earnings release landed as geopolitical disruptions push fuel costs to levels not seen since 2008, forcing investors to weigh whether the airline’s optimistic full-year guidance can survive an external cost shock that has already overwhelmed $400 million in forward curve assumptions. What follows breaks down the numbers that matter, the fuel dynamics reshaping profitability expectations, and whether American’s premium revenue strategy can offset structural disadvantages versus Delta and United.
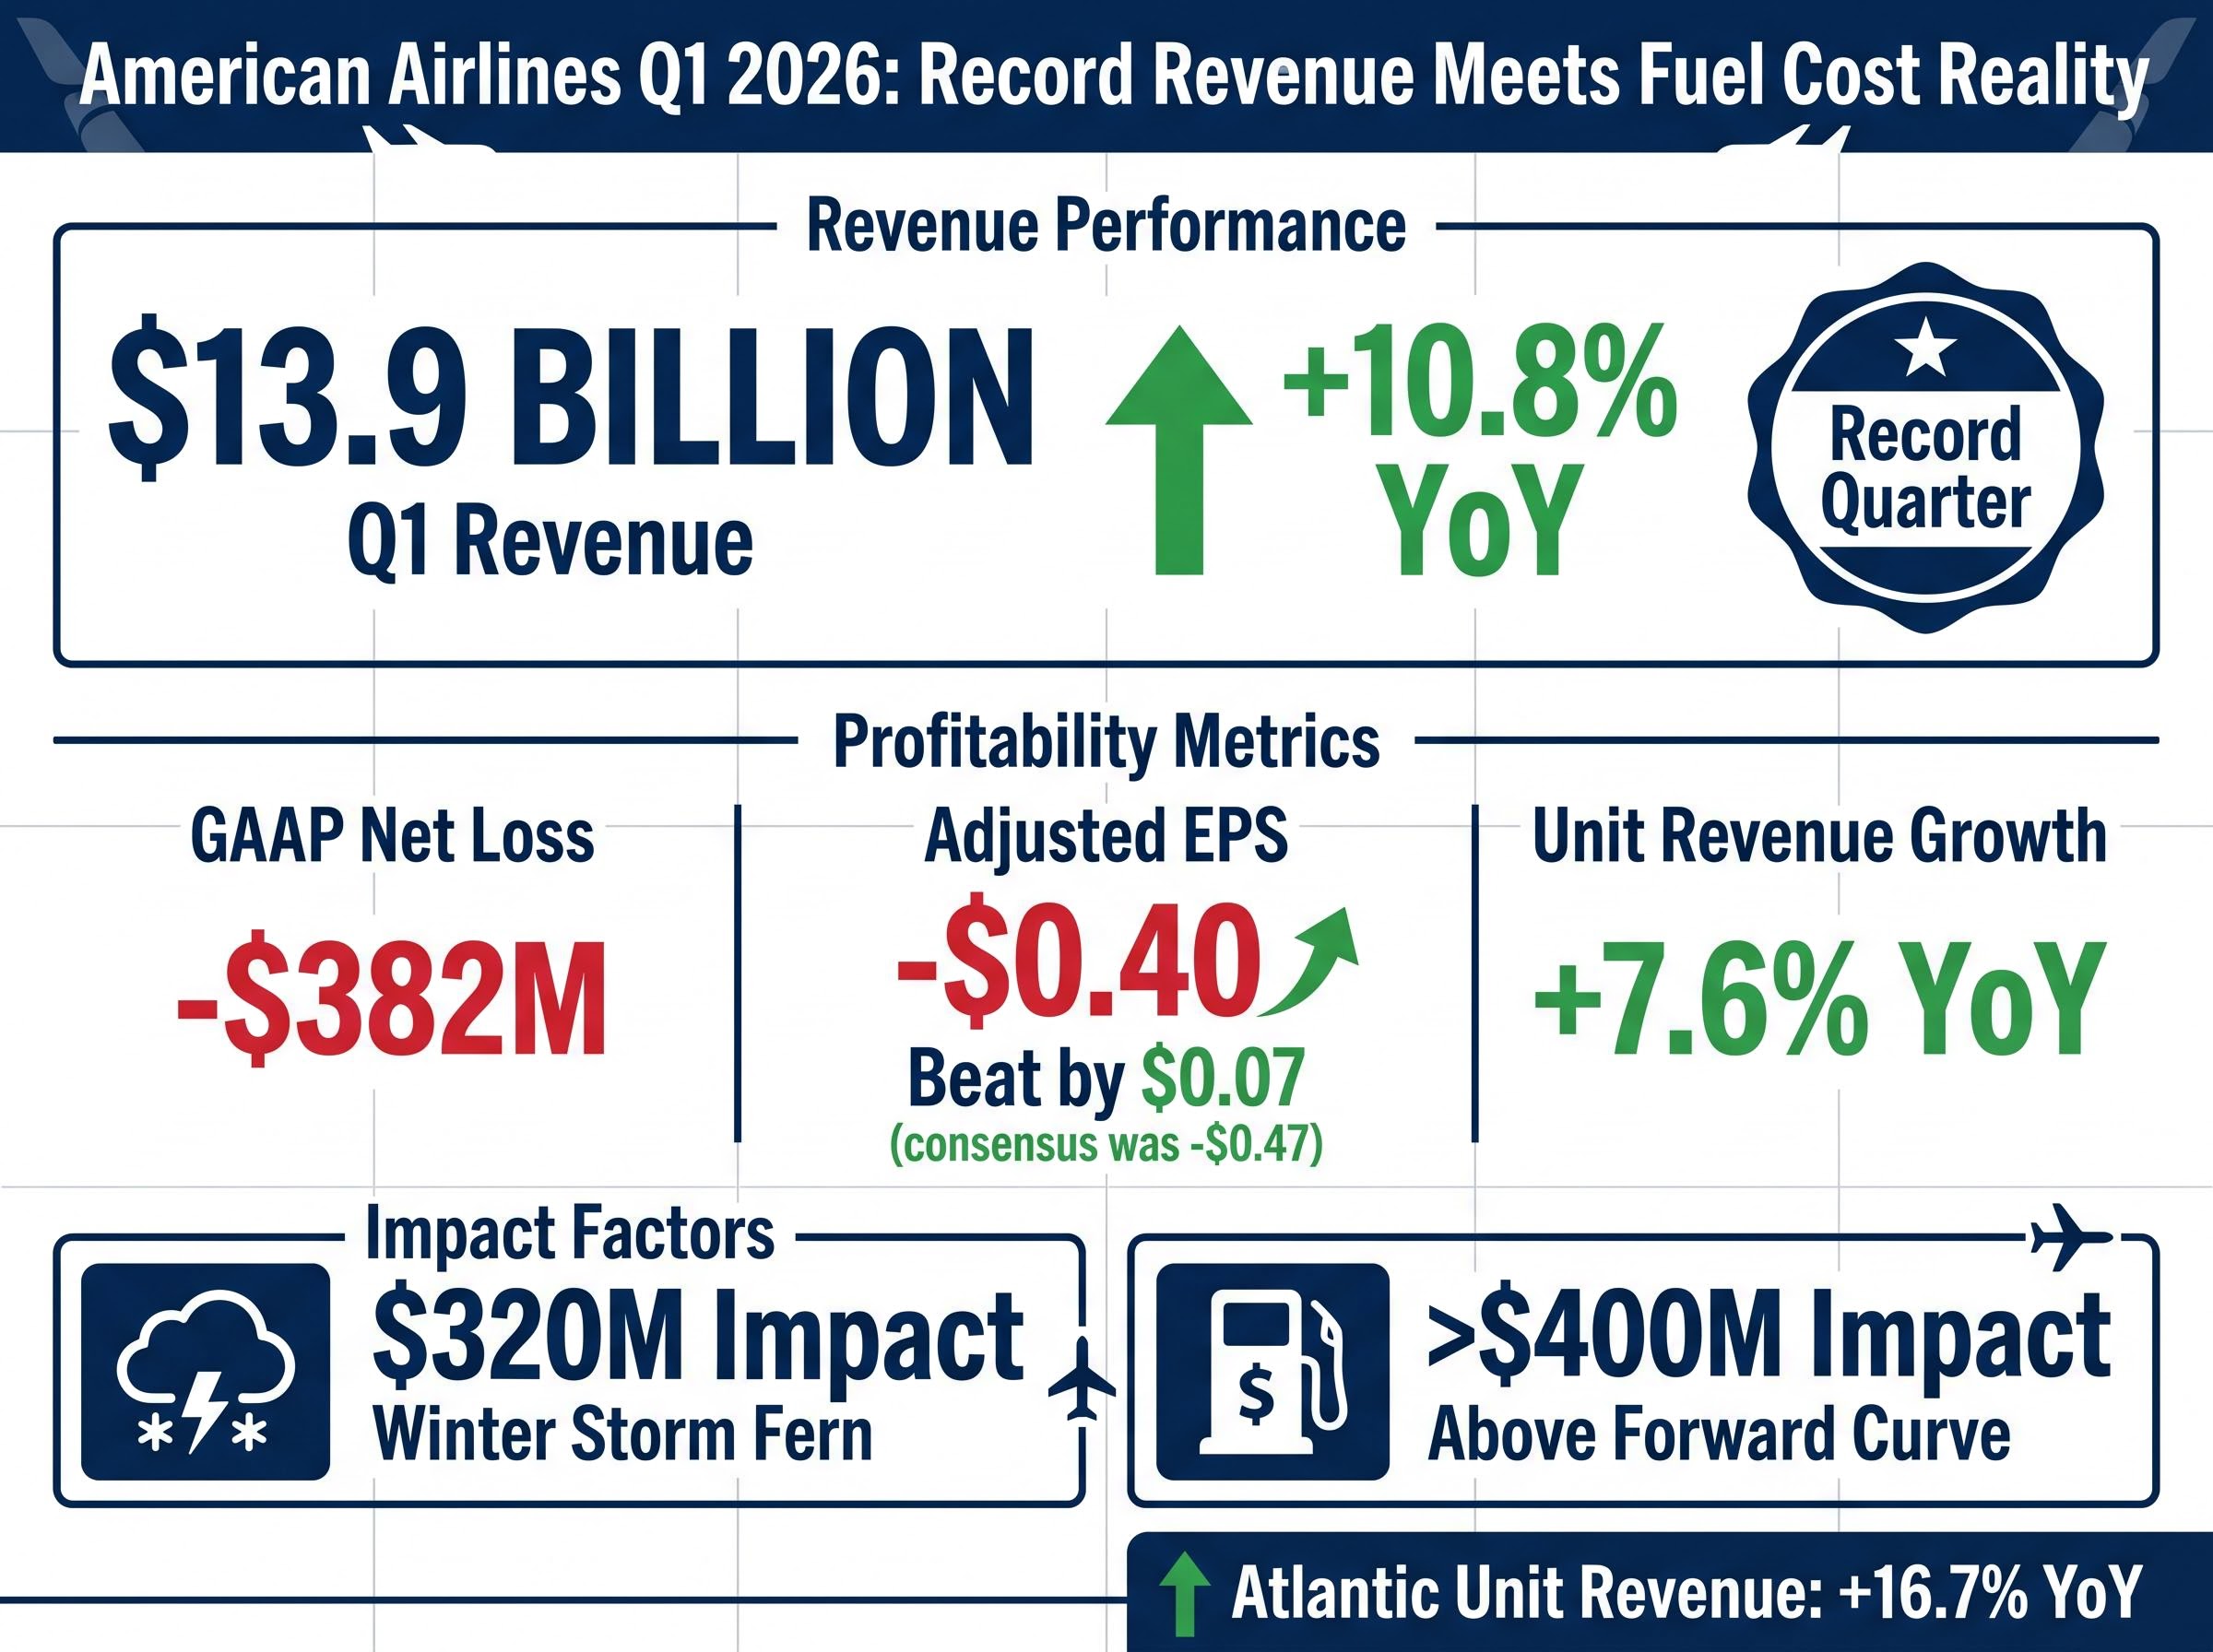
American Airlines beat consensus on adjusted earnings per share, delivering negative $0.40 versus the expected negative $0.47, a seven-cent positive surprise that signals operational execution remains competitive despite external headwinds. The beat matters because it reverses the narrative from Q4 2025, when the carrier missed estimates by 58 percent with earnings per share of $0.16 against consensus of $0.38.
The headline numbers tell the rest of the story:
The $13.9 billion quarter represents the nine highest revenue intake weeks in the airline’s 100-year history, a concentration of strong booking weeks that management framed as evidence of robust demand extending into future quarters. Strip out the $320 million weather headwind from Winter Storm Fern and associated capacity reductions, and the underlying revenue performance strengthens further.
The carrier reduced planned capacity deployment by 1.5 percentage points due to weather disruptions, yet still delivered record first-quarter revenue, suggesting pricing power and demand resilience exceeded initial expectations.
But revenue momentum could not offset the fuel cost shock. American quantified the impact of jet fuel prices exceeding forward curve assumptions at over $400 million in Q1 alone, the primary driver of the $382 million GAAP loss. This is where the paradox becomes visible. Record revenue delivered an absolute loss because fuel costs moved faster than the airline’s ability to pass them through via pricing.
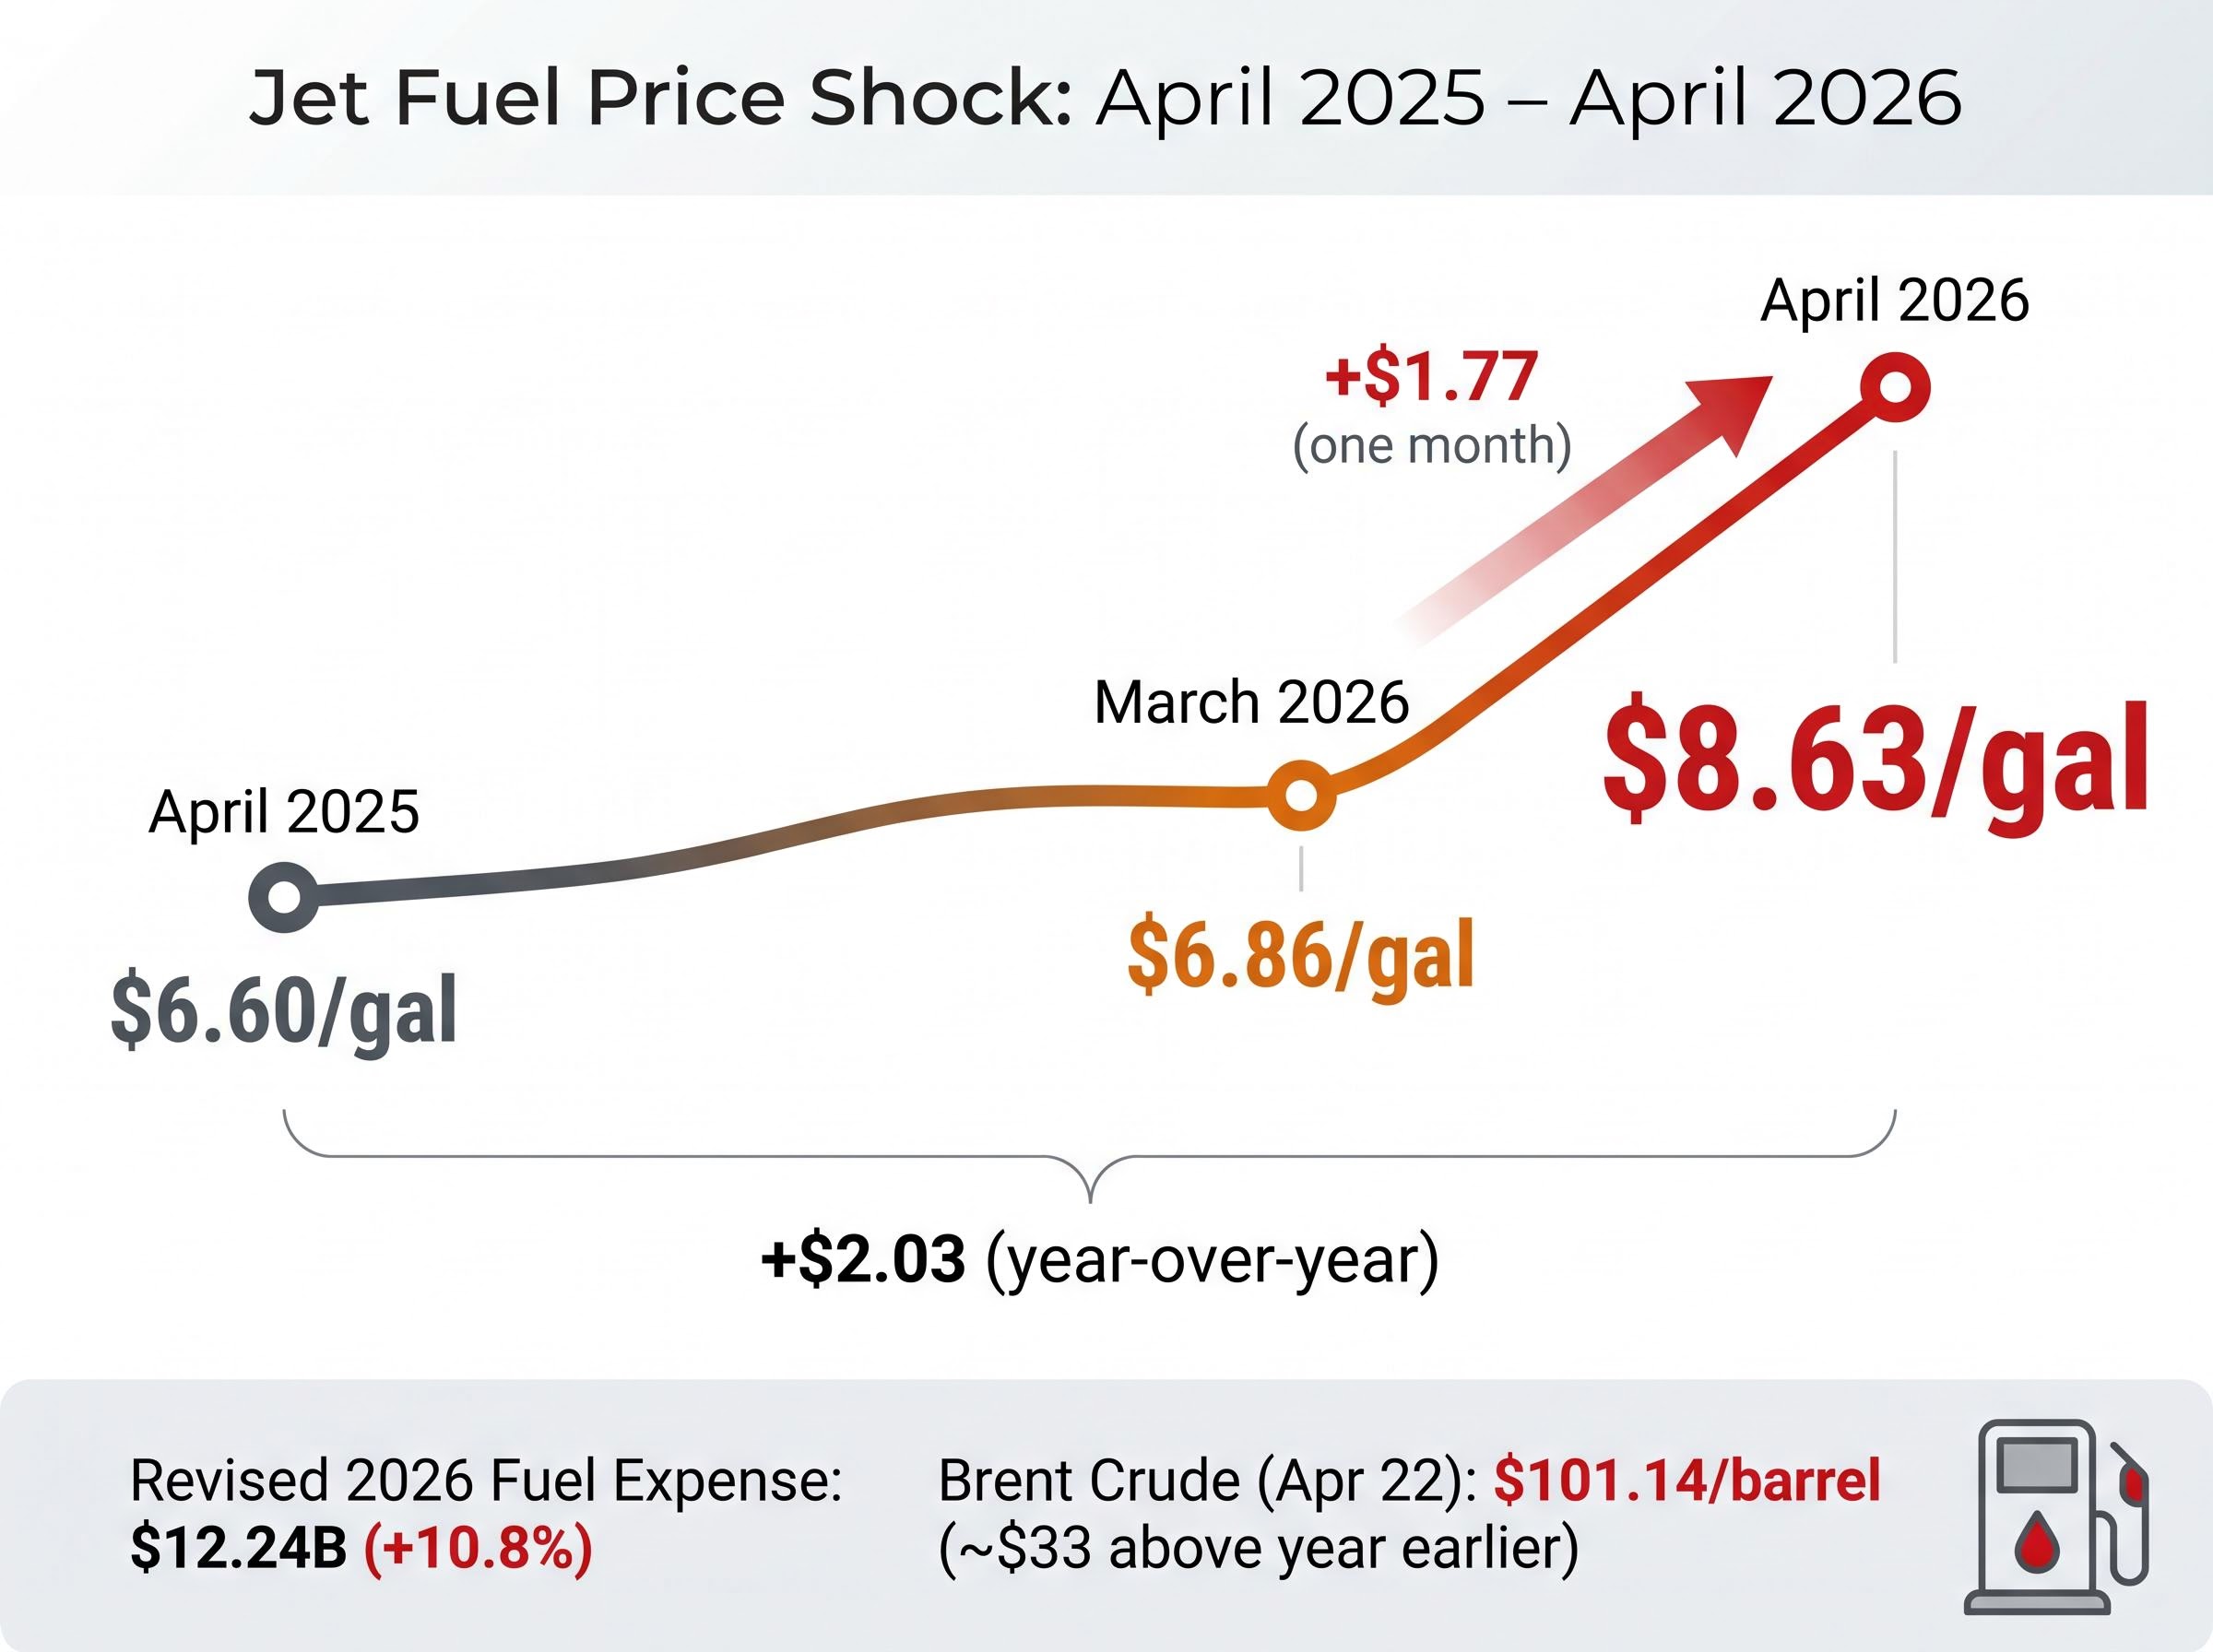
Jet fuel prices in the United States averaged $8.63 per gallon in April 2026, an increase of $1.77 compared to March and $2.03 compared to April 2025. American, along with United and Southwest, faces the full impact of these prices because none of the three carriers maintains active financial hedging programmes. Delta’s partial insulation through its Monroe Energy refinery operations provides some protection, a structural advantage that sharpens the competitive gap when fuel prices spike.
The Bureau of Transportation Statistics February 2026 aviation fuel data confirms industry-wide consumption patterns through the first two months of the quarter, providing official government benchmarks against which carriers measure operational fuel efficiency and cost exposure. American’s unhedged position means the carrier absorbs the full impact of spot market price movements captured in these federal statistics, with no derivative contracts to smooth volatility during geopolitical disruptions.
| Period | Average Jet Fuel Price (per gallon) | Change vs. Prior Period |
|---|---|---|
| April 2026 | $8.63 | +$1.77 (vs. March 2026) |
| March 2026 | $6.86 | — |
| April 2025 | $6.60 | +$2.03 (vs. April 2026) |
The speed of the price spike matters because airlines cannot immediately pass through costs via pricing. Revenue management systems, advance bookings, and competitive dynamics create inevitable near-term margin compression. American’s revised 2026 fuel expense projection stands at $12.24 billion, up 10.8 percent from pre-conflict estimates established before the Iran disruption began in February 2026.
The revenue-to-loss paradox reflects a structural cost shock affecting all unhedged carriers, with fuel representing approximately 45% of operating costs industry-wide following the Strait of Hormuz supply disruption in February 2026.
The Iran-driven closure of the Strait of Hormuz pushed Brent crude to $101.14 per barrel on April 22, approximately $33 above the same period one year earlier. Iran announced the strait was “completely open” to commercial traffic on April 24, triggering an 11 percent decline in Brent, but the situation remains fragile. Even partial re-escalation could trigger additional fuel price spikes, a risk baked into the wide guidance ranges American provided for Q2 and full-year 2026.
The Marine Link coverage of Strait of Hormuz shipping disruptions documents the April 2026 attacks on commercial vessels that drove Brent crude above $101 per barrel, providing independent corroboration of the geopolitical events underlying the fuel cost shock. Iran’s subsequent announcement of resumed commercial traffic triggered an 11 percent crude price decline, but the incident underscores the fragility of Middle East energy supply routes and the speed with which carrier fuel expenses can spike when chokepoint disruptions occur.
Investors must understand that fuel represents a structural headwind baked into 2026 results regardless of operational execution. The quarterly impact of over $400 million demonstrates that even record revenue cannot fully offset $8.60-plus jet fuel when the carrier lacks hedging protection.
American’s $13.9 billion in Q1 revenue positions it materially below Delta and United on an absolute basis, a gap that reflects competitive disadvantages in premium cabin positioning, corporate travel share, and network economics.
United’s Q1 adjusted earnings per share of $1.19 represents 31 percent year-over-year growth, evidence of stronger near-term execution despite facing identical fuel cost pressures. United delivered profitability where American posted a loss, a margin differential that underscores the structural challenges American carries.
United’s 35-40% full-year guidance cut, announced the same day as American’s Q1 results, demonstrates that even operationally stronger carriers cannot escape the sector-wide fuel cost shock, with United projecting $1.5-2 billion in additional annual fuel expenses despite partial hedging.
United has revised its full-year 2026 earnings guidance downward from $12-$14 per share to $7-$11 per share, a dramatic 35-40 percent reduction that demonstrates even the strongest operational performers cannot escape the fuel cost shock.
All three carriers have cut full-year guidance due to fuel, but American’s starting margin position was weakest entering the crisis. The carrier’s higher debt load ($34.7 billion, lowest since mid-2015 but still the highest among legacy carriers), recent labour cost settlements, and lack of fuel hedging mean the carrier has less margin cushion than competitors.
Delta’s structural advantages, particularly premium cabin focus, higher-yield corporate travel positioning, and the Monroe Energy refinery, allow the carrier to generate substantially higher earnings despite facing similar external pressures. United’s stronger Q1 profitability relative to American suggests premium cabin expansion and international network strategies are generating margin-accretive revenue that exceeds the impact of elevated labour costs.
Investors should weigh whether American’s premium revenue initiatives and loyalty monetisation can close this gap over time, or whether structural disadvantages persist regardless of execution.
American’s full-year 2026 adjusted earnings per share guidance of $1.70 to $2.70 (midpoint $2.20) implies substantial margin recovery in the second half of 2026, a projection that requires either fuel price moderation or successful pricing pass-through at scale.
The three critical guidance metrics:
The Q2 range, spanning from negative $0.20 to positive $0.20, signals genuine management uncertainty about fuel trajectory and the pace at which pricing actions flow through the income statement. The width of this range reflects the binary nature of the fuel price question. If prices stabilise or moderate, American swings to profitability in Q2. If prices persist at April levels or spike further, the carrier remains in loss territory.
Management projects Q2 revenue growth of 13.5 to 16.5 percent year-over-year, substantially stronger than Q1’s 10.8 percent growth. This acceleration assumes continued pricing power and demand momentum, with March domestic and international passenger unit revenue both growing more than 10 percent year-over-year providing early evidence that sequential improvement is materialising.
Qantas’s April market update provides evidence of pricing pass-through strategies under extreme cost pressure, with the carrier doubling international RASK guidance to 4-6% while simultaneously cutting domestic capacity by approximately 5 percentage points, a dual-lever response American must replicate to achieve its optimistic full-year guidance.
The free cash flow guidance exceeding $2 billion connects directly to the debt reduction target of sub-$35 billion by year-end 2026. American reduced total debt to $34.7 billion in Q1, the lowest level since mid-2015 and approximately $1.8 billion below the year-end 2025 level of $36.5 billion. Achievement of the sub-$35 billion target could trigger a credit rating upgrade from S&P, currently at B+ with a stable outlook, lowering refinancing costs and unlocking institutional demand.
The wide guidance ranges reflect genuine uncertainty. Achieving the optimistic end requires fuel price stabilisation and sustained pricing power. The pessimistic end assumes continued margin pressure through mid-year, with operational leverage working in reverse if demand softens or fuel spikes again.
American’s path to closing the margin gap with Delta runs through three structural initiatives: premium seat expansion, A321XLR network deployment, and loyalty programme monetisation. Early evidence suggests these strategies are generating measurable revenue uplift, though the translation into Delta-like profitability margins remains uncertain.
The Flagship Suite, American’s new business class product featuring privacy doors and enhanced seating, has begun rolling out across the fleet and is generating revenue uplift in routes where deployed. The transatlantic segment delivered unit revenue growth of 16.7 percent year-over-year in Q1, suggesting premium international travel remains resilient despite broader economic uncertainty.
The A321XLR represents a material network advantage once delivery rates accelerate. The aircraft offers approximately 4,700 nautical miles of range, enabling efficient narrow-body operations on routes where wide-body economics previously made service unprofitable. American has scheduled the first transatlantic A321XLR service from New York JFK to Edinburgh on March 8, 2026, establishing the blueprint for secondary European city expansion as deliveries increase.
Investors should monitor premium revenue growth and loyalty economics as leading indicators of whether the structural transformation is working. These initiatives represent American’s competitive response to Delta’s premium cabin advantage and United’s international network strength. Success requires execution at scale over multiple years, not quarters.
American Airlines’ Q1 2026 results demonstrate operational execution within a brutal external environment, but the $382 million GAAP loss underscores that record revenue alone cannot offset $8.60-plus jet fuel when structural hedging protection is absent. The carrier beat adjusted earnings per share consensus by seven cents, reversed the Q4 2025 miss narrative, and delivered the nine highest revenue intake weeks in company history despite $320 million in weather disruptions.
The full-year guidance of $1.70 to $2.70 in adjusted earnings per share implies substantial margin recovery in the second half of 2026, which requires either fuel price moderation or successful pricing pass-through at scale. The wide Q2 range (negative $0.20 to positive $0.20) signals management uncertainty about which scenario materialises.
Competitive disadvantages versus Delta and United persist. American carries higher debt ($34.7 billion), faces higher labour costs, and lacks the fuel hedging or refinery assets that provide partial insulation to competitors. Premium revenue initiatives and loyalty monetisation represent the path to closing the margin gap, but execution must occur at scale over years, not quarters.
Q2 results will provide the next critical data point on whether American’s full-year guidance remains achievable or requires downward revision. Investors should monitor fuel price trends and premium revenue growth metrics in coming quarters as the key variables that will determine whether the optimistic guidance materialises or whether the external cost shock overwhelms operational execution.
This article is for informational purposes only and should not be considered financial advice. Investors should conduct their own research and consult with financial professionals before making investment decisions. These statements are speculative and subject to change based on market developments and company performance.
American Airlines reported record Q1 2026 revenue of $13.9 billion, up 10.8% year-over-year, but posted a GAAP net loss of $382 million due to jet fuel prices exceeding forward curve assumptions by over $400 million. Adjusted EPS came in at negative $0.40, beating the consensus estimate of negative $0.47.
Jet fuel prices averaged $8.63 per gallon in April 2026, roughly $2.03 above the same period in 2025, and the $400 million fuel cost overrun relative to forward curve assumptions was the primary driver of the $382 million net loss. American lacks active financial hedging programmes, meaning it absorbs the full impact of spot price spikes with no derivative protection.
American Airlines guided for full-year 2026 adjusted EPS of $1.70 to $2.70 (midpoint $2.20) and free cash flow exceeding $2 billion, with the wide range reflecting genuine uncertainty about whether fuel prices will stabilise or remain elevated through mid-year.
American's $13.9 billion in Q1 revenue trails Delta's $15.9 billion and United's $14.61 billion, and United posted adjusted EPS of $1.19 compared to American's loss, highlighting American's weaker margin position entering the fuel cost crisis. American also carries the highest debt load among legacy carriers at $34.7 billion and lacks the fuel hedging or refinery assets that provide partial insulation to competitors.
Iran's involvement in Strait of Hormuz disruptions in early 2026 pushed Brent crude above $101 per barrel, driving jet fuel to $8.63 per gallon and inflating American's revised full-year 2026 fuel expense projection to $12.24 billion, up 10.8% from pre-conflict estimates. Even after Iran announced the strait was fully open on April 24, the situation remains fragile, keeping wide uncertainty ranges in American's Q2 and full-year guidance.