Gulf crude exports have largely recovered, with JPMorgan putting Middle East shipments at 98% of pre-war levels in September. Yet eurozone inflation has just hit 3.8%, a three-year high. If the barrels are moving again, why are prices still pushing through to the economy?
The answer matters now. Tanker attacks over the weekend of 3-4 October, a stalled reopening of the Strait of Hormuz and bond yields at multi-decade highs (the US 10-year touched 5.34%, the UK 30-year gilt hit 6%) mean energy prices are shaping interest rates, mortgages and portfolios.
It runs through energy prices, the European Central Bank (ECB), the US Federal Reserve and bond markets as one connected chain, and it shows how oil supply inflation impact reaches your money.
Why do Hormuz disruptions still push prices up when exports are recovering?
Headline export numbers look reassuring. Volume, route, risk and inventory each send a separate price signal, though, and only one of them is about barrels.
What is happening to the flows
Bloomberg reports at least nine commercial ships, including five very large crude carriers, have been damaged since the truce unravelled. The UK Maritime Trade Operations centre (UKMTO) reported two more tankers struck over the weekend of 3-4 October.
Parliament Speaker Ghalibaf says the strait stays shut until seven conditions are met. Iran shipped no crude by tanker in September under the US blockade, the first time since the war began, according to preliminary Bloomberg estimates.
Part of the recovery is rerouting. Roughly 40% of regional crude now leaves by non-Hormuz routes, against 17% before the war, which keeps volumes up while adding cost and risk.
The estimates also disagree, as the table shows. The gaps likely reflect methodology and how bypass routes are counted, though that is not confirmed.
| Source | What it measures | Figure | Period |
|---|---|---|---|
| Vortexa and Goldman Sachs (via El País) | Hormuz crude shipments | About 14M bpd | Late September |
| Yahoo Finance | Hormuz flows | About 9.7M bpd | Late September |
| Vortexa (provisional) | Hormuz flows | About 7.9M bpd | September |
| Al Jazeera | Hormuz crude exports | About 7.4M bpd | September average |
Saudi figures conflict too. Goldman Sachs estimates about 11.6 million barrels per day (bpd) for September, while Bloomberg puts it near 6.1 million; the two are unreconciled.
Treat any single number with caution. “Exports are back” and “prices are calm” are different claims, because risk premia, freight costs and thin inventories keep energy expensive even while barrels move. US diesel sits near US$6.40 a gallon, according to AAA.
War-risk insurance premiums running at roughly 30 times normal rates are one reason risk premia persist, since a declared reopening cannot restore commercial flows until underwriters and maritime unions treat the strait as safe.
Why buffers are not a fix
The G7 agreed an International Energy Agency-coordinated release of up to 100 million barrels over four months. OPEC+ output remains about 5 million bpd below February levels.
These are cushions, not repairs. Matt Stanley of Kpler warns that prolonged inventory drawdowns could create a much bigger supply problem, and Giovanni Staunovo of UBS says the market remains tight.
When big ASX news breaks, our subscribers know first
How does an oil shock turn into inflation, and why did the eurozone print jump?
Start with the mechanism. First-round effects are the direct price rises in fuel, utilities and transport, which lift headline inflation straight away.
Even a one-off energy price jump matters to you because of how inflation erodes wealth: every point of extra price growth quietly cuts the purchasing power of cash and fixed incomes.
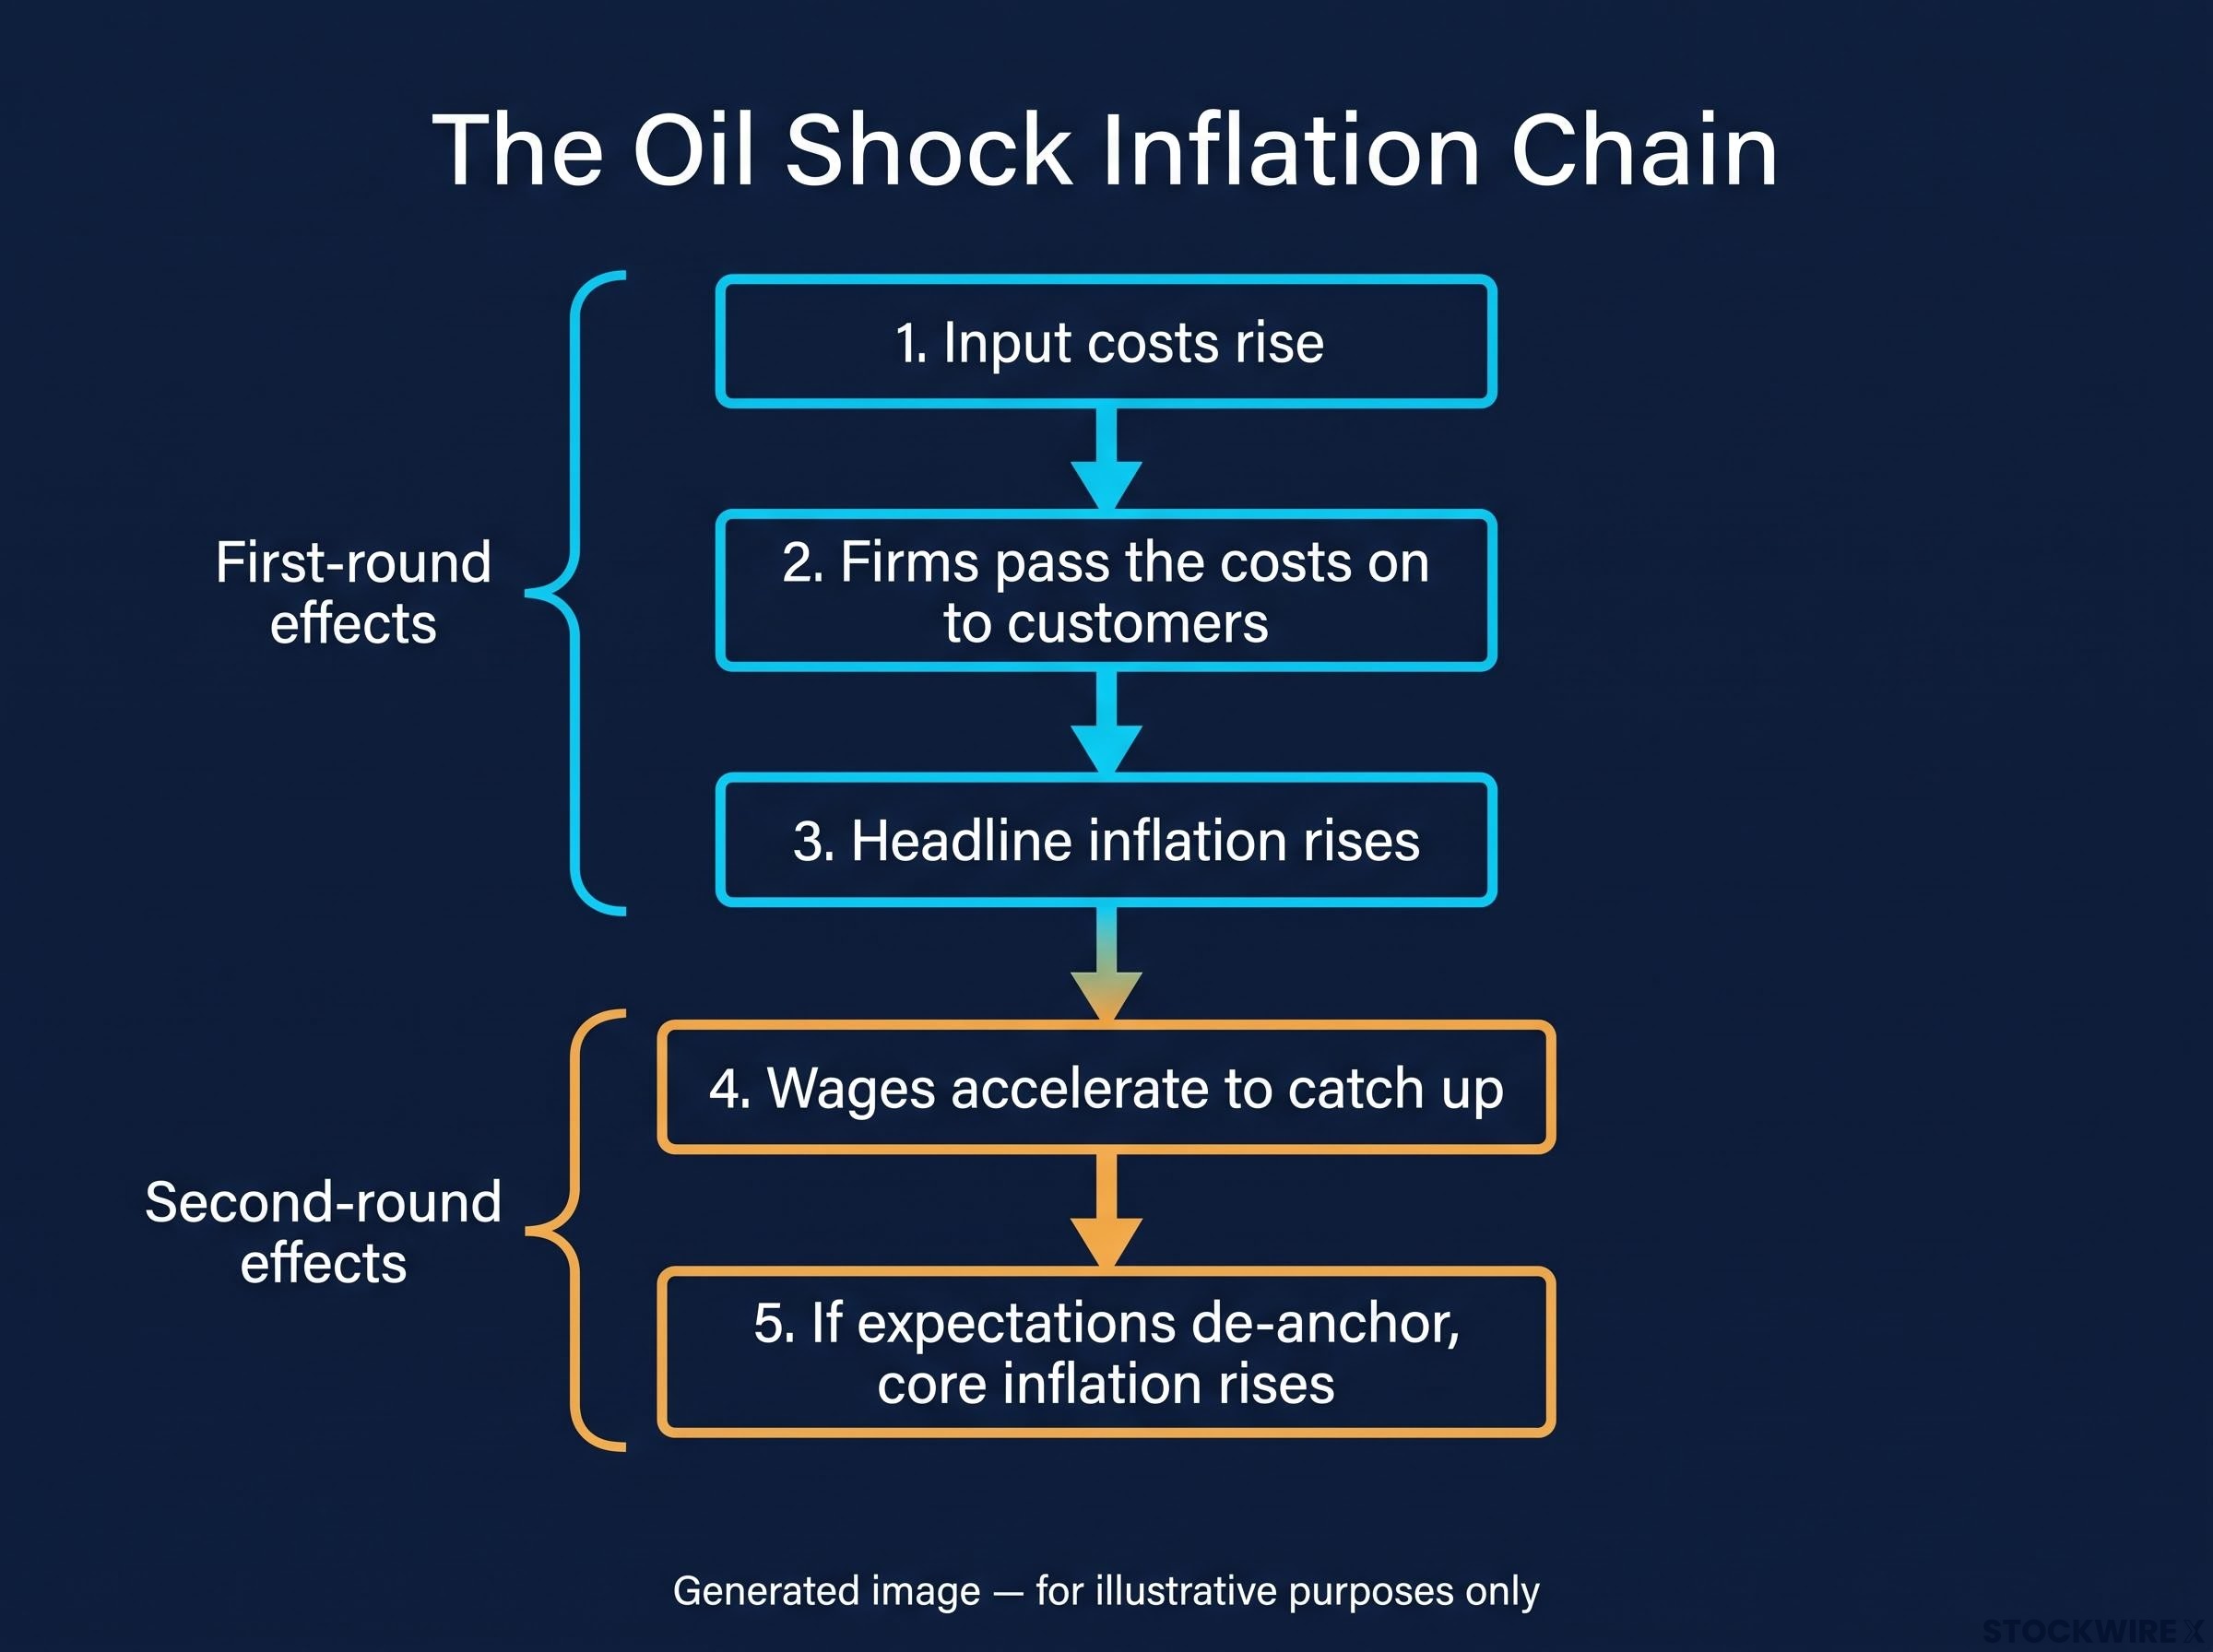
Second-round effects come when those costs spread into wages, wider prices and expectations. The chain runs like this:
- Input costs rise.
- Firms pass the costs on to customers.
- Headline inflation rises.
- Wages accelerate to catch up.
- If expectations de-anchor (people assume high inflation is permanent), core inflation rises and the shock feeds itself.
Central banks treat the two cases differently. A one-off jump in energy prices is a relative-price shock that may warrant a limited response, while generalised inflation calls for tighter policy to re-anchor expectations.
Eurostat’s flash estimate for September shows the theory on real data.
| Measure | September | August |
|---|---|---|
| Headline HICP | 3.8% | 3.2% |
| Energy | 18.8% | 14.3% |
| Core | 2.5% | 2.4% |
Headline beat the 3.6% consensus and is the highest since September 2023. Services ran at 3.2%, food, alcohol and tobacco at 1.4%, and non-energy industrial goods at 1.1%.
The gap between 3.8% headline and 2.5% core tells you the shock is still mostly first-round. The thing to watch is whether core inflation and wages start to follow.
The conflict “continues to generate inflation pressures.” The ECB, 10 September policy statement
Why are the ECB and the Fed in such different positions?
The ECB has already moved. On 10 September it raised all three key rates by 25 basis points (a basis point is one-hundredth of a percentage point), taking the deposit rate to 2.50%, and guided that headline inflation stays “well above target into the first half of 2027.”
The deposit rate is the ECB’s true policy signal, because it reprices the overnight cost of money for every bank in the system, which is why the 25 basis point move carries so much weight.
The Fed faces weaker data. September payrolls rose 29,000 against 90,000 expected, and July and August were revised down by 60,000 combined.
Unemployment rose to 4.2% from 4.1%, driven by new entrants rather than layoffs. Hourly earnings grew 3% year on year, below the 3.4% inflation gauge.
| Factor | ECB | Fed |
|---|---|---|
| Latest move | 25 bp hike on 10 September | No move cited in the research |
| Key data | Headline HICP 3.8% | Payrolls +29,000, unemployment 4.2% |
| Market expectation | Three hikes by end-2027, down from four | October hike odds under 25%, from about 70% |
| Next decision | 28-29 October | December hike expected by JPMorgan |
Analysts are split on October for the ECB, between another hike and a hawkish hold. JPMorgan’s Michael Feroli says a very strong consumer price reading would be needed to make October live for the Fed, and still expects December. TD Securities now forecasts hikes in December and March.
Weak jobs data pushed hikes later, not off the table. Energy-driven inflation keeps rate-cut hopes distant on both sides of the Atlantic.
Both banks face the same dilemma: part of the overshoot is structural supply constraint that rates cannot fix, while part is cyclical and may fade as flows normalise. The stagflation debate splits accordingly:
- Hawks fear that looking through repeated shocks lets expectations drift up, as in the 1970s.
- Doves fear that overtightening against a supply shock deepens a downturn, particularly with high debt and elevated long yields.
What do record-high yields say about oil, inflation and fragmentation risk?
Bond markets are pricing more than the oil price itself.
Yields and term premia
The US 10-year yield hit 5.34%, its highest since 2002, and closed at 5.28%. The UK 30-year gilt touched 6% for the first time since 1998.
A term premium is the extra yield investors demand for holding long-dated bonds. Energy uncertainty, upside inflation surprises and fiscal responses such as subsidies and defence spending lift it, even when policy-rate expectations barely move.
In the euro area, French, Italian, Belgian and Greek spreads widened sharply as Germany drew haven demand. Citi has flagged a possible pause to the ECB’s quantitative tightening (shrinking its bond holdings).
Treasury Secretary Scott Bessent says the rise reflects global trends rather than a US-specific selloff. Broader structural explanations such as demographics and savings are unverified here, so treat them cautiously.
Markets are not uniformly stressed. The S&P 500 rose 0.73% and the Nasdaq 1.19% on the week’s final session.
Lessons from past oil shocks
| Episode | What happened | Lesson for today |
|---|---|---|
| 1973-74 and 1979 | Repeated spikes, loose policy and wage indexation entrenched inflation | Credible policy must stop second-round effects |
| 1990 Gulf War | Short-lived spike as supply proved resilient and reserves were used | Stocks and diversified supply limit duration |
| 2022 European shock | Prices surged and central banks tightened | Targeted support beats broad subsidies |
The common lesson is to respond to second-round effects and expectations rather than every headline. For you, higher long yields can persist even if oil eases, so borrowing costs and bond portfolio risk are not tied one-to-one to crude.
The oil-yield correlation has been breaking down, so oil can fall without dragging long yields with it, which removes a hedge many bond portfolios relied on.
What to watch as supply shocks meet central bank decisions
The chain runs from supply disruption to energy prices, headline inflation, central bank response and bond yields. The decisive question is whether first-round energy effects spill into wages and expectations.
Your watchlist:
- Core inflation and wage data
- The ECB decision on 28-29 October
- US inflation and jobs data ahead of a possible December hike
- Hormuz flow data and tanker incident reports
- Euro-area bond spreads
The 3 November US midterms are a risk marker, since Trump has signalled heavier strikes afterwards. Until core inflation moves, the oil shock stays a headline problem rather than a policy one.
This article is for informational purposes only and should not be considered financial advice. Investors should conduct their own research and consult with financial professionals before making investment decisions. These statements are speculative and subject to change based on market developments.