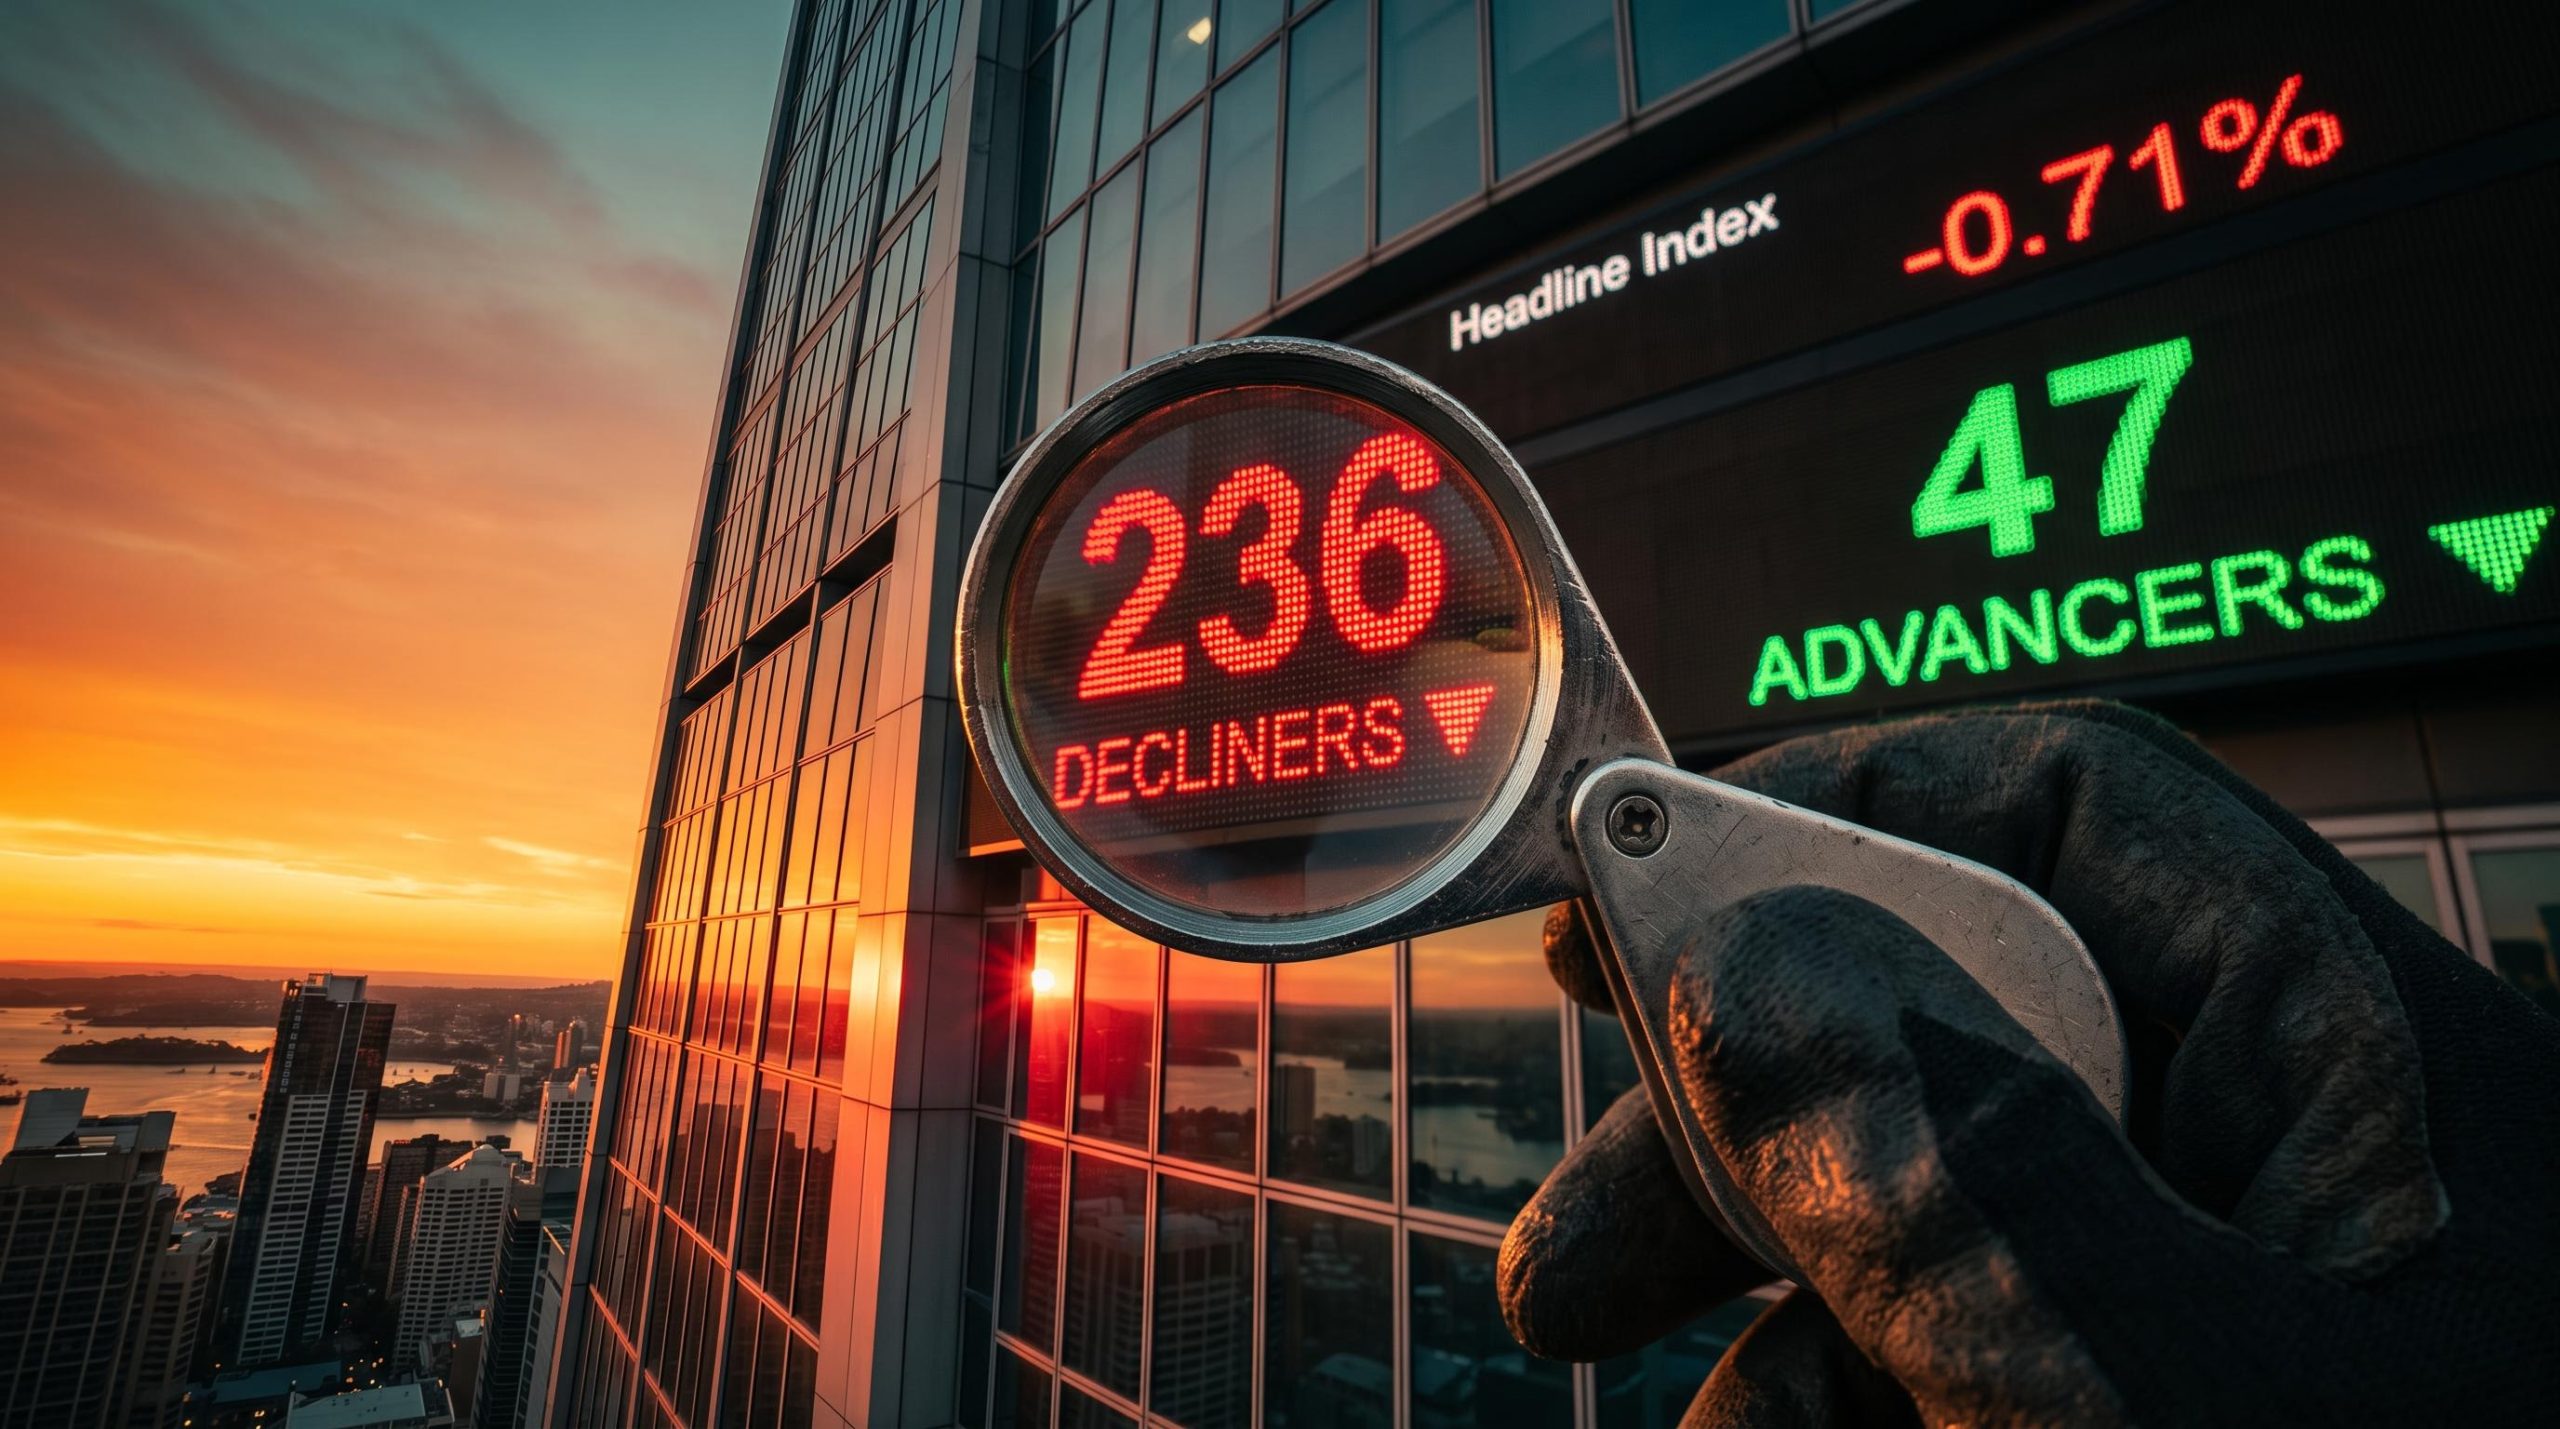
The S&P/ASX 200 printed a black candle on 13 November, falling 0.71% to 9,082.2. It still closed out a third straight weekly gain. If you saw that red bar and assumed the trend had turned, you read the candle and skipped the chart around it, and learning how to read a technical chart starts by fixing that habit.
Run the same checklist across two markets this week and you get two different answers. The Nasdaq looks directionless, with small candles and no side in charge. The ASX 200 still looks intact, despite one heavy session.
Telling those two situations apart is the skill. A single candle rarely settles the question. The trend, the location, the volume and the volatility around it usually do.
Here is a repeatable checklist you can apply to any index chart this week, worked through on live ASX 200 and Nasdaq levels, with a simple way to size your risk once you have a view.
What does a chart checklist actually ask of you?
A chart can show you dozens of indicators at once. The trouble is that a pile of indicators gives you a pile of conflicting signals. A checklist works better because each question has one job, and you answer them in order.
Start with the building block. A candlestick records four prices for a period: the open, high, low and close. The thick part, called the body, shows the distance from open to close. The thin lines, called wicks, show how far price stretched beyond that before settling.
If you are newer to candlestick chart basics, it helps to know that each candle packs open, high, low and close into one shape, and that longer weekly views filter out much of the daily noise.
With that in hand, here are the six questions.

This 6-Step checklist guides you through evaluating trend, location, candle, volatility, volume, and risk.
| Question | What you inspect | What it tells you |
|---|---|---|
| Trend | Higher highs and lows; ribbon slope; price versus ribbon | Directional bias |
| Location | Supply and demand zones; prior highs and lows; the ribbon | Whether price sits at a level that matters |
| Candle | Body, wicks, close, follow-through | Who controlled the period |
| Volatility | Average True Range, range expansion, Bollinger Band width | Quiet consolidation or an unstable move |
| Volume | Volume against its own average | Whether participation confirms the move |
| Risk | Stop, position size, invalidation level | Turns an opinion into a controlled trade |
A supply zone is a price area where sellers have previously overwhelmed buyers. A demand zone is the reverse. Treat both as areas rather than exact turning points. Price can poke into a zone and keep going.
Rule of thumb Trend gives direction, location gives opportunity, the candle gives the trigger, volume gives conviction, and volatility sets your stop and position size.
Working through the questions in that order stops you from acting on a single candle in isolation. By the time you reach the candle, you already know whether it is sitting somewhere meaningful.
When big ASX news breaks, our subscribers know first
What do indecisive candles tell you, and what do they not?
On screen, a doji looks like a cross: a thin horizontal line with wicks above and below. The open and close landed almost on the same price.
The mechanics explain the shape. Buyers pushed price up, sellers sold into that strength or drove it lower, and then the other side absorbed enough to drag the close back near the open. Neither side finished in control.

These Three panels illustrate the appearance and interpretation of a Doji, a Spinning top, and a Black (bearish) candle.
| Candle | Appearance | Typical interpretation |
|---|---|---|
| Doji | Open and close nearly equal | Buyers and sellers cancelled each other out |
| Spinning top | Small body, long upper and lower wicks | Both sides moved price; neither held control |
| Black (bearish) candle | Close below open | Sellers won the session, but context decides its weight |
The CMT Association treats dojis and spinning tops as signs of hesitation or possible reversal, particularly after an extended move. Hesitation is the operative word. Indecision tells you conviction has weakened. It does not tell you which way price goes next.
That answer comes from confirmation: the next candle, where the candle sits relative to support or resistance, volume, and the prevailing trend. A doji at a major moving average carries more information than one floating mid-range. It can still fail, though. If you buy a doji at support and the next session breaks that level on expanding volume, the setup is gone.
Reading the Nasdaq
The Nasdaq Composite fell 5.52% to 24,315 on 5 November and was reported to have entered a technical correction, ending more than 10% below its October record close. The small-bodied candles since then are what Carl Capolingua’s ChartWatch describes as directionless, with no conviction from either side.
After a sharp fall, indecision means selling has stopped accelerating. It does not mean an uptrend has begun. A break above the indecision candle’s high, ideally on stronger volume, would add evidence for buyers.
Reading the ASX 200
The 13 November black candle shows sellers won that day. The index still sits above its broader trend support, though, and finished the week up 61.4 points. The checklist stays positive.
Breadth deserves more of your attention than the candle. In the wider S&P/ASX 300, advancers trailed decliners 47 to 236. A black candle inside an intact uptrend tells you about one session. Weak breadth, meaning few stocks joined in, is the detail to watch next.
ASX 200 breadth has proved a useful early warning before: in July, a mild index decline hid roughly four decliners for every advancer across the ASX 300, and the headline only caught up later.
How do trend ribbons and supply and demand zones work together?
A trend ribbon is a group of moving averages plotted together. A moving average is the average closing price over a set number of past sessions, updated each day. Because those averages roughly track what recent buyers paid, the ribbon approximates their cost base.
That is why, in an uptrend, the ribbon acts as a dynamic demand zone. A pullback into it tests whether recent buyers still defend their entry. A decisive close below it, especially on expanding volume, suggests trend support has failed.
Read the ribbon’s shape as well as its position:
- Rising and ordered: an established uptrend
- Falling: sustained downward pressure
- Widening: strengthening momentum
- Flat or compressed: consolidation or fading conviction
Then layer in the other checklist questions. Volatility bands widen when volatility rises and contract when markets calm. CMT volume material notes that rising prices are more credible on above-average volume, and that compressed volatility can come before vigorous moves. Brian Shannon, CMT, points to pullbacks to the 20-day moving average or VWAP as areas where buyers often emerge. VWAP, or volume-weighted average price, is the average price weighted by how much traded at each level.
Here are the latest ChartWatch levels.
| Index | Zone type | Level | Date |
|---|---|---|---|
| ASX 200 | Supply | 9,221-9,297 | 13 November 2026 |
| ASX 200 | Short-term ribbon demand | 8,901-8,943 | 13 November 2026 |
| ASX 200 | Earlier demand | 8,613-8,641 | 13 November 2026 |
| Nasdaq | Long-term ribbon supply | 24,919-25,675 | 13 November 2026 |
| Nasdaq | Short-term ribbon supply | 25,708-25,958 | 13 November 2026 |
| Nasdaq | Potential demand | 23,722-24,425 | 13 November 2026 |
These replace the 6 November read, which had ASX 200 demand at 8,795-8,845. Zones move as the ribbon moves, so always work from the latest update.
The backdrop matters too. US bond yields are rising, the Australian dollar is near US$0.68, and StoneX reported that Australia’s 10-year yield slipped below the US equivalent for the first time in nearly 15 months. These levels turn a vague opinion into specific prices where your view is either confirmed or proven wrong.
For readers wanting to sharpen their zone mapping, our deep-dive into how professionals read technical levels explains why stacking two independent structural factors makes a level credible.
How might you split risk between the ASX 200 and the Nasdaq?
Once you have a read on each chart, the question becomes how much to risk on each. Allocate by risk budget, not equal cash. Capolingua, for example, holds a third of his risk position in US stocks and two-thirds in Australian shares, some of it in shorts. That reflects his read of a directionless Nasdaq and a positive ASX 200 checklist. It is one example, not a recommendation.
The two indices hold different businesses. The ASX 200 leans on banks, miners, energy and materials. The Nasdaq leans on technology, semiconductors and large growth companies. In global risk-off episodes, though, they can fall together. When both react to the same driver, such as higher US yields, your combined risk is larger than either position suggests.
Currency adds another layer. Unhedged US holdings expose you to both the share price and AUD/USD.
A five-step process keeps this manageable:
- Set your maximum acceptable portfolio loss across all positions.
- Give each market a smaller risk budget within that limit.
- Cut nominal size when markets move together or share a macro driver.
- Size using stop distance and volatility, with position size equal to your permitted dollar loss divided by the distance from entry to stop.
- Reassess correlation during stress, when markets tend to move together most.
Where chart reading fails
Technical analysis gives you probabilities, not guarantees. Signals can be false, indicators lag price, two people can read the same chart differently, and earnings, central bank decisions or overnight US moves can override any pattern. The controls are simple. Define your invalidation level before entry, risk a fixed modest fraction per trade, require several checklist factors to agree, and cut size when volatility expands.
Leverage is the main way a good read still goes wrong.
ASIC on CFDs In January 2026, ASIC reported that 68% of retail CFD investors lost money in the 2023-24 financial year, with aggregate losses above $458 million, including $73 million in fees.
A contract for difference (CFD) is a leveraged product that lets you bet on price moves without owning the asset. That figure does not disprove chart analysis. It does show why you should never raise leverage just because a chart looks attractive.
Turning the checklist into a weekly routine
The method fits on a sticky note. Each week, run all six questions on both charts, in order: trend, location, candle, volatility, volume, risk. Write down your invalidation level before you act, not after.
An earlier supply zone test on the ASX 200 showed how pre-mapped triggers on both sides, a high-volume close above supply or a close below the floor, turn a chart view into specific actions.
For the week ahead, the ASX 200 levels to watch are ribbon demand near 8,901-8,943 below and supply up to 9,297 above, with breadth as the tell. On the Nasdaq, the question is whether its candles gain conviction as price approaches ribbon supply, or stall there.
Your decision point is simple. If the checklist agrees, size the position against your stop. If it does not, waiting is a valid position.
This article is for informational purposes only and should not be considered financial advice. Investors should conduct their own research and consult with financial professionals before making investment decisions. Past performance does not guarantee future results, and historical chart patterns are subject to market conditions and various risk factors.