
Charter Hall Long WALE REIT delivers 2% earnings growth and issues FY27 guidance
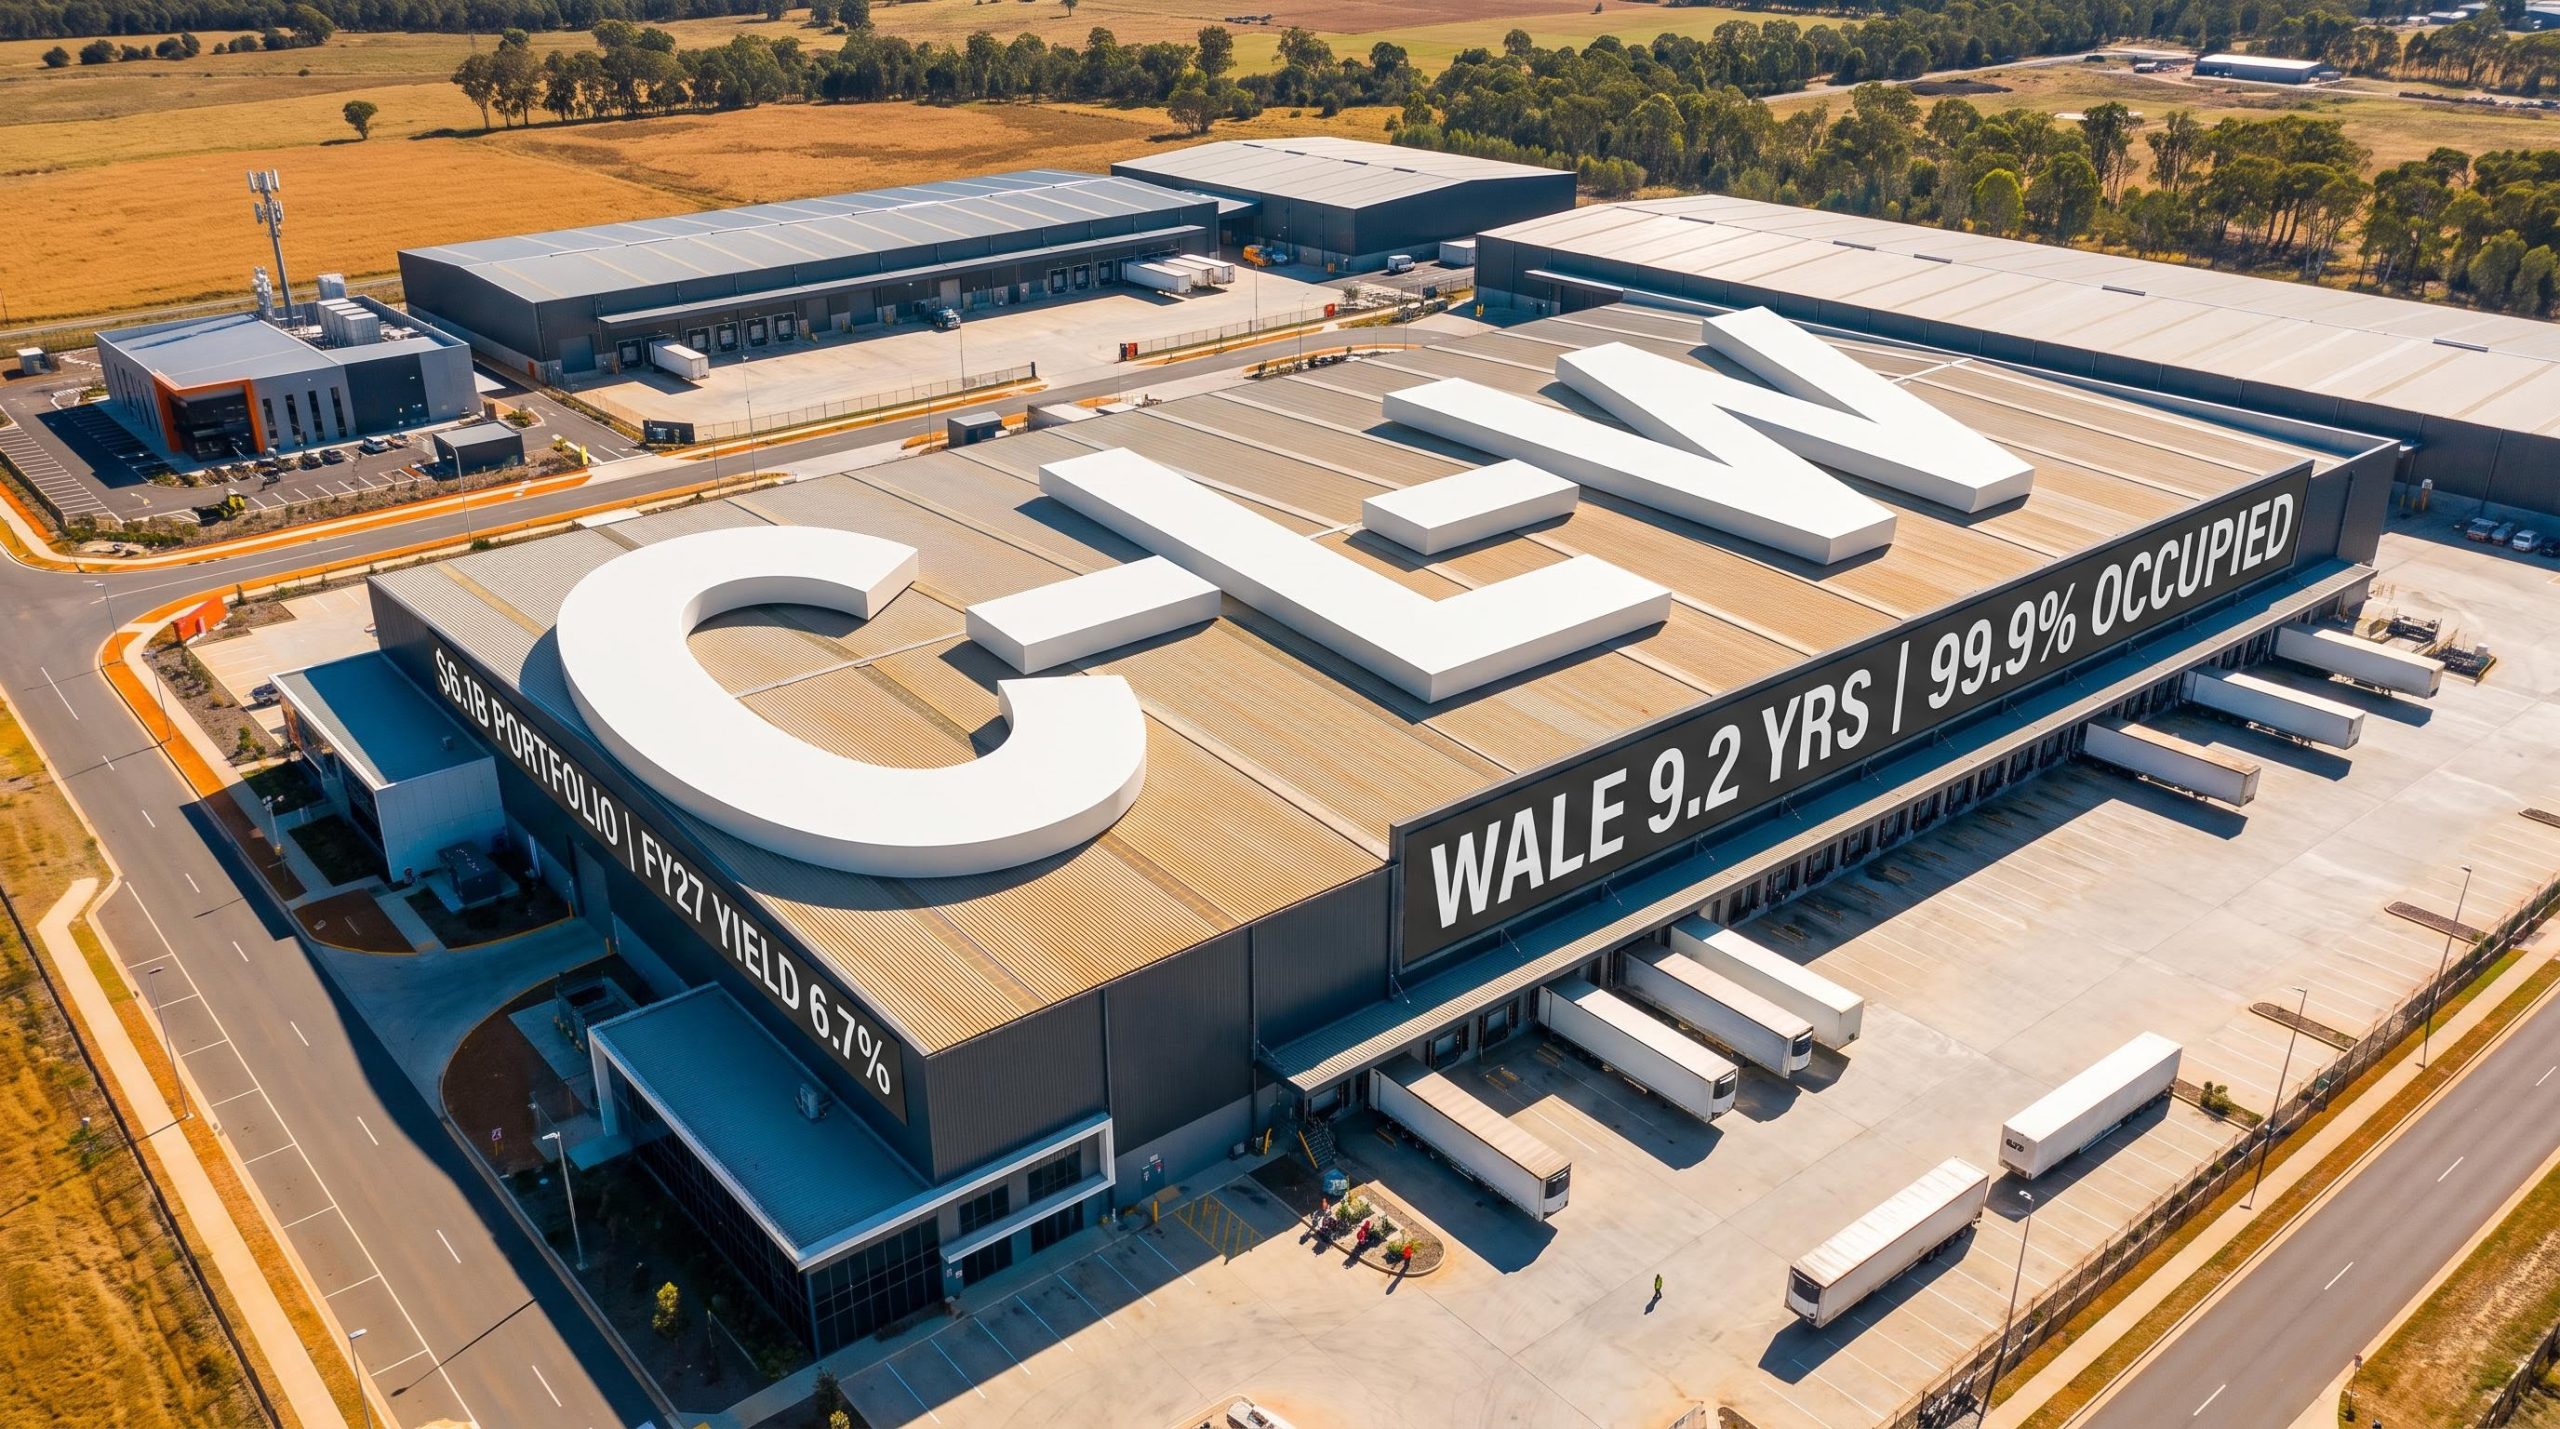
In its FY26 full year results presentation released on 12 August 2026, Charter Hall Long WALE REIT reported operating earnings and distributions per security of 25.5 cents, in line with guidance and reflecting 2% annual growth on FY25. Coverage of the presentation frames the REIT as Australia’s largest diversified Net Lease REIT, anchored by a $6.1 billion property portfolio.
Management provided FY27 guidance at 25.5 cents per security, representing a forward distribution yield of 6.7% based on the closing security price of $3.79 as at 12 August 2026. The result was supported by portfolio revaluations, disciplined transaction activity, and a comprehensive refinance of balance sheet debt.
Key headline metrics for the 12 months to 30 June 2026 included:
- Operating EPS and DPS of 25.5 cps (up 2%)
- Net tangible assets (NTA) per security of $4.71 (up 2.6%)
- Portfolio WALE of 9.2 years
- Balance sheet gearing of 27.5%
When big ASX news breaks, our subscribers know first
FY26 results at a glance
The presentation grouped the year’s performance across three pillars: financial performance, portfolio performance, and capital management. The table below summarises the headline outcomes reported for the period.
| Metric | Result | Detail |
|---|---|---|
| Operating EPS & DPS | 25.5 cps | +2% on FY25, in line with guidance |
| NTA per security | $4.71 | +2.6% from 30 June 2025 |
| Net valuation uplift | $188m | +3.2% property valuation increase |
| Net acquisitions | $248m | Earnings accretive |
| Balance sheet gearing | 27.5% | Lower end of 25–35% target range |
A refinanced balance sheet built for flexibility
A central theme of the update was the completion in June 2026 of a comprehensive refinance and transition of balance sheet debt to a new $2.0 billion secured platform. Management outlined that the exercise extended maturities, reduced the cost of debt, and increased covenant headroom.
The CLW debt refinance completed in June 2026 replaced all existing balance sheet debt, including previously issued Medium-Term Notes, across ten separate lending counterparties, cutting the credit margin from 1.4% to 1.2% and extending weighted average maturity from 2.7 years to 4.3 years.
The presentation detailed four benefits of the new platform:
-
Average debt maturity extended by 1.6 years to 4.3 years across balance sheet debt, with maturities staggered from FY29 to FY32 across 10 separate lending counterparties.
-
An average credit margin of 1.2%, a 20 basis point reduction from prior facilities, described as delivering immediate interest cost savings and earnings accretion.
-
An improved covenant package featuring a 65% balance sheet LVR covenant, a 1.50x ICR covenant, and no look-through covenants.
-
A weighted average cost of debt of 4.7%, with a highly hedged position of 85% average hedging across FY27.
For income investors, the significance is direct. A lower cost of debt is earnings accretive, while the extended maturities and diversified lender base reduce refinance risk across the forward years.
Understanding the Net Lease REIT model
For readers less familiar with the sector, a “Net Lease” REIT owns properties leased to tenants under agreements where the tenant pays most property operating expenses. A “Long WALE” REIT holds these assets under leases with long remaining terms, providing predictable income over extended periods.
WALE stands for Weighted Average Lease Expiry. It measures the average time remaining on a portfolio’s leases, weighted by income. A 9.2-year WALE means the REIT has, on average, more than nine years of contracted rent locked in before leases expire, supporting stable and forecastable distributions.
The term “NNN” refers to a triple net lease, where the tenant covers the majority of property expenses such as maintenance, insurance and outgoings. Many of the REIT’s leases also carry CPI-linked rent reviews, meaning rents adjust with inflation and provide a measure of inflation protection.
Key features of the strategy reported in the presentation include:
- Long leases to blue-chip corporate and government tenants
- 100% of leases carry annual contracted rent increases
- 54% of lease rent reviews by income are CPI-linked, providing inflation protection
- Leases representing 89% of net passing income are capital-efficient net, double net or triple net leases
This model underpins the reliable, growing distribution that sits at the centre of the REIT’s investment appeal.
Portfolio curation drives quality and long-term income
The REIT reported $248 million of earnings accretive net transaction activity during the period, comprising $571.7m of investments settled at a weighted average yield of 7.4% against $323.6m of divestments at a 4.7% yield.
Management outlined a strategic pivot toward long WALE social infrastructure. Highlights included the Telco Exchanges portfolio ($63.0m for an increased interest, leased to Telstra), a 25% interest in the Sonic Healthcare central laboratory in Brisbane ($53.4m, on a 20-year NNN lease), and a 49.9% interest in the Coles CoreWest Distribution Centre, which is 100% pre-leased to Coles for an initial 20-year term.
The presentation also noted that practical completion was reached during 2H FY26 on the cold storage expansion at Coles’ Perth Airport Distribution Centre, resetting the remaining lease term to 12 years across the entire facility.
Portfolio snapshot
| Sector | Valuation ($m) | % Portfolio | WALE (yrs) | Occupancy |
|---|---|---|---|---|
| Convenience Net Lease retail | 2,743 | 44.9% | 8.8 | 100.0% |
| Industrial & logistics | 1,324 | 21.7% | 13.9 | 100.0% |
| Data centres & social infrastructure | 1,043 | 17.1% | 9.4 | 100.0% |
| Office | 1,003 | 16.4% | 5.6 | 99.7% |
| Total / weighted avg | 6,113 | 100% | 9.2 | 99.9% |
The presentation restated the strategy that guides this portfolio curation:
CLW Diversified Long WALE Net Lease Strategy
“To provide investors with stable and secure income and targeting both income and capital growth through an exposure to a diversified portfolio of long WALE properties leased to corporate and government tenants.”
Financial performance and portfolio strength
Earnings drivers included like-for-like net property income growth of 3.0% and operating earnings of $181.9m, up 1.8% on the prior period. The presentation noted that finance costs rose 18.4% to $107.1m, driven by transaction activity combined with a higher cost of debt, though the refinance is positioned to reduce this pressure going forward.
Portfolio quality metrics reinforced the income case. The REIT held 505 properties with 99.9% occupancy by income, 99% leased to blue-chip tenants by income, and 3.1% average annual rent growth, with 79% of the portfolio located on the Eastern Seaboard.
The $188m revaluation uplift represented a 3.2% increase in property values, with the weighted average capitalisation rate held steady at 5.4%.
Tenant exposure remained concentrated in defensive, non-discretionary industries:
- Government 21%
- Hospitality convenience retail 20%
- Grocery & distribution 13%
- Data centres & telecommunications 13%
- Energy & convenience retail 11%
The income case, a 6.7% yield in context
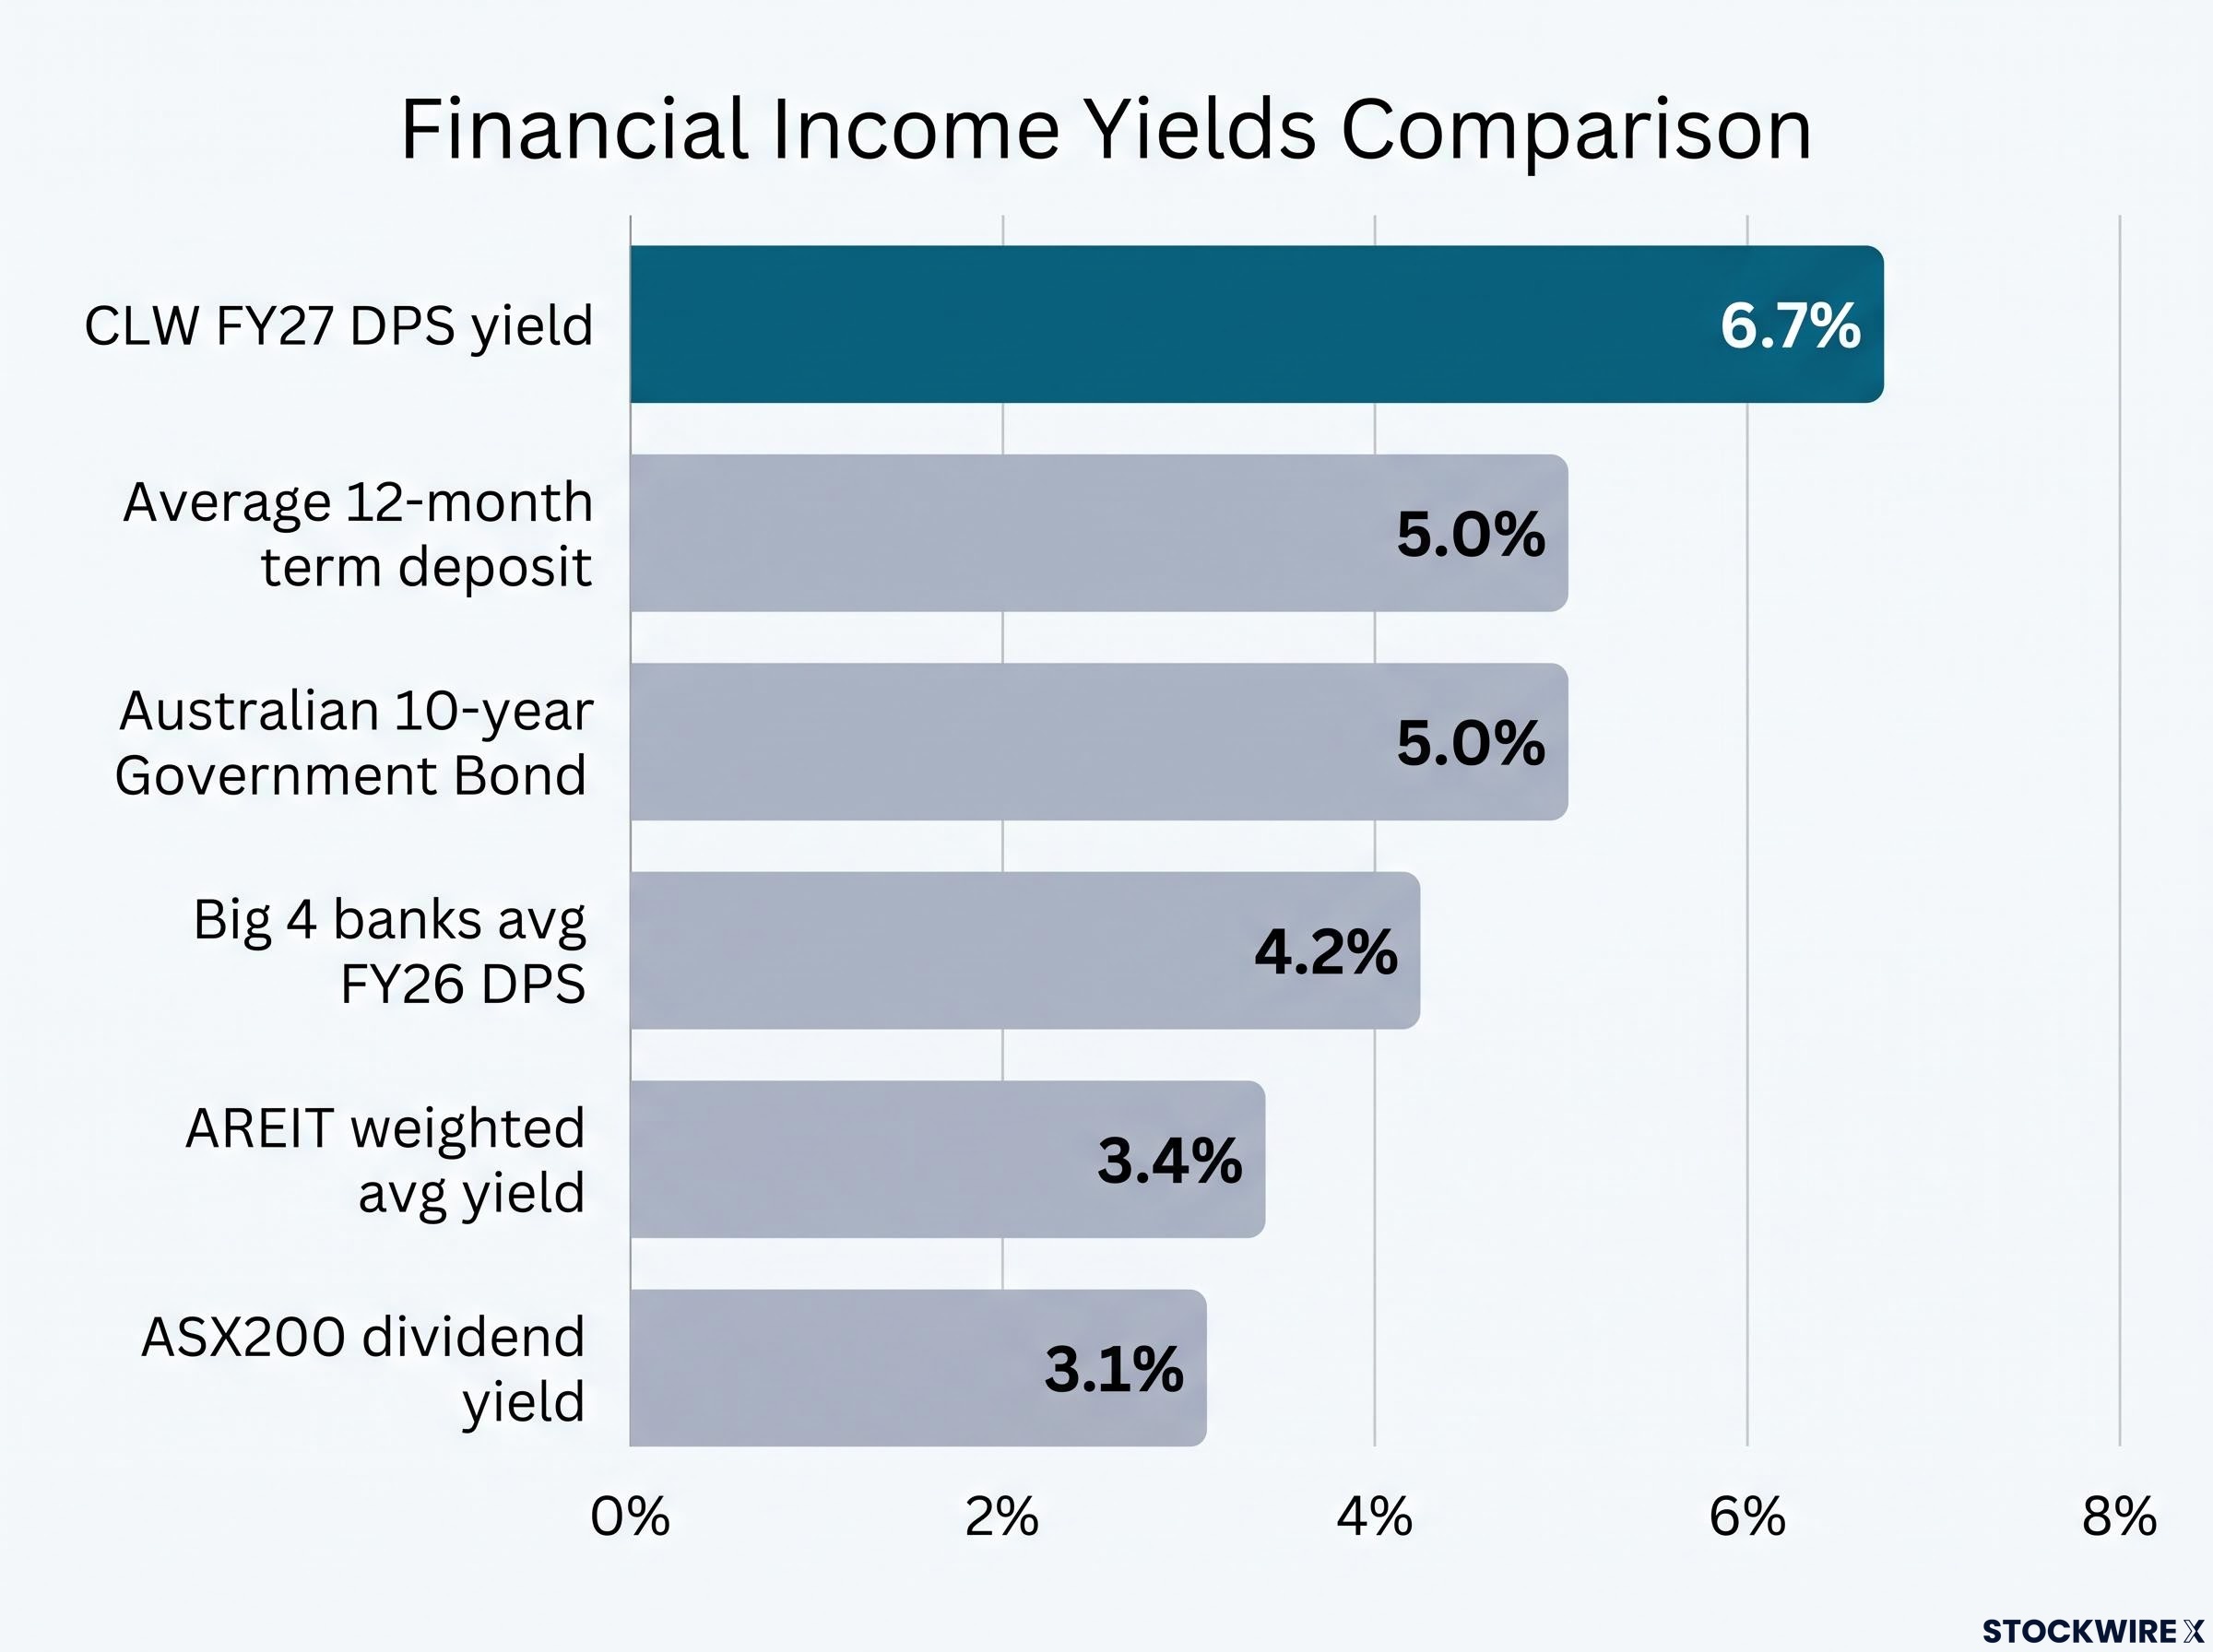
A core element of the presentation was the REIT’s forward distribution yield relative to alternative income sources. Based on FY27 DPS guidance of 25.5 cps divided by the $3.79 closing security price as at 12 August 2026, the yield comparison was presented as follows:
- CLW FY27 DPS yield: 6.7%
- Average 12-month term deposit: 5.0%
- Australian 10-year Government Bond: 5.0%
- Big 4 banks average FY26 DPS yield: 4.2%
- AREIT weighted average yield: 3.4%
- ASX200 dividend yield: 3.1%
The yield premium over cash, bonds and broader equity benchmarks, backed by a 9.2-year WALE and near-full occupancy, forms the core of the REIT’s income argument.
Outlook and FY27 guidance
Management reaffirmed FY27 guidance for operating EPS of 25.5 cps and DPS of 25.5 cps, representing a 6.7% distribution yield, based upon information currently available and barring unforeseen events. Guidance already incorporates recent transaction activity.
- Operating EPS: 25.5 cps
- DPS: 25.5 cps
- Distribution yield: 6.7%
Among the forward catalysts, the Coles CoreWest Distribution Centre is progressing ahead of program and forecast to reach completion in 2H FY27. The presentation reinforced the REIT’s strategic priorities of portfolio curation, capital recycling, diversification across key asset classes, and a focus on mission-critical assets for tenant operations.
The update closed on the portfolio’s WALE+ figure of over 30 years, which reflects the exercise of all lease option terms across the REIT’s NNN portfolio, underscoring the potential duration of income from its blue-chip tenant base.
Don’t Miss the Next ASX Real Estate Alert
Big News Blast delivers FREE breaking ASX announcements straight to your inbox within minutes of release, complete with in-depth analysis already done. Over 20,000 active subscribers rely on it to stay ahead of the market across key non-resource sectors. Click the “Free Alerts” button to start receiving real-time coverage the moment news breaks.